. 2022 Sep 5;219(9):e20212311.
doi: 10.1084/jem.20212311. Epub 2022 Aug 8.

Helminth-induced reprogramming of the stem cell compartment inhibits type 2 immunity

Affiliations

Helminth-induced reprogramming of the stem cell compartment inhibits type 2 immunity

Danielle Karo-Atar et al. J Exp Med. .

Abstract

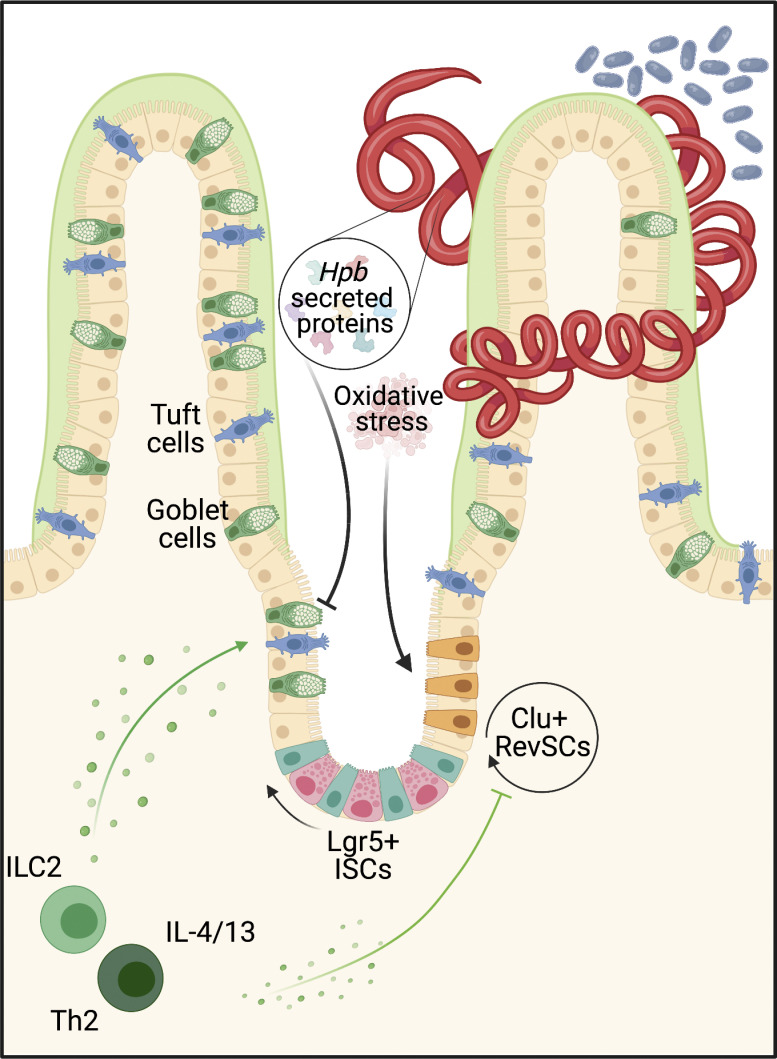
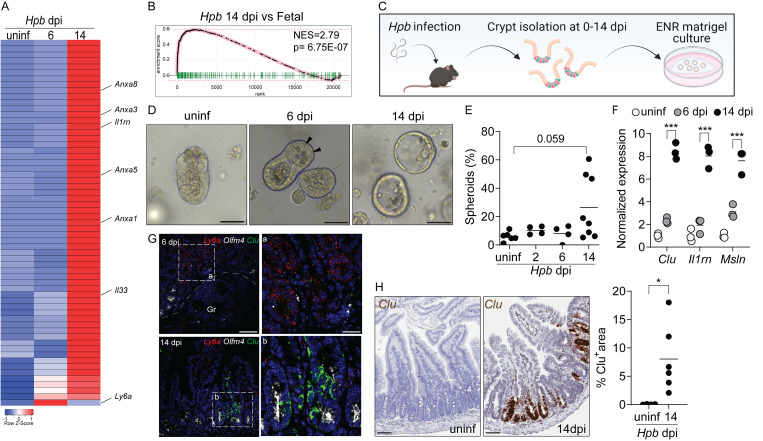
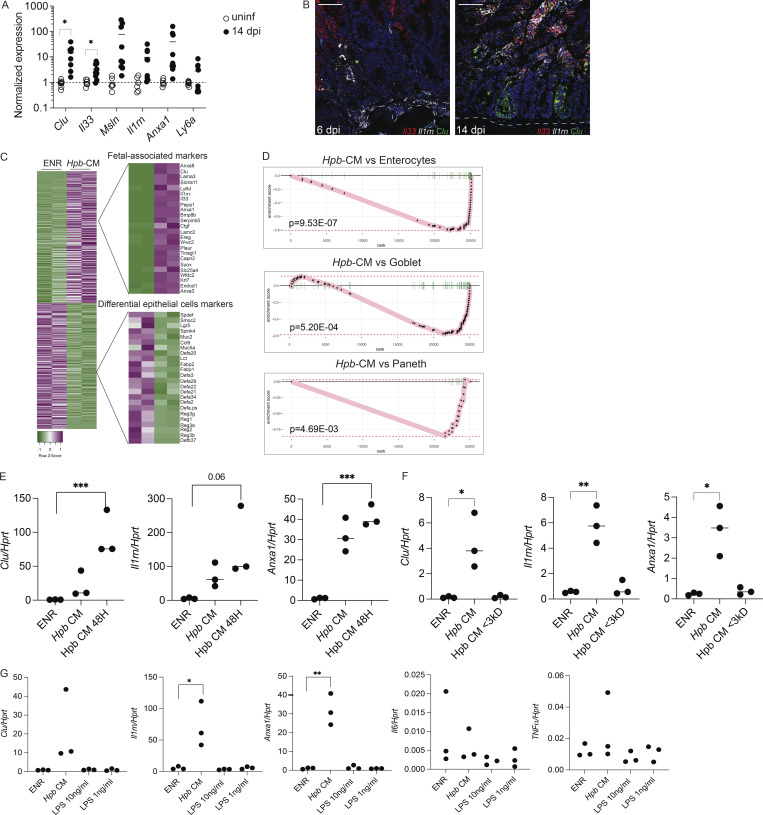
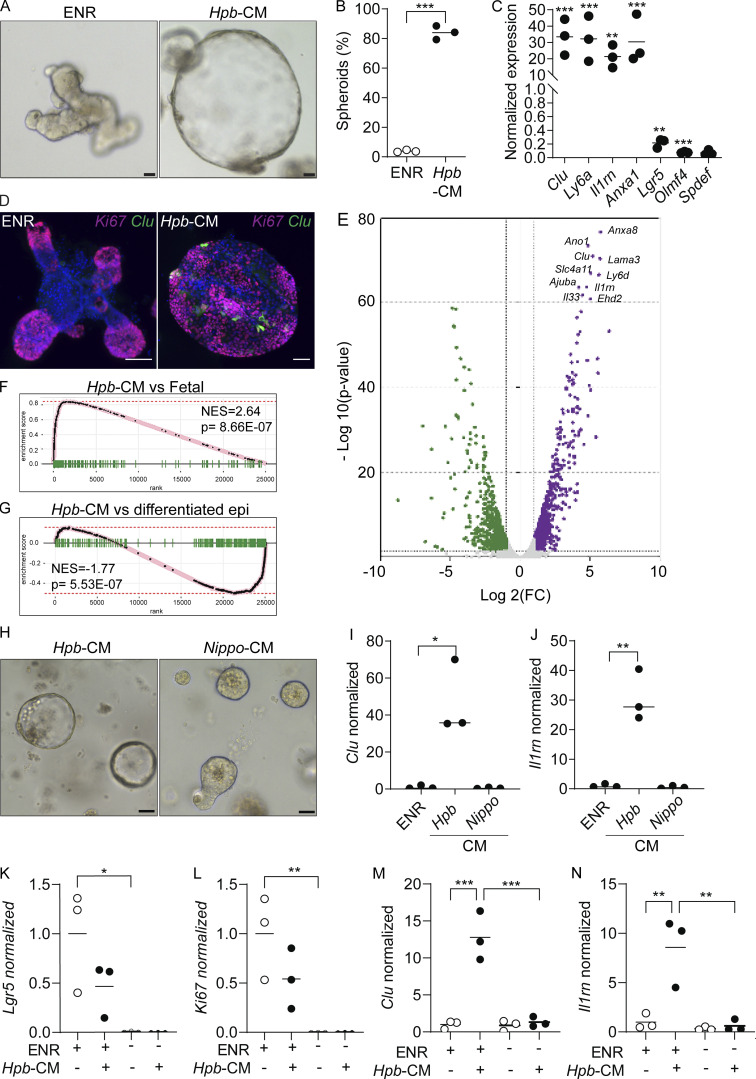
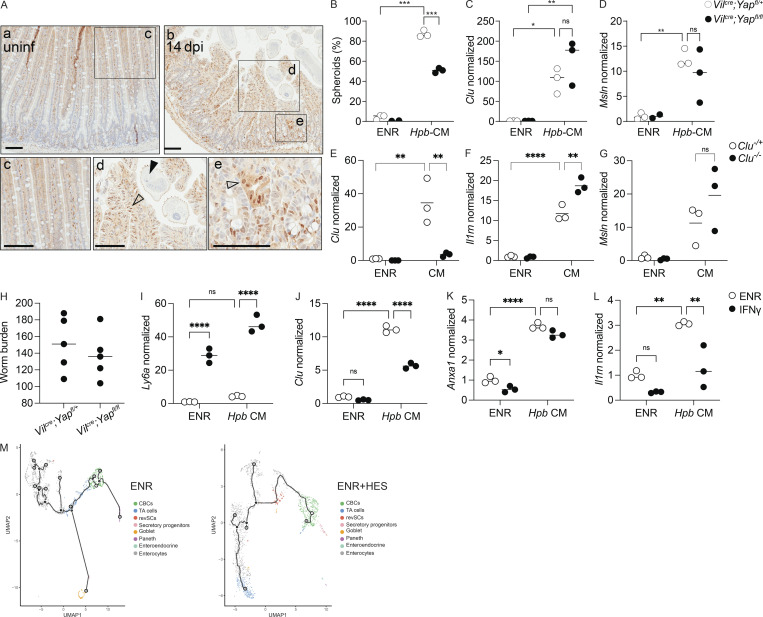
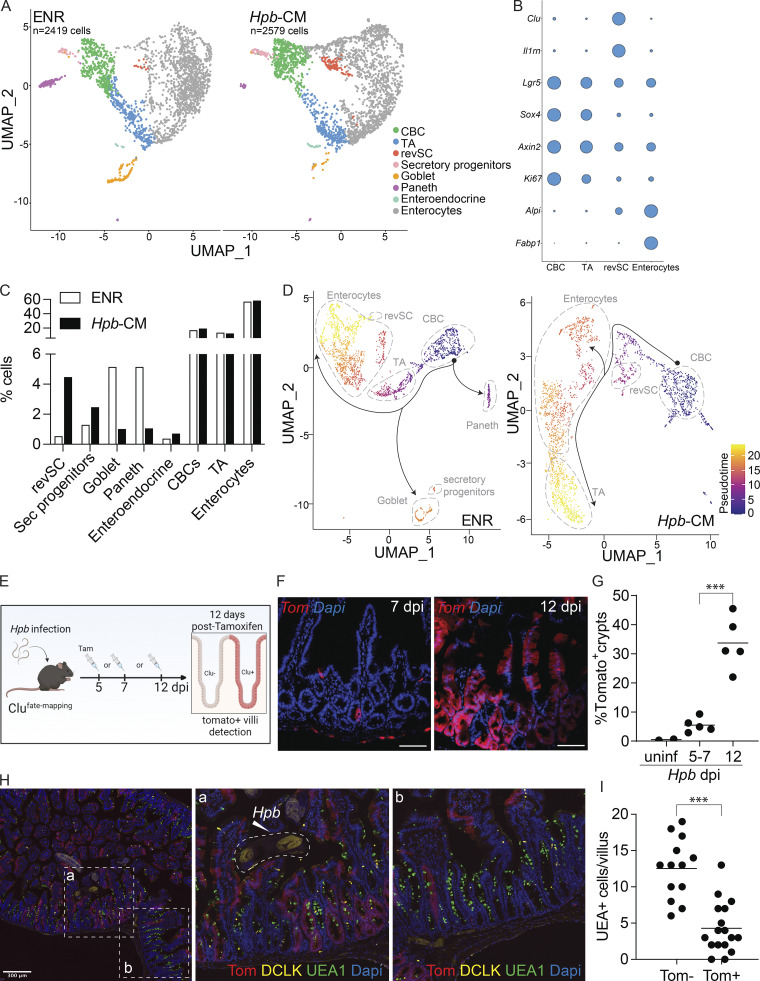
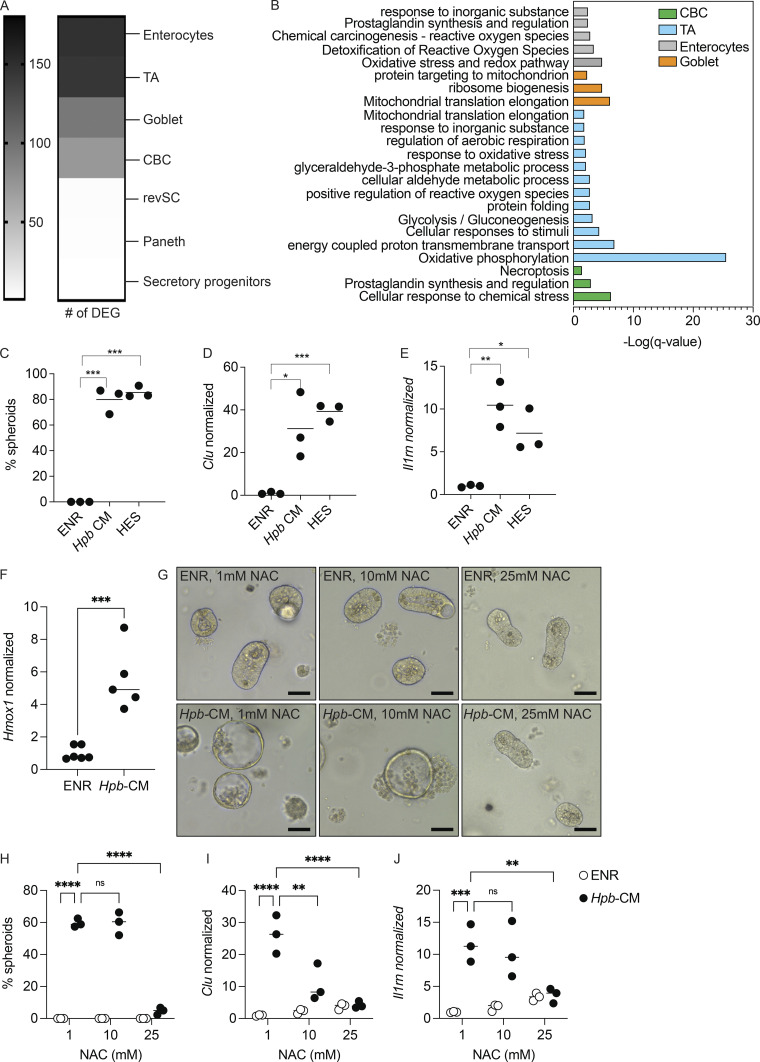
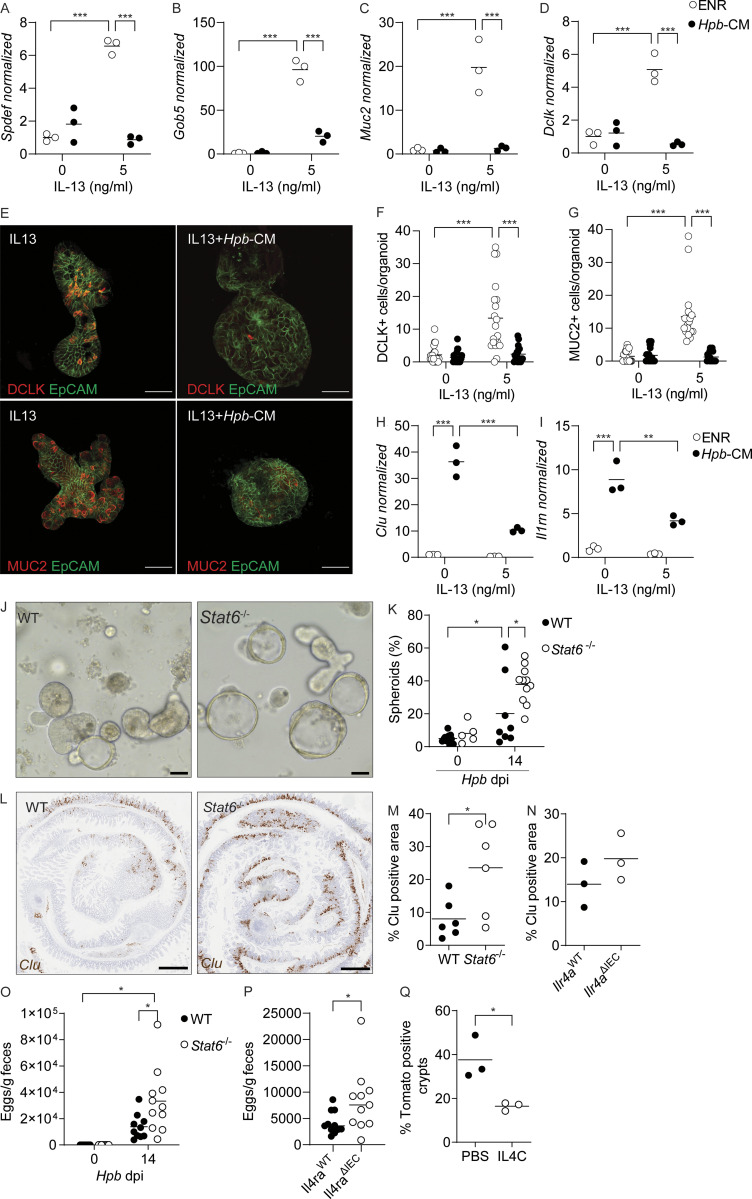
Enteric helminths form intimate physical connections with the intestinal epithelium, yet their ability to directly alter epithelial stem cell fate has not been resolved. Here we demonstrate that infection of mice with the parasite Heligmosomoides polygyrus bakeri (Hpb) reprograms the intestinal epithelium into a fetal-like state marked by the emergence of Clusterin-expressing revival stem cells (revSCs). Organoid-based studies using parasite-derived excretory-secretory products reveal that Hpb-mediated revSC generation occurs independently of host-derived immune signals and inhibits type 2 cytokine-driven differentiation of secretory epithelial lineages that promote their expulsion. Reciprocally, type 2 cytokine signals limit revSC differentiation and, consequently, Hpb fitness, indicating that helminths compete with their host for control of the intestinal stem cell compartment to promote continuation of their life cycle.


Conflict of interest statement

Disclosures: The authors declare no competing interests exist.

Figures

None
Graphical abstract
Figure 1.
Figure 1.
A fetal-associated transcriptional signature at the luminal stage of Hpb infection. (A) Analysis of RNA-seq dataset (Gentile et al., 2020) showing reads per kilobase million of fetal-associated genes (Mustata et al., 2013) in duodenal tissue 6 and 14 dpi. Specific genes of interest are depicted by name. Heatmap was created using the Heatmapper web tool (Babicki et al., 2016); uninf, uninfected. (B) GSEA of fetal-associated transcripts 14 dpi (in comparison to Mustata et al., 2013). NES, normalized enrichment score. (C–E) C57BL/6 mice were infected with 150 L3 Hpb larvae, and SI crypts were extracted 2, 6, and 14 dpi and plated in Matrigel domes for 24–48 h. Image in C created with Biorender.com. (D) Representative photomicrographs of organoids cultured from Hpb-infected intestines, 24 h after culture time point; arrowheads indicate Paneth cells. (E) Frequency of organoids with spheroid morphology. (F) qPCR analysis of organoids cultured from Hpb-infected intestines. (G) RNAscope of fetal-associated transcripts in Hpb-infected tissue. a and b are enlarged insets from left panels; Gr, granuloma. (H) Colorimetric RNAscope of Clu mRNA and quantification of Clu+ areas. Scale bar, 50 μm (D–G); 100 μm (H). Data shown are representative of one (A and B) or two or more (D–H) independent experiments, n > 3 biological replicates. Statistical tests: nonparametric one-way ANOVA (E), t test (F and H); *, P < 0.05; ***, P < 0.005.
Figure S1.
Figure S1.
Fetal reversion of the intestinal epithelium at the luminal stage of Hpb infection and following Hpb-CM stimulation of SI organoids. Related to Figs. 1 and 2. (A) Epithelial cells were extracted from the SI of uninfected mice on day 14 after Hpb infection, and expression of the indicated fetal genes was assessed by qPCR. (B) RNAscope of Il33, Il1rn, and Clu on days 6 and 14 after Hpb infection of SI tissues. (C) Heatmap of reads per kilobase million was created using the Heatmapper web tool (Babicki et al., 2016). (D) GSEA of transcripts associated with mature enterocytes, goblet cells, and Paneth cells following Hpb-CM stimulation of organoids. To exclude the possibility of endotoxin or host protein contamination in Hpb-CM, the following three experiments were performed: (E) Hpb adult worms were incubated in organoid basal medium. 24 h later, CM was collected (Hpb-CM), and the worms were moved into fresh organoid basal medium for an additional 24 h. At the 48-h time point, CM was collected again (Hpb-CM 48H). SI organoids were stimulated on day 0 of culture with Hpb-CM, Hpb-CM 48H, or control ENR medium. qPCR analysis of selected fetal-associated genes is shown. (F) Hpb-CM was passed through a 3-kD filter, and the flowthrough was collected. SI organoids were stimulated on day 0 of culture with crude Hpb-CM, flowthrough fraction of Hpb-CM (Hpb-CM <3 kD), or control ENR medium. (G) SI organoids were stimulated on day 0 of culture with Hpb-CM, 1 ng/ml LPS, 10 ng/ml LPS, or control ENR medium. qPCR analysis of selected fetal-associated genes as well as Il6 and Tnfa is shown. Scale bar, 50 μm. Data shown are representative of two independent experiments (A, B, and E–G) or one independent experiment (C and D), n > 3 biological replicates. Statistical tests: t test (A–G); *, P < 0.05; **, P < 0.01; ***, P < 0.005.
Figure 2.
Figure 2.
Hpb-CM directly induces fetal reversion of intestinal organoids. (A) SI organoids were stimulated with ENR (control) or Hpb-CM medium for 24 h after 3 d in culture. (B) Frequency of organoids with a spheroid morphology. (C) qPCR analysis of SI organoids stimulated with Hpb-CM for 24 h from the plating of fresh crypts. (D) Confocal photomicrographs of SI organoids from CluGFP crypts (Ayyaz et al., 2019) stimulated with Hpb-CM for 24 h on day 3 of culture. (E) Volcano plot of differentially expressed genes from RNA-seq analysis comparing Hpb-CM–treated organoids to control organoids, false discovery rate < 0.05. For a complete list of differentially expressed genes, see Table S1. (F and G) GSEA of fetal-associated transcripts (F) and differentiated epithelial cell markers (G). NES, normalized enrichment score. (H–J) Representative photomicrographs (H) and qPCR analysis (I and J) of SI organoids stimulated with Nippo-CM for 24 h. (K–N) qPCR analysis of SI established organoids stimulated with Hpb-CM for 24 h in the presence or absence of ENR. Scale bar, 50 μm. Data shown are representative of two or more independent experiments, n = 3 biological replicates; statistical tests: t test (B, C, I, and J), two-way ANOVA (K–N); *, P < 0.05; **, P < 0.01; ***, P < 0.005.
Figure S2.
Figure S2.
Fetal-like reprogramming is partially Yap dependent and is not amplified by IFNγ. Related to Figs. 1, 2, and 3. (A) Immunohistochemistry for active YAP; squares, area in bottom panel; open arrowheads, nuclear YAP expression; black arrowheads, worm presence. (B–D) qPCR analysis of the indicated genes from Yap−/− and littermate control SI organoids stimulated with Hpb-CM for 24 h. (E–G) qPCR analysis of Clu−/− and littermate control SI organoids stimulated with Hpb-CM for 24 h. (H–K) Vilcre;Yapfl/fl and littermate control Vilcre;Yapfl/+ mice were infected with 150 L3 Hpb larvae, and adult worms were counted 28 dpi. (I–K) qPCR analysis of the indicated genes from SI organoids stimulated, on day 0 of culture, with ENR (control) or 10 ng/ml IFNγ with or without Hpb-CM for 24 h. (M) Monocle 3 direct exports of the trajectory analysis using CBCs as the pseudotime source variable, showing the distribution of the different cell clusters along the pseudotime variable. Scale bar, 100 μm. Data shown are representative of two or more independent experiments, n > 3 biological replicates; statistical tests: two-way ANOVA (B–L); *, P < 0.05; **, P < 0.01; ***, P < 0.005; ****, P < 0.001.
Figure 3.
Figure 3.
Hpb-CM expands revSCs and limits secretory cell differentiation. SI organoids were stimulated with Hpb-CM for 24 h from the plating of fresh crypts, and scRNA-seq analysis was performed. (A) UMAP projection plots; colors represent cells clustered together based on gene expression similarity. (B) Representative cluster identifying markers; circle size represents average expression of indicated transcripts (complete gene expression list can be found in Table S2). (C) The proportion of each cluster within each sample is presented. (D) Trajectory analysis using CBCs as the pseudotime source variable (pseudotime = 0). (E–G) Clu fate-mapping (Clu-CreERT; Rosa26-LSL-tdTomato; Ayyaz et al., 2019) mice were infected with Hpb, and Clu+ Tom+ cells were labeled by tamoxifen injection 5, 7, or 12 dpi and imaged 12 d after each injection; scale bar, 100 μm; image created with Biorender.com. (H and I) Immunofluorescent staining for DCLK (yellow), UEA1 (green), and DAPI (blue) as well as detection of Tom (red) in Clu fate-mapping mice on 24 dpi (mice were injected with tamoxifen on 12 dpi). Data shown are representative of one (A–D) or three or more (E–I) independent experiments, n = 3–5 biological replicates. Statistical tests: two-way ANOVA (G), t test (I); ***, P < 0.005.
Figure 4.
Figure 4.
An oxidative stress response drives Hpb-CM–induced fetal reversion of intestinal organoids. (A) Number of DEGs in each cell cluster identified by scRNA-seq analysis described in Fig. 3. (B) Pathway analysis based on DEGs was performed using Metascape (Zhou et al., 2019). (C–E) SI organoids were stimulated at the start of culture with ENR (control), Hpb-CM, or a 10-fold dilution of HES for 24 h. (C) Frequency of organoids with a spheroid morphology. (D and E) qPCR analysis of the indicated genes normalized to Hprt expression. (F–J) SI organoids were stimulated at the start of culture with ENR (control) or Hpb-CM. qPCR analysis is shown (G–J). SI organoids were stimulated with ENR (control) or Hpb-CM in the presence of increasing concentrations of NAC for 24 h. qPCR analysis of the indicated genes is shown. Scale bar, 50 μm; data shown are representative of one (A and B) or three or more (C–H) independent experiments, n = 3–5 biological replicates. Statistical tests: one-way ANOVA (C–E), t test (F), two-way ANOVA (H–J); *, P < 0.05; *, P < 0.01; ***, P < 0.005; ****, P < 0.001.
Figure 5.
Figure 5.
Counter-regulation of the ISC compartment by helminths and type 2 cytokine signaling. (A–D) SI organoids were stimulated at the start of culture with Hpb-CM ± IL-13, and qPCR analysis was performed for the indicated genes 48 h later. (E) Photomicrographs of organoids stimulated with Hpb-CM ± IL-13 for 48 h. (F and G) DCLK+ (F) and MUC2+ (G) cells were counted in 20 individual organoids from two mice. (H and I) SI organoids were stimulated with IL-13 for 10 d (over three passages) before Hpb-CM stimulation, and qPCR analysis for the indicated genes was performed 24 h after Hpb-CM stimulation. (J and K) C57BL/6 and Stat6−/− mice were infected with Hpb, and crypts were extracted 14 dpi and plated in Matrigel domes for 24 h. Representative photomicrographs (J) and quantification of ex vivo spheroid generation (K) are shown. (L and M) Clu expression by in situ hybridization of WT and Stat6−/− tissues 14 dpi. Representative photomicrographs (L) and quantification (M) of Clu+ tissue area. (N) Quantification of Clu+ intestinal tissue from Il4raWT and Il4raΔIEC mice 14 dpi. (O and P) Fecal Hpb egg counts from WT and Stat6−/− (O) and Il4raWT and Il4raΔIEC (P) mice 14 dpi. (Q) Quantification of Clu+ intestinal area from Clu fate-mapping mice injected with tamoxifen 12 dpi and PBS or IL-4C 10, 12, and 14 dpi. Tissues were harvested on day 24 after infection. Scale bar, 50 μm (E and J); 1 mm (L). All data shown are representative of two or more independent experiments, n > 3 biological replicates. Statistical tests: two-way ANOVA (A–K and O), t test (M, N, and Q); *, P < 0.05; **, P < 0.01; ***, P < 0.005.
Figure S3.
Figure S3.
A balanced regulation of the ISC niche by helminths and type 2 immune signaling supports durable infection. Related to Fig. 5. (A) Representative photomicrographs of Clu RNAscope of Il4raWT and Il4raΔIEC tissue sections on day 14 after Hpb infection. (B) Representative photomicrographs of dtTomato expression in Clu fate-mapping mice treated with PBS or IL4C as described in Fig. 5 Q and Materials and methods. (C) Hpb worm burden 28 dpi in WT and Stat6−/− mice. (D) Hpb egg burden following IL4C treatment. (E–J) Immune phenotyping on day 14 after Hpb infection. SI (E), PPs (F), and MLNs (G) were harvested from WT and Stat6−/− mice. Single-cell suspensions were made, and flow cytometry was performed. Cells were gated for viable CD45+CD3+B220CD4+CD62LCD44high cells, and Gata3+ cells were identified as Th2 cells. Percentage of Gata3+ cells of the CD62LCD44+ population. (H–J) SI (H), PPs (I), and MLN (J) were harvested from Il4raWT and Il4raΔIEC mice. Single-cell suspensions were made, and flow cytometry was performed. Cells were gated for viable CD45+CD3+B220CD4+CD62LCD44high cells, and Gata3+ cells were identified as Th2 cells. Percentage of Gata3+ cells of the CD62LCD44+ population. Scale bar, 500 μm. Data shown are representative of two or more independent experiments, n = 6 biological replicates; statistical tests: t test (C, D, and H–J); two-way ANOVA (E–G); *, P < 0.05; ***, P < 0.005.

Comment in

  • Helminths revive to survive.
    Grainger JR, Daw RH. Grainger JR, et al. J Exp Med. 2022 Sep 5;219(9):e20221183. doi: 10.1084/jem.20221183. Epub 2022 Aug 16. J Exp Med. 2022. PMID: 37559179 Free PMC article.

Similar articles

Cited by

References

    1. Anthony, R.M., Rutitzky L.I., Urban J.F., Stadecker M.J., and Gause W.C.. 2007. Protective immune mechanisms in helminth infection. Nat. Rev. Immunol. 7:975–987. 10.1038/nri2199 - DOI - PMC - PubMed
    1. Ayyaz, A., Kumar S., Sangiorgi B., Ghoshal B., Gosio J., Ouladan S., Fink M., Barutcu S., Trcka D., Shen J., et al. . 2019. Single-cell transcriptomes of the regenerating intestine reveal a revival stem cell. Nature. 569:121–125. 10.1038/s41586-019-1154-y - DOI - PubMed
    1. Babicki, S., Arndt D., Marcu A., Liang Y., Grant J.R., Maciejewski A., and Wishart D.S.. 2016. Heatmapper: Web-enabled heat mapping for all. Nucleic Acids Res. 44:W147–W153. 10.1093/nar/gkw419 - DOI - PMC - PubMed
    1. Bankhead, P., Loughrey M.B., Fernández J.A., Dombrowski Y., McArt D.G., Dunne P.D., McQuaid S., Gray R.T., Murray L.J., Coleman H.G., et al. . 2017. QuPath: Open source software for digital pathology image analysis. Sci. Rep. 7:16878. 10.1038/s41598-017-17204-5 - DOI - PMC - PubMed
    1. Barner, M., Mohrs M., Brombacher F., and Kopf M.. 1998. Differences between IL-4Rα-deficient and IL-4-deficient mice reveal a role for IL-13 in the regulation of Th2 responses. Curr. Biol. 8:669–672. 10.1016/s0960-9822(98)70256-8 - DOI - PubMed

Publication types