. 2023;99(4):644-655.
doi: 10.1080/09553002.2022.2110319. Epub 2022 Aug 15.

Cytogenetic and epigenetic aberrations in peripheral lymphocytes of northwest Arkansas Marshallese

Affiliations

Cytogenetic and epigenetic aberrations in peripheral lymphocytes of northwest Arkansas Marshallese

Laura E Ewing et al. Int J Radiat Biol. 2023.

Abstract

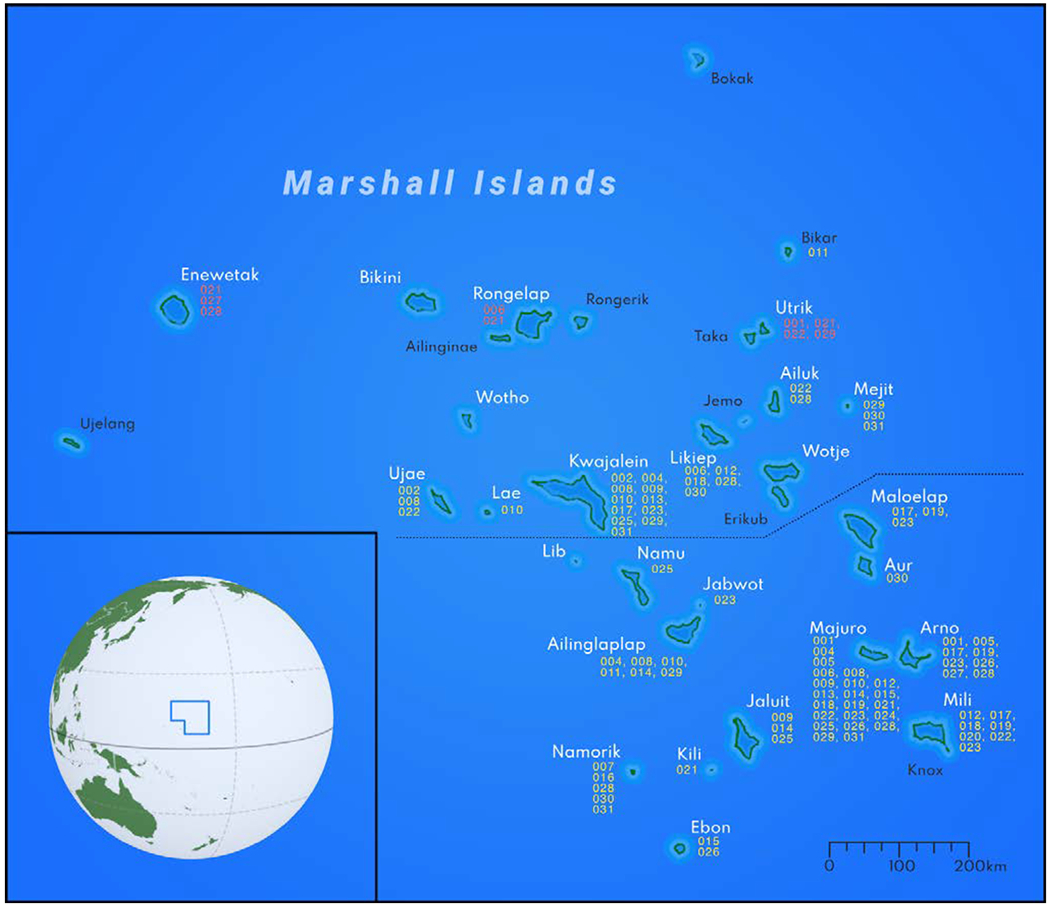
Purpose: Nuclear weapons testing in the northern Marshall Islands between 1946 and 1958 resulted in ionizing radiation (IR) exposure of the thousands of Marshallese. Furthermore, numerous islands were contaminated by radioactive fallout. Significant increases in cancer and metabolic syndrome incidences have been reported among Marshallese, and potential for further increases looms due to the latency of radiation-induced health effects. The purpose of this study was to investigate the genetic and epigenetic effects of exposure to IR that could be associated with radiation-induced disease among the Northwest Arkansas (NWA) Marshallese.

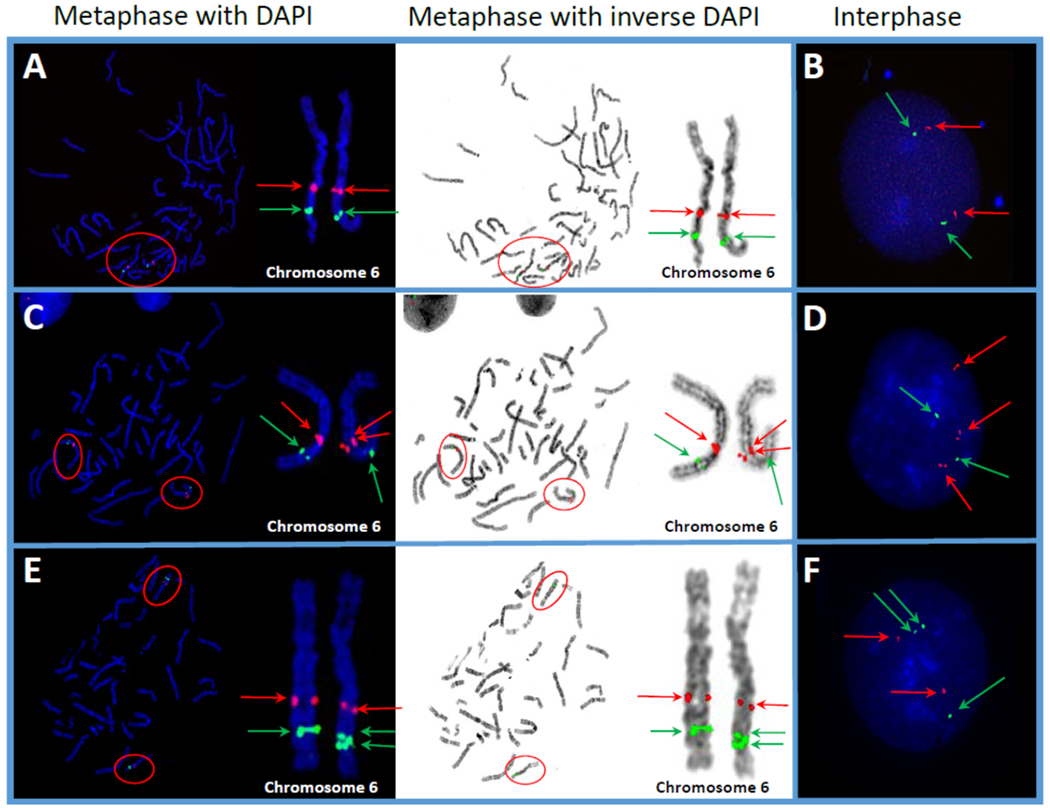
Materials and methods: We performed analysis of chromosomal aberrations and DNA methylation based on residential and exposure history of NWA Marshallese.

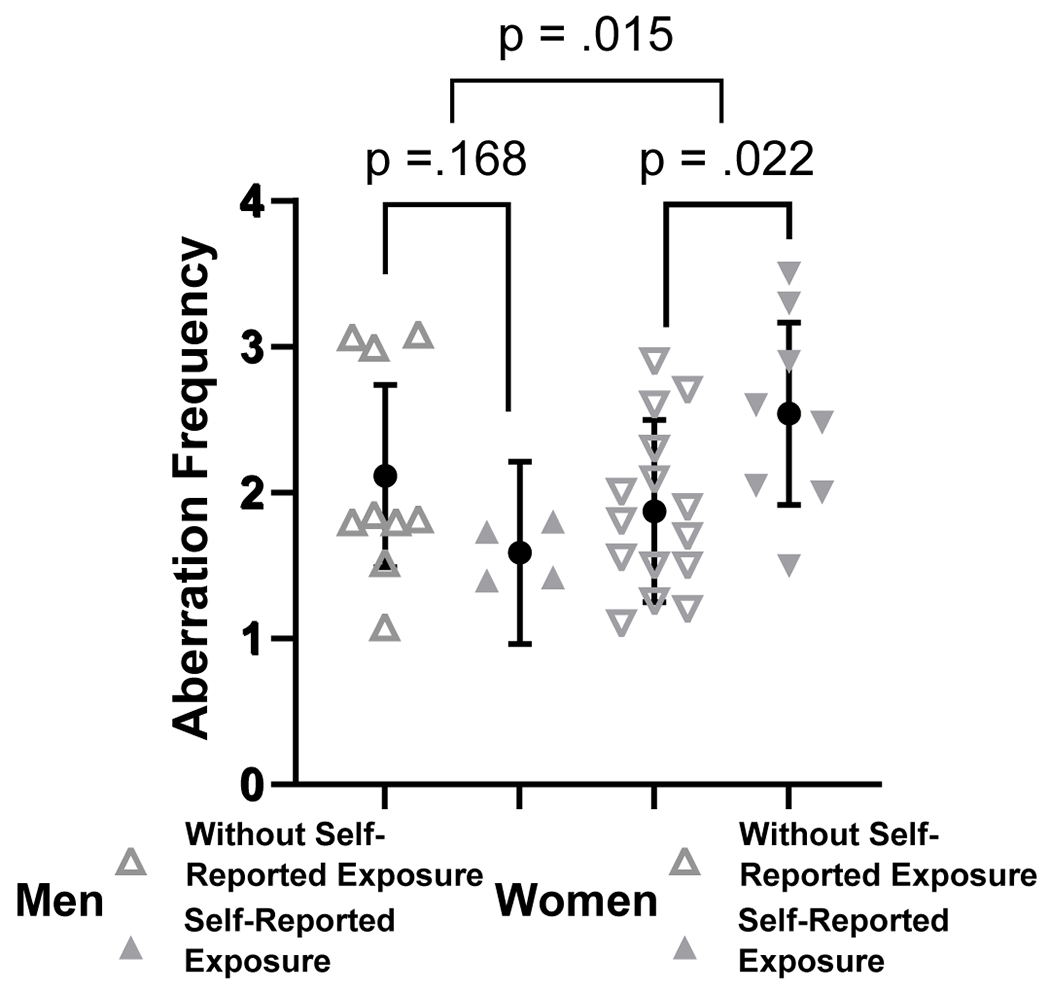
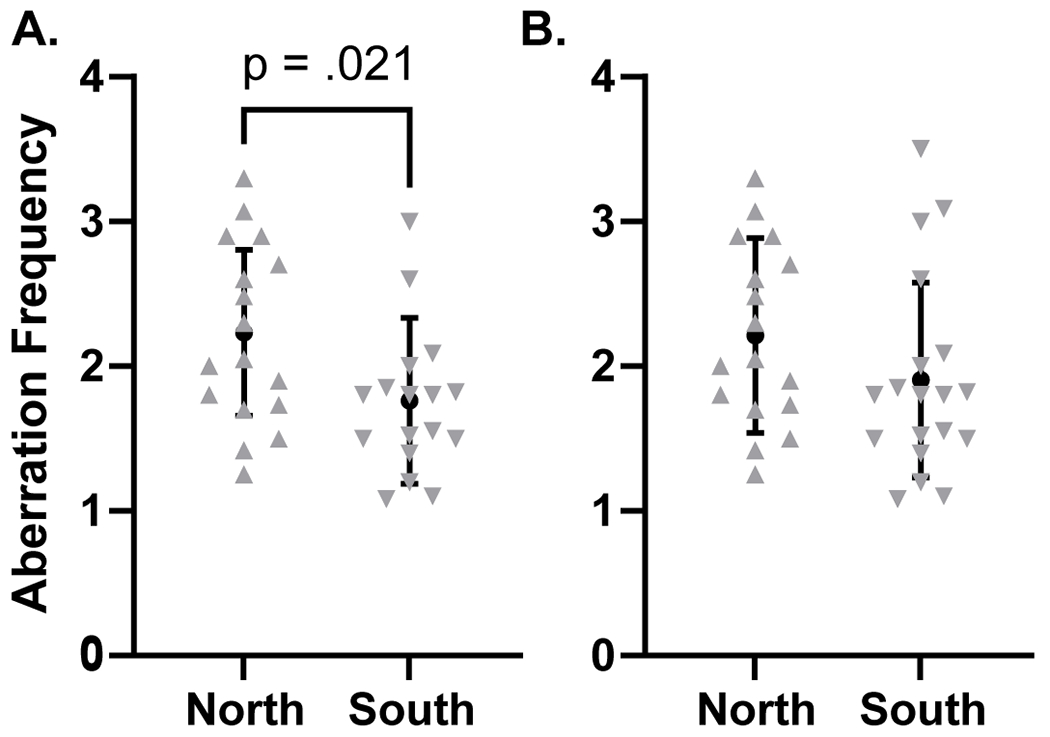
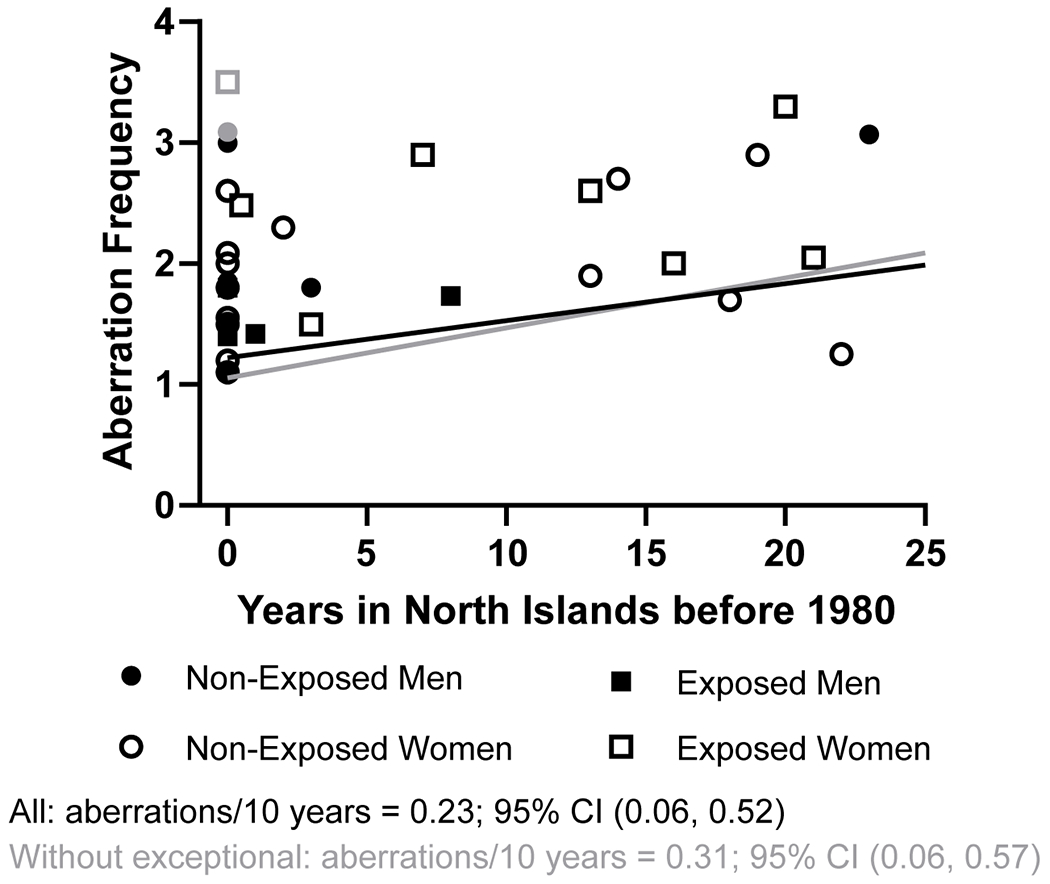
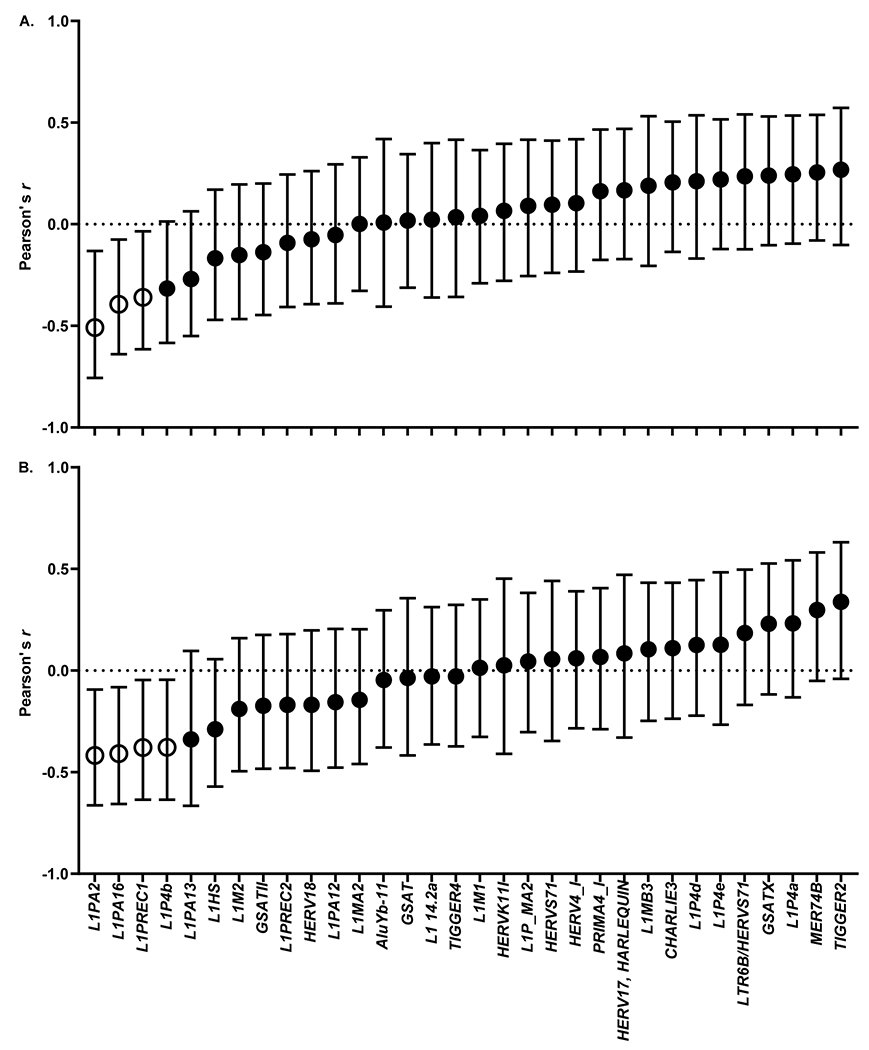
Results: Analysis of chromosomal aberrations demonstrated higher incidence of genetic rearrangements in women with self-reported history of radiation exposure (95% CI: 0.10, 1.22; p=.022). Further clustering of study participants based on their residential history demonstrated that participants who spent substantial amounts of time (≥6 months) in the northern atolls (thus, in the proximity of nuclear tests) before 1980 had more chromosomal aberrations than their peers who lived only in the southern atolls (95% CI: 0.08, -0.95; p=.021), and that this difference was driven by women. A relationship between the time spent in the northern atolls and increase in chromosomal aberrations was observed: 0.31 increase in chromosomal aberrations for every 10 years spent at northern atolls (95% CI: 0.06, 0.57; p=.020). Finally, significant inverse correlations between the chromosomal aberrations and the extent of DNA methylation of four LINE-1 elements L1PA2, L1PA16, L1PREC1, and L1P4B were identified.

Conclusions: The results of this study provide first evidence of the presence of stable genetic and epigenetic rearrangements in peripheral lymphocytes of NWA Marshallese and warrant further studies to analyze the role of radiation exposure in health disparities experienced by this Pacific Island nation.

Keywords: Chromosomal aberrations; DNA methylation; LINE-1; Marshallese; health disparities; ionizing radiation.


Conflict of interest statement

Disclosure statement

The authors declare that they have no known competing financial interests or personal relationship that could have appeared to influence the work reported in this paper.

Figures

Figure 1.
Figure 1.
Photomicrographs representing normal and various anomalies in the long arm (q) of chromosome 6 in Marshallese study participants. A cocktail of FISH probes for two different loci,6q21 (encompassing SEC63 gene, red signals) and 6q23 (encompassing MYB gene, green signals) was used to identify cytogenetic abnormalities involving these two loci on chromosome 6. Red arrows indicate the SEC63 gene and green arrows indicate the MYB gene. Red ovals indicate human chromosome 6, featured in magnified view. (A) Metaphase spread with both DAPI and inverse DAPI, showing 2 positive hybridizations of both loci, illustrating an apparently normal signal pattern. (B) Interphase nucleus showing 2 positive hybridizations for both loci, indicating an apparently normal signal pattern. (C) Metaphase spread with both DAPI and inverse DAPI, showing positive hybridization for 3 red signals and 2 green signals, illustrating a duplication of the SEC63 gene locus. (D) Interphase nucleus also showing positive hybridization for 3 red signals and only 2 green signals, indicating a duplication of the SEC63 gene locus. (E) Metaphase spread with both DAPI and inverse DAPI showing positive hybridization for 2 red signals and 3 green signals, indicating a duplication of the MYB gene locus. (F) Interphase nucleus also showing positive hybridization for 2 red signals and 3 green signals, indicating a duplication of the MYB gene locus.
Figure 2.
Figure 2.
Analysis of chromosomal aberrations in peripheral lymphocytes of NWA Marshallese (“self-reported radiation exposure” vs “without self-reported radiation exposure”). Chromosomal aberration frequency was analyzed with a two-way ANOVA. Brackets above the data indicate which groups are being compared. Data are represented as mean ± pooled SD.
Figure 3.
Figure 3.
Map of Marshall Islands and residential history of the study participants.
Figure 4.
Figure 4.
Analysis of chromosomal aberrations in peripheral lymphocytes of NWA Marshallese (“north” vs “south” scenario). Chromosomal aberration frequency was analyzed with a t-test. A compares aberration frequency between those living on the North Atoll and those living on the South Atoll, while excluding two exceptional individuals (see text for explanation). B shows the same comparison without removing the two individuals from the analysis. Data are represented as mean ± pooled SD.
Figure 5.
Figure 5.
Estimation of aberration frequency per 10 years spent on the northern atolls. Symbols in gray indicate two exceptional individuals (see text for more information), and the regression line in gray is the result of excluding those from the analysis. The regression line in black includes all individuals.
Figure 6.
Figure 6.
Correlation of LINE-1 DNA methylation status with chromosomal aberration frequency. (A) All individuals. (B) Excluding two exceptional individuals. Data are presented as Pearson’s r-value ± 95% CI. Open symbols indicate a confidence interval that does not include zero.

Similar articles

Cited by

References

    1. Abella MKIL, Molina MR, Nikolić-Hughes I, Hughes EW, Ruderman MA. 2019. Background gamma radiation and soil activity measurements in the northern Marshall Islands. Proc Natl Acad Sci USA. 116(31):15425–15434. - PMC - PubMed
    1. Aypar U, Morgan WF, Baulch JE. 2011. Radiation-induced epigenetic alterations after low and high LET irradiations. Mutat Res. 707(1-2):24–33. - PubMed
    1. Baulch JE, Aypar U, Waters KM, Yang AJ, Morgan WF. 2014. Genetic and epigenetic changes in chromosomally stable and unstable progeny of irradiated cells. PLoS One. 9(9):e107722. - PMC - PubMed
    1. Binz RL, Tian E, Sadhukhan R, Zhou D, Hauer-Jensen M, Pathak R. 2019. Identification of novel breakpoints for locus- and region-specific translocations in 293 cells by molecular cytogenetics before and after irradiation. Sci Rep. 9(1):10554. - PMC - PubMed
    1. Bordner AS, Crosswell DA, Katz AO, Shah JT, Zhang CR, Nikolic-Hughes I, Hughes EW, Ruderman MA. 2016. Measurement of background gamma radiation in the northern Marshall Islands. Proc Natl Acad Sci USA. 113(25):6833–6838. - PMC - PubMed

Publication types