. 2022 Aug 8;17(8):e0266905.
doi: 10.1371/journal.pone.0266905. eCollection 2022.

Nitrite lowers the oxygen cost of ATP supply in cultured skeletal muscle cells by stimulating the rate of glycolytic ATP synthesis

Affiliations

Nitrite lowers the oxygen cost of ATP supply in cultured skeletal muscle cells by stimulating the rate of glycolytic ATP synthesis

Anthony G Wynne et al. PLoS One. .

Abstract

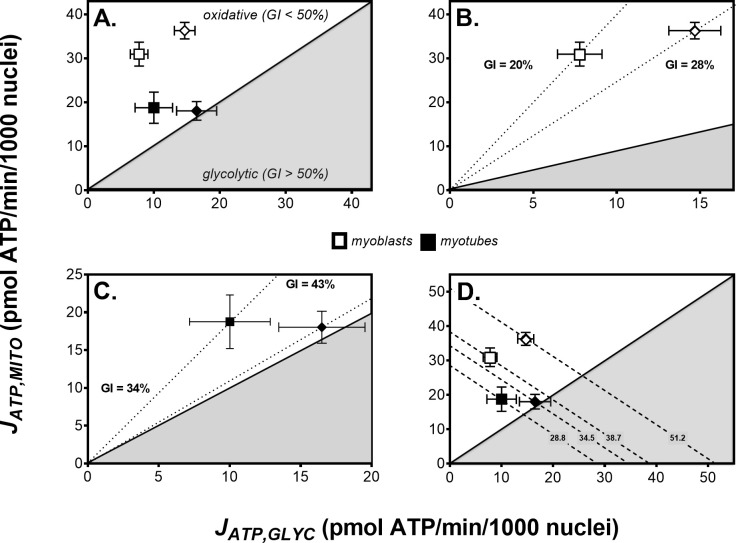
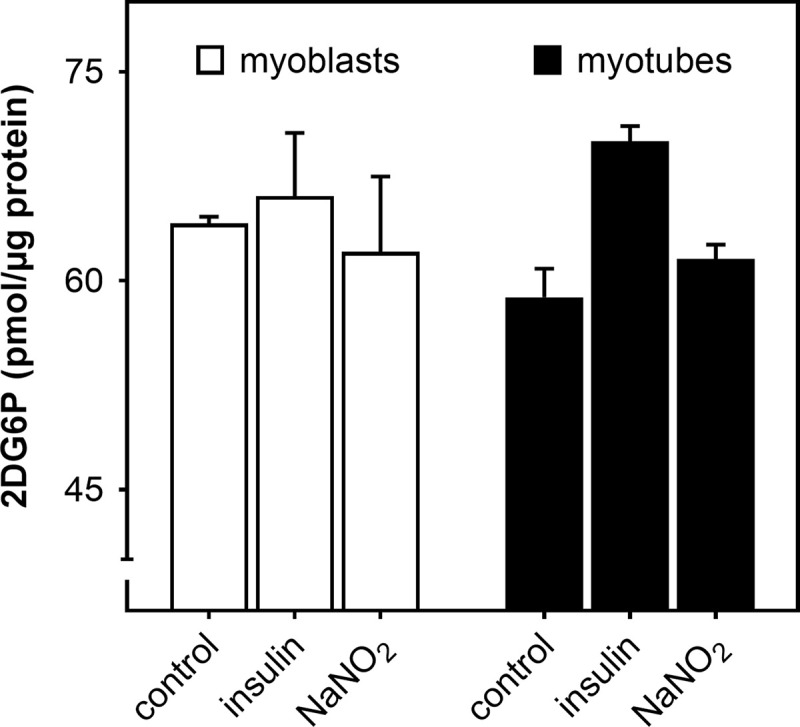
Dietary nitrate lowers the oxygen cost of human exercise. This effect has been suggested to result from stimulation of coupling efficiency of skeletal muscle oxidative phosphorylation by reduced nitrate derivatives. In this paper, we report the acute effects of sodium nitrite on the bioenergetic behaviour of cultured rat (L6) myocytes. At odds with improved efficiency of mitochondrial ATP synthesis, extracellular flux analysis reveals that a ½-hour exposure to NaNO2 (0.1-5 μM) does not affect mitochondrial coupling efficiency in static myoblasts or in spontaneously contracting myotubes. Unexpectedly, NaNO2 stimulates the rate of glycolytic ATP production in both myoblasts and myotubes. Increased ATP supply through glycolysis does not emerge at the expense of oxidative phosphorylation, which means that NaNO2 acutely increases the rate of overall myocellular ATP synthesis, significantly so in myoblasts and tending towards significance in contractile myotubes. Notably, NaNO2 exposure shifts myocytes to a more glycolytic bioenergetic phenotype. Mitochondrial oxygen consumption does not decrease after NaNO2 exposure, and non-mitochondrial respiration tends to drop. When total ATP synthesis rates are expressed in relation to total cellular oxygen consumption rates, it thus transpires that NaNO2 lowers the oxygen cost of ATP supply in cultured L6 myocytes.


Conflict of interest statement

The authors have declared that no competing interests exist.

Figures

Fig 1
Fig 1. Myocellular respiration and proton release.
Oxygen uptake and medium acidification by static L6 myoblasts (open symbols) and spontaneously contracting myotubes (filled symbols) were measured by extracellular flux (XF) analysis. Panels A and B: Respiratory and medium acidification traces, respectively, are based on the means ± SEM of 4 individual extracellular flux runs with the differentiation states measured 3–5 times in each. Medium acidification traces were corrected for CO2 contribution and thus reflect the proton production rate due to release of lactateand H+ (PPRLAC) alone. Rates were normalised to the 3rd measurement and were obtained in the absence of any respiratory effector or in the cumulative presence of 5 μg/mL oligomycin (OLI), 1 μM uncoupler (BAM15), and a mixture of 1 μM rotenone and 1 μM antimycin A (R/A). Panel C: After normalisation to the number of myocyte nuclei, respiratory and proton production rates were used to calculate the basal oxygen consumption and medium acidification rates as well as the oxygen uptake activity that was coupled to ATP synthesis (coupled) or associated with mitochondrial proton leak. The maximum mitochondrial respiratory rate (uncoupled) and the rate of non-mitochondrial oxygen consumption (non-mito) are shown too, as is the PPRLAC measured after addition of all effectors (final). Data are means ± SEM of 13–14 well measurements sampled from 4 independent XF assays. Extracellular flux differences between myoblasts and myotubes were evaluated for statistical significance by 2-way ANOVA applying a Šídák’s multiple comparisons test (*** P < 0.001). Panels D and E: Coupling efficiencies and cell respiratory control ratios, respectively, were calculated from the data shown in Panel C and the control (0 μM NaNO2) data shown in Fig 4. Box-and-whiskers plots represent 25–34 measurements sampled from 8–9 independent XF assays. Statistical significance of the differences between myoblasts and myotubes (**** P < 0.0001) was evaluated by Mann Whitney tests.
Fig 2
Fig 2. Myocellular ATP supply.
Rates of glycolytic and mitochondrial ATP synthesis were calculated from data shown in Fig 1C and were normalised to number of myocyte nuclei (absolute rates) or expressed as percentage of the combined, i.e., total ATP supply (proportions). Myoblast (open bars) and myotube (filled bars) data are means ± SEM of 13–14 well measurements sampled from 4 separate XF assays. Bioenergetic differences between myoblasts and myotubes were evaluated for statistical significance by 2-way ANOVA applying a Šídák’s multiple comparisons test (* P < 0.05).
Fig 3
Fig 3. Nitrite effects on myocellular respiration.
Mitochondrial and non-mitochondrial oxygen uptake rates were measured in static myoblasts and spontaneously contracting myotubes after a ½-hour exposure to NaNO2 as described in Materials and Methods. Respiratory activities were normalised to number of myocyte nuclei and were obtained in the absence of effectors (Basal) or in the cumulative presence of 5 μg/mL oligomycin (Leak), 1 μM FCCP (Uncoupled) and a mix of 1 μM rotenone and 1 μM antimycin A (Non-mitochondrial). Oligomycin-sensitive oxygen uptake was used to estimate respiration coupled to ATP synthesis (Coupled). Data are means ± SEM of 12–20 well measurements sampled from 4–5 independent XF assays. NaNO2 effects were evaluated for statistical significance by combined Kruskal-Wallis and Dunn’s tests. Respiratory rates labelled with an asterisk differ significantly (P < 0.05) from the relevant (0 μM NaNO2) control rate.
Fig 4
Fig 4. Nitrite lowers mitochondrial efficiency.
Respiratory rates shown in Fig 3 were used to calculate coupling efficiency of oxidative phosphorylation (Panels A and C) and cell respiratory control ratios (Panels B and D) in static myoblasts and spontaneously contracting myotubes. Data are means ± SEM of 12–20 well measurements sampled from 4–5 independent XF assays. NaNO2 effects were evaluated for statistical significance by combined Kruskal-Wallis and Dunn’s tests. Parameters labelled with asterisks differ significantly (* P < 0.05 and ** P < 0.01) from the relevant (0 μM NaNO2) control rate.
Fig 5
Fig 5. Nitrite effects on ATP supply.
Respiratory rates shown in Fig 3 were used, combined with concomitantly measured acidification rates (cf. Fig 1B and 1C), to calculate rates of mitochondrial (Panels A and B), glycolytic (Panels C and D) and total (Panels E and F) ATP supply (JATP,MITO, JATP,GLYC and JATP,TOT, respectively) in static myoblasts and spontaneously contracting myotubes. Glycolytic ATP synthesis rates are also shown as percentages of total ATP supply rate (JATP,GLYC/TOT, Panels G and H), i.e., as myocellular glycolytic indices (GI). Furthermore, total ATP synthesis rates are normalised to the total cellular oxygen consumption rate (JATP,TOT/OCR, Panels I and J). Data are means ± SEM of 12–21 well measurements sampled from 4–5 independent XF assays. NaNO2 effects were evaluated for statistical significance by combined Kruskal-Wallis and Dunn’s tests. Parameters labelled with asterisks differ significantly (* P < 0.05, ** P < 0.01, *** P < 0.001) from the relevant (0 μM NaNO2) control rate.
Fig 6
Fig 6. Nitrate effects on ATP supply.
Rates of mitochondrial, glycolytic and total ATP supply (JATP,MITO, JATP,GLYC and JATP,TOT, respectively) in static myoblasts and spontaneously contracting myotubes were calculated from oxygen uptake and medium acidification data obtained after a ½-hour exposure to NaNO3. Data are means ± SEM of 13–18 well measurements sampled from 4 independent XF assays. NaNO3 effects were evaluated for statistical significance by combined Kruskal-Wallis and Dunn’s tests and were found non-significant.
Fig 7
Fig 7. Nitrite increases the dependence of skeletal muscle cells on glycolytic ATP supply.
Bioenergetic space plots [21] relate the rate of mitochondrial ATP supply (JATP,MITO) to the rate of glycolytic ATP supply (JATP,GLYC). Individual data obtained from experiments with static myoblasts and spontaneously contracting myotubes, in the absence (squares) or the presence (diamonds) of NaNO2 (0.75 and 5 μM for myoblasts and myotubes, respectively), were sourced from Fig 5. Data are means ± SEM of 12–19 well measurements sampled from 4–5 independent XF assays. Diagonal lines with positive slopes reflect the glycolytic index (GI), i.e., the percentage of total ATP synthesis from glycolysis. The white area above the GI50% diagonal covers ‘oxidative’ bioenergetic space, whereas the grey shaded area below this diagonal covers the ‘glycolytic’ space. GI values indicated by the dotted lines in Panels B and C were calculated from the shown mean rates of oxidative and glycolytic ATP supply. The dashed diagonal lines with a slope of –1 in Panel D indicate space with the same total rate of ATP supply. The numbers labelling these lines are mean supply rates in pmol ATP/min/1000 nuclei.
Fig 8
Fig 8. Nitrite does not affect glucose uptake by skeletal muscle cells.
Static myoblasts (open bars) and spontaneously contracting myotubes (filled bars) were grown and assayed under the same conditions as those applied during extracellular flux analysis, and were exposed to 1 μM NaNO2 for 30 min with and without 100 nM human insulin. Glucose uptake was assayed as 2-deoxyglucose-6-phosphate (2DG6P) accumulated over a 30-min period. Data are means ± SEM of 3 independent experiments with each condition assayed in triplicate. Differences between differentiation state and assay conditions were evaluated by 2-way ANOVA and were found not significant.

Similar articles

Cited by

References

    1. Mills CE, Khatri J, Maskell P, Odongerel C, Webb AJ. It is rocket science—why dietary nitrate is hard to Beet! part II: further mechanisms and therapeutic potential of the nitrate-nitrite-NO pathway. Br J Clin Pharmacol. 2017;83: 140–151. doi: 10.1111/bcp.12918 - DOI - PMC - PubMed
    1. Jackson JK, Patterson AJ, MacDonald-Wicks LK, Oldmeadow C, McEvoy MA. The role of inorganic nitrate and nitrite in cardiovascular disease risk factors: a systematic review and meta-analysis of human evidence. Nutr Rev. 2018;76: 348–371. doi: 10.1093/nutrit/nuy005 - DOI - PubMed
    1. Lundberg JO, Carlström M, Weitzberg E. Metabolic effects of dietary nitrate in health and disease. Cell Metab. 2018;28: 9–22. doi: 10.1016/j.cmet.2018.06.007 - DOI - PubMed
    1. Duncan C, Dougall H, Johnston P, Green S, Brogan R, Leifert C, et al.. Chemical generation of nitric oxide in the mouth from the enterosalivary circulation of dietary nitrate. Nat Med. 1995;1: 546–551. doi: 10.1038/nm0695-546 - DOI - PubMed
    1. Webb AJ, Patel N, Loukogeorgakis S, Okorie M, Aboud Z, Misra S, et al.. Acute blood pressure lowering, vasoprotective, and antiplatelet properties of dietary nitrate via bioconversion to nitrite. Hypertension. 2008;51: 784–790. doi: 10.1161/HYPERTENSIONAHA.107.103523 - DOI - PMC - PubMed

Publication types