. 2022 Aug 16;119(33):e2121654119.
doi: 10.1073/pnas.2121654119. Epub 2022 Aug 8.

Climate drives coupled regime shifts across subtropical estuarine ecosystems

Affiliations

Climate drives coupled regime shifts across subtropical estuarine ecosystems

Stephen G Hesterberg et al. Proc Natl Acad Sci U S A. .

Erratum in

Abstract

Ecological regime shifts are expected to increase this century as climate change propagates cascading effects across ecosystems with coupled elements. Here, we demonstrate that the climate-driven salt marsh-to-mangrove transition does not occur in isolation but is linked to lesser-known oyster reef-to-mangrove regime shifts through the provision of mangrove propagules. Using aerial imagery spanning 82 y, we found that 83% of oyster reefs without any initial mangrove cover fully converted to mangrove islands and that mean (± SD) time to conversion was 29.1 ± 9.6 y. In situ assessments of mangrove islands suggest substantial changes in ecosystem structure during conversion, while radiocarbon dates of underlying reef formation indicate that such transitions are abrupt relative to centuries-old reefs. Rapid transition occurred following release from freezes below the red mangrove (Rhizophora mangle) physiological tolerance limit (-7.3 °C) and after adjacent marsh-to-mangrove conversion. Additional nonclimate-mediated drivers of ecosystem change were also identified, including oyster reef exposure to wind-driven waves. Coupling of regime shifts arises from the growing supply of mangrove propagules from preceding and adjacent marsh-to-mangrove conversion. Climate projections near the mangrove range limit on the Gulf coast of Florida suggest that regime shifts will begin to transform subtropical estuaries by 2070 if propagule supply keeps pace with predicted warming. Although it will become increasingly difficult to maintain extant oyster habitat with tropicalization, restoring oyster reefs in high-exposure settings or active removal of mangrove seedlings could slow the coupled impacts of climate change shown here.

Keywords: Crassostrea virginica; climate change; historical ecology; mangrove; oyster reef.


Conflict of interest statement

The authors declare no competing interest.

Figures

Fig. 1.
Fig. 1.
Oyster reef–to–mangrove regime shifts from 1938 to 2020 in Tampa Bay, FL. (A) Map showing the location of three study areas within Tampa Bay: Cockroach Bay (CB), Kitchen Bayou (KB), and Weedon Island (WI), displaying dynamics of oyster reef–to–mangrove regime shifts. Climate records used in this study were obtained from local weather stations across Tampa Bay, and are indicated in A with points. Insert shows location of Tampa Bay in relation to Cedar Key, FL, the putative poleward range limit for Rhizophora mangle along Florida’s west coast in 2020. (B) Example of aerial imagery used to track the fate of 111 oyster reefs over 82 y and quantify mangrove establishment, expansion, and conversion at subdecadal intervals (SI Appendix, Table S1). (C) Oyster reef with a recently established red mangrove (R. mangle) propagule. For a mangrove island to form, propagules must disperse from outside the oyster reef system and successfully establish within the interstices formed by oyster shells. NWS, National Weather Service; SPG, Albert Whitted Airport (St. Petersburg); TPA, Tampa International Airport. Image credit: S. G. Hesterberg, University of South Florida.
Fig. 2.
Fig. 2.
Dynamics of oyster reef–to–mangrove transition spanning 82 y in Tampa Bay, FL, USA. (A) Over 80% of tracked oyster reefs fully converted (≥ 90% mangrove cover) to mangrove islands by 2020 (n = 111). (B) Physical exposure expressed as REI best predicted time to mangrove establishment across the three sites (SI Appendix, Table S2) and (C) conversion time of oyster reef–to–mangrove islands decreased over 82 y as time to establishment increased (SI Appendix, Table S3). CB, Cockroach Bay; KB, Kitchen Bayou; WI, Weedon Island.
Fig. 3.
Fig. 3.
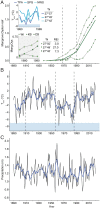
Relationship between mangrove expansion on oyster reefs and climate. (A) Proportional change in mangrove cover relative to initial oyster reef area across three sites: Cockroach Bay (CB), Kitchen Bayou (KB), and Weedon Island (WI). Solid dark green line represents best-fit segmented regression for mangrove expansion across all sites. Insets show Tmin at three weather stations (see Fig. 1A) and changes in proportional mangrove cover by site before and after the 1983 freeze. Latitudes (°N) of stations and sites are listed, along with mean oyster reef REI at each site. (B) Annual minimum temperature (Tmin) and (C) annual precipitation in Tampa, FL, since 1890. Solid blue lines show 5-y moving averages. Light blue areas in (B) indicate freezing temperatures below -7.3 °C which is considered lethal to mangroves. Dashed vertical lines in A and B show estimated structural changes in timeseries; no structural changes were identified in C. Mang, mangrove; NWS, National Weather Service; Oys, oyster; SPG, Albert Whitted Airport (St. Petersburg); TPA, Tampa International Airport.
Fig. 4.
Fig. 4.
Sediment cores showing (A) a fully transitioned mangrove island, (B) an oyster reef undergoing transition, and (C) an extant oyster reef. Stratigraphy was described through visual inspection and sediment properties, including percent total organic matter (% TOM), % CaCO3, and grain-size analyses. Dotted line shows mean grain size (φ). White dots show locations of accelerator mass spectrometry radiocarbon dating of macrobotanical or charcoal elements. Dates represent median age probabilities. See SI Appendix, Fig. S2 for additional cores and radiocarbon dates from converted mangrove islands.
Fig. 5.
Fig. 5.
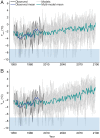
Tmin data through 2099 at Cedar Key, FL, under two radiative forcing scenarios: (A) RCP4.5 and (B) RCP8.5. Black lines are historical observations and the dark blue line represents 5-y moving average for historical data. Light gray lines are individual CMIP5 model realizations; the multimodel mean is in teal. Light blue areas on temperature graphs indicate freezes below −7.3 °C.

References

    1. Scheffer M., Carpenter S. R., Catastrophic regime shifts in ecosystems: Linking theory to observation. Trends Ecol. Evol. 18, 648–656 (2003).
    1. Biggs R., Peterson G., Rocha J., The Regime Shifts Database: A framework for analyzing regime shifts in social-ecological systems. Ecol. Soc. 23, art9 (2018).
    1. Barnosky A. D., et al. , Approaching a state shift in Earth’s biosphere. Nature 486, 52–58 (2012). - PubMed
    1. van Nes E. H., et al. , What do you mean, ‘tipping point’? Trends Ecol. Evol. 31, 902–904 (2016). - PubMed
    1. Graham N. A. J., et al. , Managing resilience to reverse phase shifts in coral reefs. Front. Ecol. Environ. 11, 541–548 (2013).

Publication types