. 2022 Aug 16;119(33):e2201247119.
doi: 10.1073/pnas.2201247119. Epub 2022 Aug 8.

A nuclear redox sensor modulates gene activation and var switching in Plasmodium falciparum

Affiliations

A nuclear redox sensor modulates gene activation and var switching in Plasmodium falciparum

Adina Heinberg et al. Proc Natl Acad Sci U S A. .

Abstract

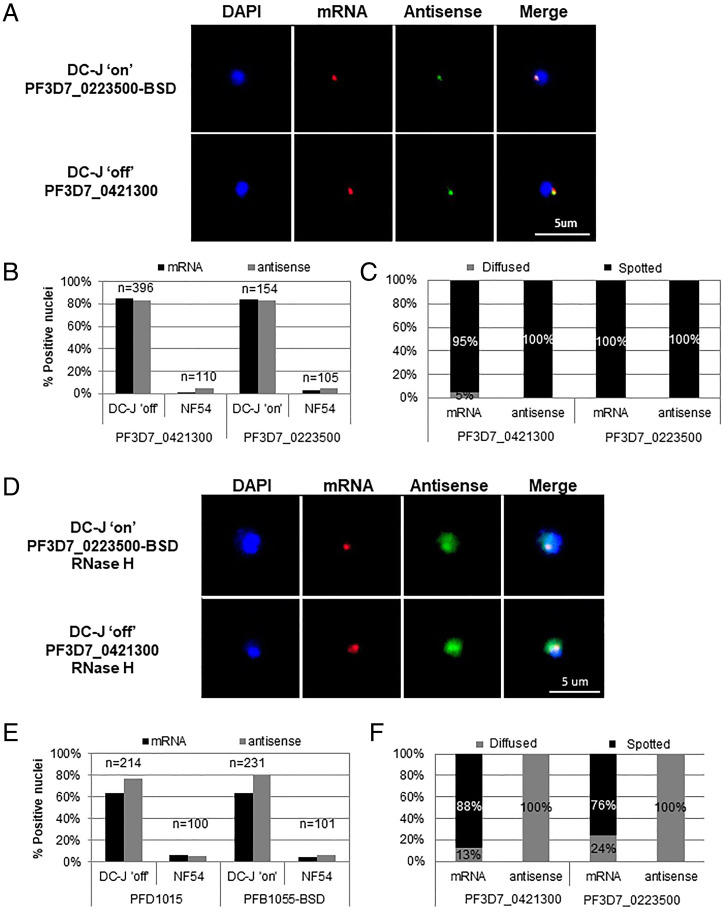
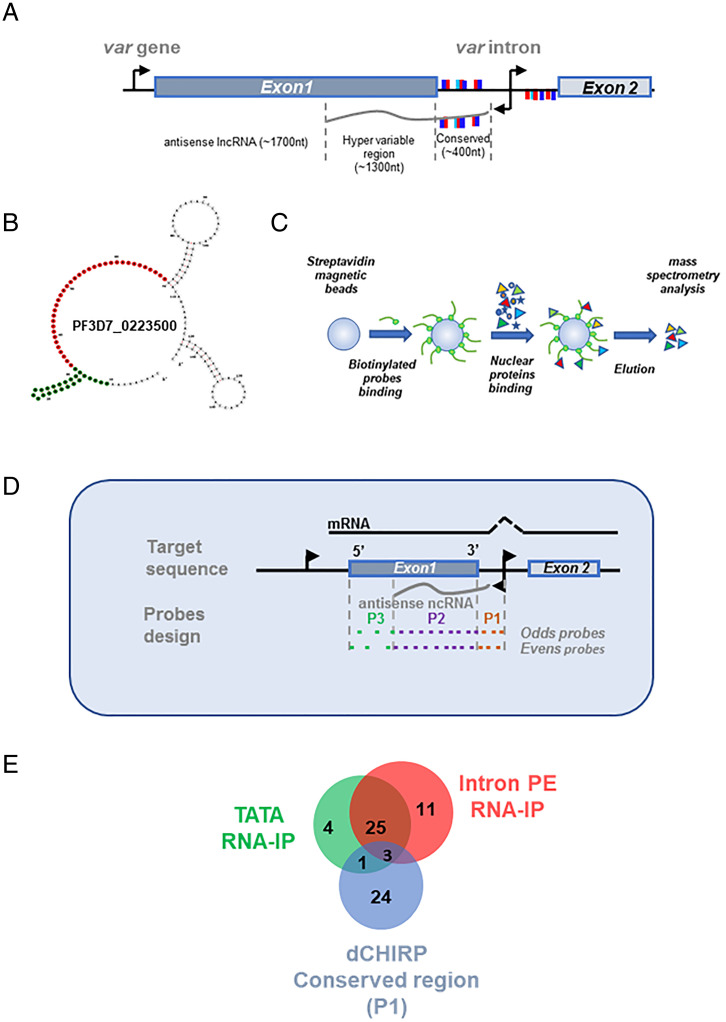
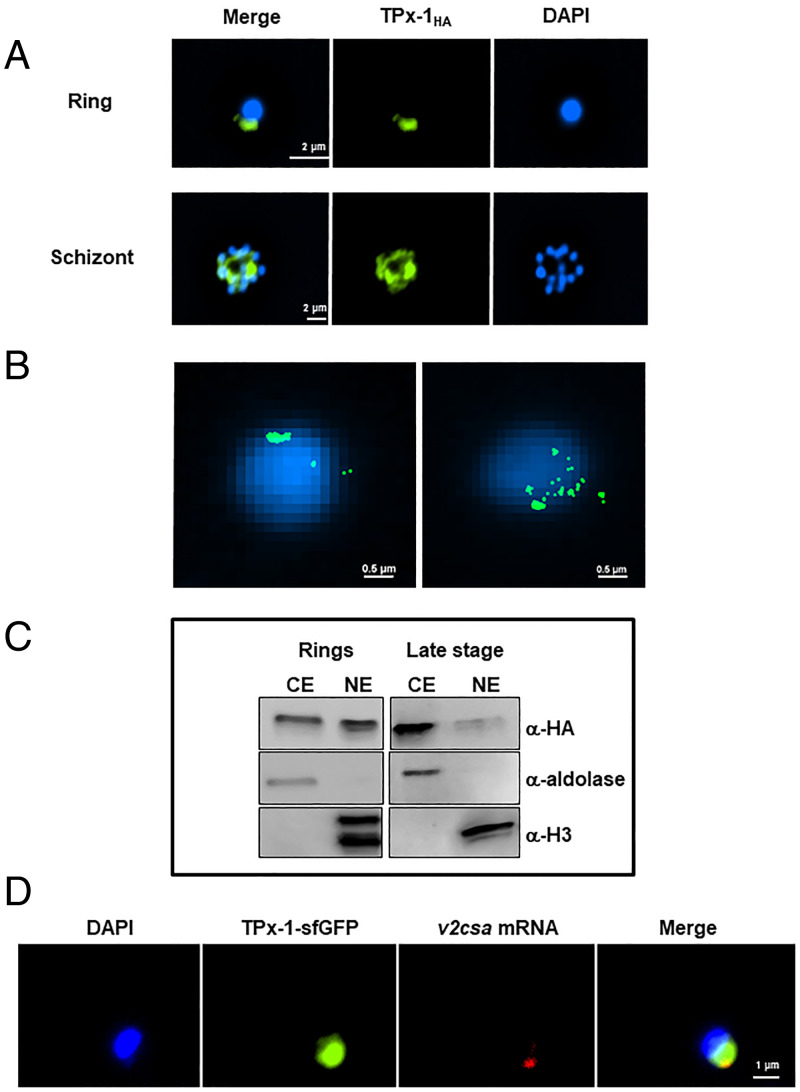
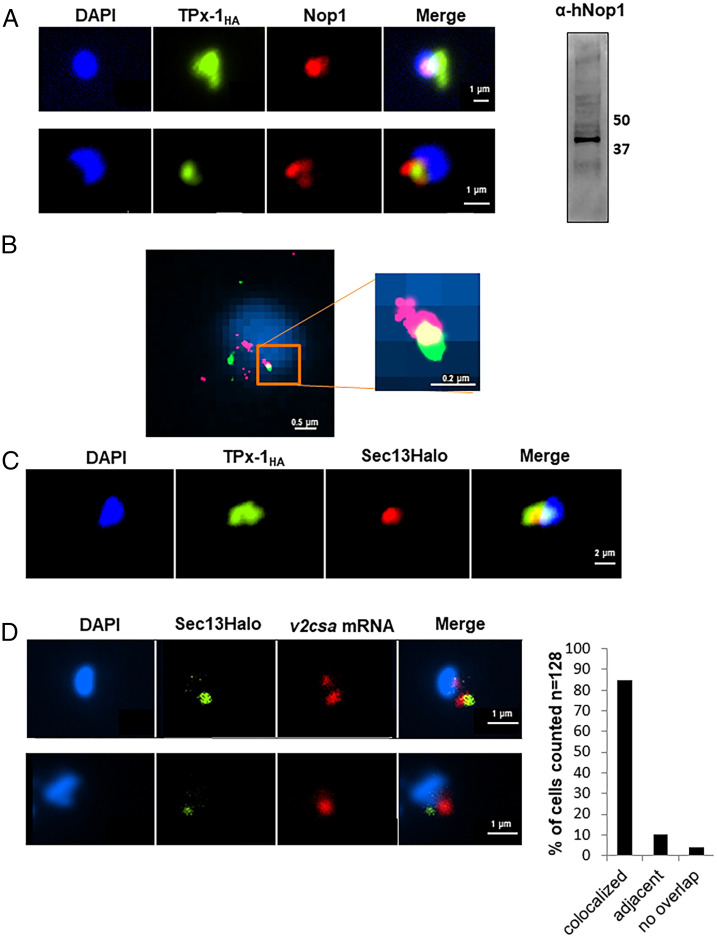
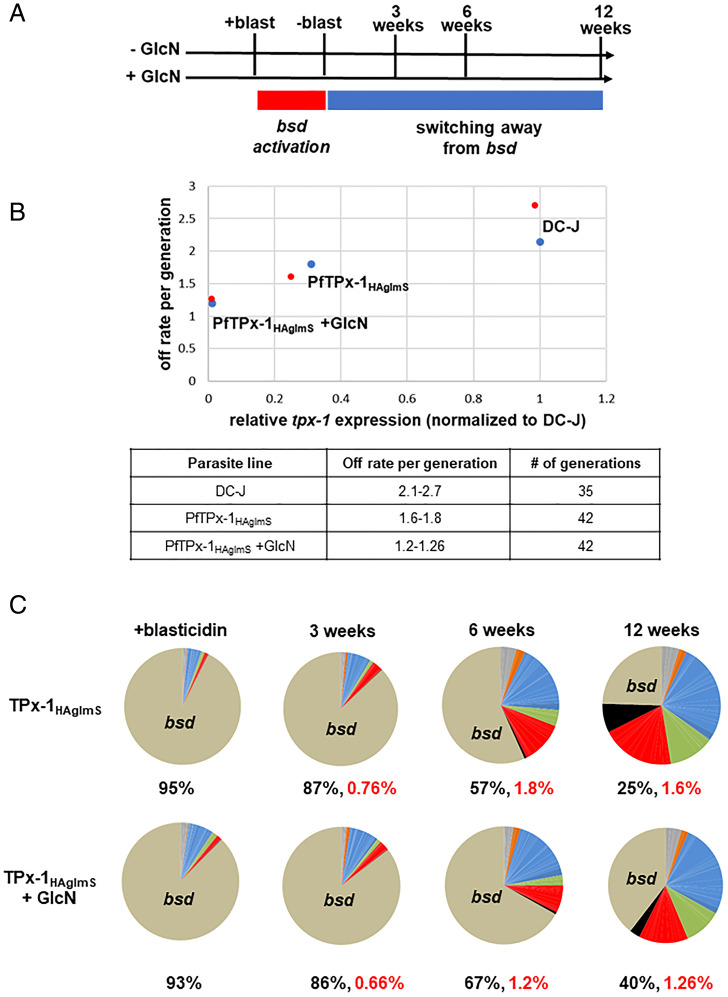
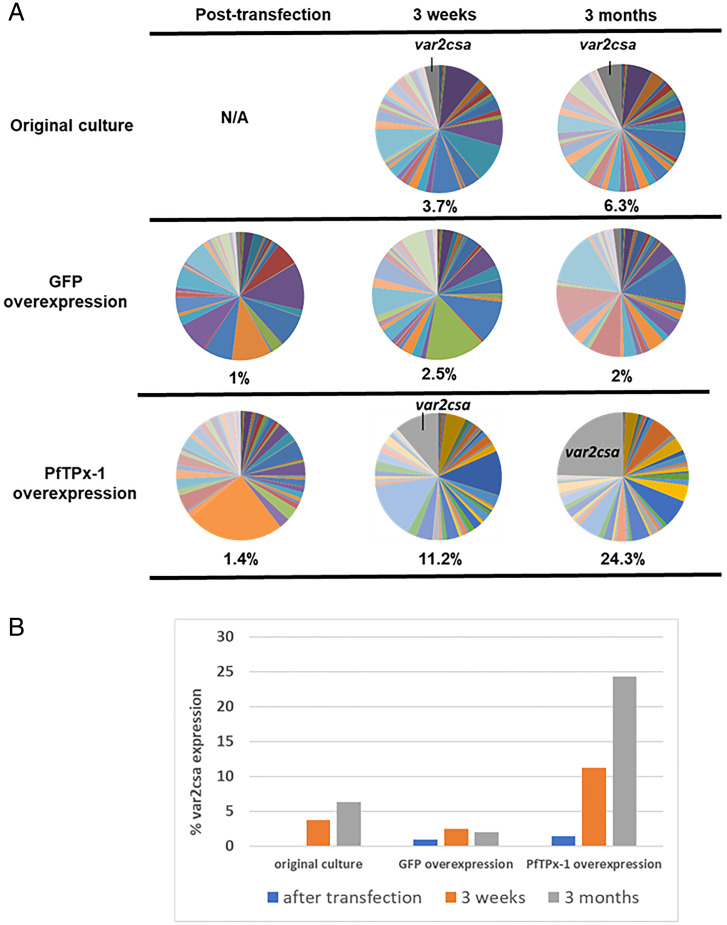
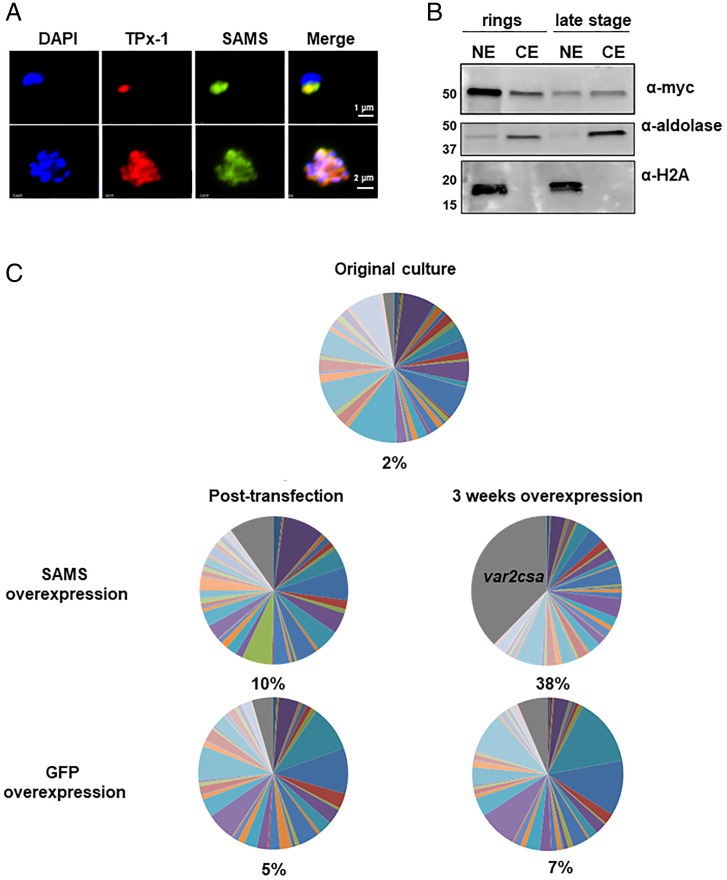
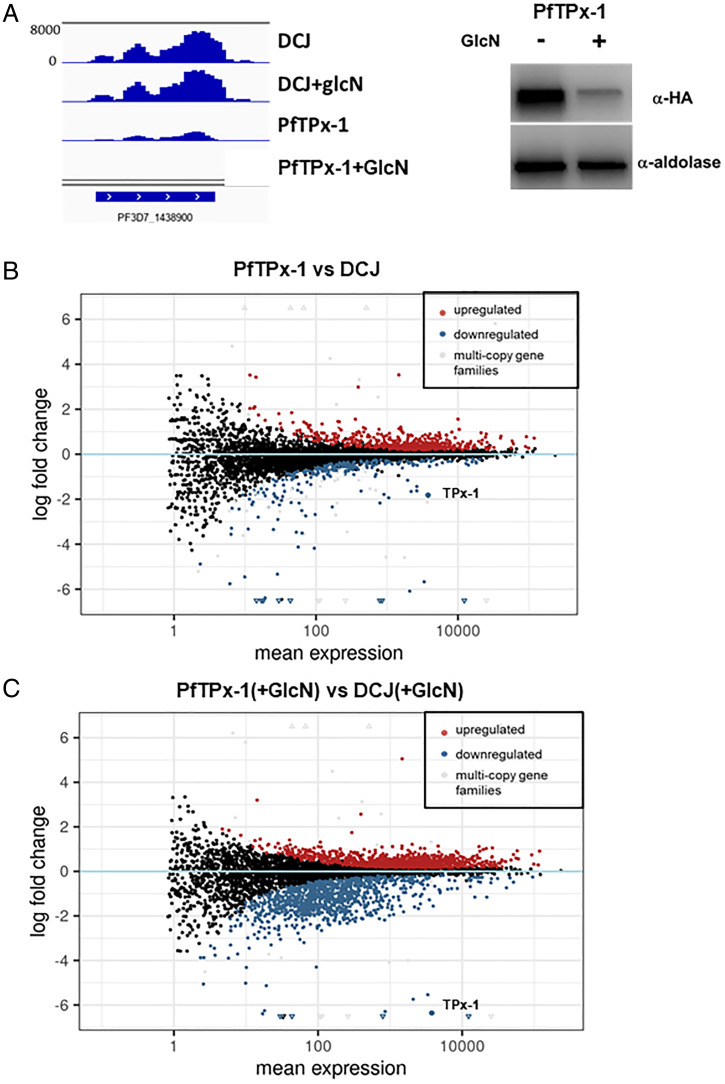
The virulence of Plasmodium falciparum, which causes the deadliest form of human malaria, is attributed to its ability to evade the human immune response. These parasites "choose" to express a single variant from a repertoire of surface antigens called PfEMP1, which are placed on the surface of the infected red cell. Immune evasion is achieved by switches in expression between var genes, each encoding a different PfEMP1 variant. While the mechanisms that regulate mutually exclusive expression of var genes are still elusive, antisense long-noncoding RNAs (lncRNAs) transcribed from the intron of the active var gene were implicated in the "choice" of the single active var gene. Here, we show that this lncRNA colocalizes with the site of var mRNA transcription and is anchored to the var locus via DNA:RNA interactions. We define the var lncRNA interactome and identify a redox sensor, P. falciparum thioredoxin peroxidase I (PfTPx-1), as one of the proteins associated with the var antisense lncRNA. We show that PfTPx-1 localizes to a nuclear subcompartment associated with active transcription on the nuclear periphery, in ring-stage parasite, when var transcription occurs. In addition, PfTPx-1 colocalizes with S-adenosylmethionine synthetase (PfSAMS) in the nucleus, and its overexpression leads to activation of var2csa, similar to overexpression of PfSAMS. Furthermore, we show that PfTPx-1 knockdown alters the var switch rate as well as activation of additional gene subsets. Taken together, our data indicate that nuclear PfTPx-1 plays a role in gene activation possibly by providing a redox-controlled nuclear microenvironment ideal for active transcription.

Keywords: Plasmodium falciparum; lncRNA; malaria; thioredoxin peroxidase; var genes.


Conflict of interest statement

The authors declare no competing interest.

Figures

Fig. 1.
Fig. 1.
var antisense lncRNAs colocalize with the site of var mRNA transcription and are anchored via DNA:RNA interactions. Dual color RNA-FISH of the var antisense lncRNA and the var mRNA of two different active var genes in tightly synchronized ring stage parasites at ∼18 h postinvasion. Nuclei are stained with DAPI (blue). (A) Dual color RNA-FISH showing the nuclear positioning of messenger RNA (red) and antisense ncRNA (green) actively transcribed from the PF3D7_0223500-BSD (Upper) or PF3D7_0421300 (Lower) var genes. (B) Quantification of positive nuclei shown in A. (C) Quantification of fluorescent signal appearance (diffused vs. spotted) of positive nuclei shown in A. (D) Nuclear positioning of mRNA (red) and antisense ncRNA (green) actively transcribed from the PF3D7_0223500-BSD (Upper) or PF3D7_0421300 (Lower) var genes after treatment with 120U of RNase-H. (E) Quantification of positive nuclei shown in D. (F) Quantification of fluorescent signal appearance (diffused vs. spotted) of positive nuclei shown in D. (Scale bars, 5 µm.)
Fig. 2.
Fig. 2.
The conserved region of the var antisense lncRNA is predicted to form secondary RNA structure and binds specific nuclear proteins. (A) Schematic diagram of var gene structure. The antisense lncRNA (gray line, ∼1.7 kb in length) is transcribed from a bidirectional promoter located at the var intron (black arrows) and can be divided into two regions: conserved region complimentary to the var intron (∼400 nt in length) and a hypervariable region complimentary to exon 1 (∼1,300 nt in length). The pairing element (PE) repeats of the var intron are marked with light blue, dark blue, and red rectangles. The presentation of the PE motifs above or below the genes represents their orientation on the DNA strands and on the lncRNA. (B) Secondary structure of PF3D7_0223500-BSD var antisense conserved region. Positions marked in green served for the antisense UA-RNA stem-loop probe (TATA) and positions marked in red served for the antisense PE RNA probe (IntPE). Prediction of secondary structures was done using the RNAfold Server of the ViennaRNA WEB. (C) Schematic diagram of affinity chromatography assay using streptavidin coated magnetic beads (blue circle), biotinylated nucleic acid probes (green circle and orange line, respectively), and nuclear extract (colored shapes). Purified proteins were analyzed using MS. Affinity chromatography was performed with nuclear extract produced from DC-J ON parasite line in which the chromosomal bsd cassette (PF3D7_0223500-BSD) is active. (D) dChIRP was performed using the DC-J OFF parasite line in which the var gene, PF3D7_0421300, is active. Two sets of probes were designed to bind the antisense lncRNA of PF3D7_0421300 (odds and evens) and were divided to three pools; probes designed to bind the conserved region of the antisense lncRNA (P1), probes designed to bind the hypervariable region of the antisense lncRNA (P2), and probes that are complementary to the 5′ edge of exon 1 in which the var lncRNA antisense does not reach (P3). Tightly synchronized ring-stage parasites at ∼18 h postinvasion were cross-linked and sonicated. Biotinylated probes were incubated with parasite extract and were bound to streptavidin magnetic beads. Proteins bound in each pool were identified using LC-MS/MS. (E) Venn diagram depicting the overlap in proteins identified using the three experimental approaches: TATA-stem loop affinity chromatography, IntPE single-stranded RNA affinity chromatography, and dCHIRP.
Fig. 3.
Fig. 3.
PfTPx-1 is localized to the active var expression site in ring-stage parasites. (A) Immunofluorescence microscopy of PfTPx-1, endogenously tagged with HAx3 in ring (Upper) and schizont (Lower) parasites. Nuclei are stained with DAPI. (Scale bar, 2 µm.) (B) Superresolution STORM imaging of tightly synchronized ring-stage parasites (∼18 h postinfection) expressing PfTPx-1HAx3. Nuclei stained with YOYO1 were imaged by conventional epifluorescence for cellular orientation. (Scale bar, 0.5 µm.) (C) Cellular fractionation of synchronized ring and late-stage parasites was performed on the PfTPx-1HAglmS line and nuclear and cytoplasmic extracts (NE and CE, respectively). PfTPx-1 was detected with anti-HA, antialdolase was used as a cytoplasmic marker, and antihistone H3 as a nuclear marker. (D) RNA-FISH, of var2csa-expressing parasites that episomally express sfGFP-PfTPx-1 fusion (green), using custom-designed Stellaris probes that hybridize to var2csa (red). In all nuclei (n = 111) PfTPx-1 was found to overlap with the active var mRNA. (Scale bar, 1 µm.)
Fig. 4.
Fig. 4.
PfTPx-1 localizes to a transcriptionally active nuclear region in ring-stage parasites. (A, Left) Immunofluorescence microscopy of PfTPx-1HAglms parasites where PfTPx-1 (green) is associated with the nucleolar protein, PfNop1 (red). Nuclei are stained with DAPI. (Scale bar, 1 µm.) (Right) An anti hNop1/Fibrillarin antibody specifically detects PfNop1 in parasite extract. (B) Superresolution STORM imaging of PfTPx-1 (green) and PfNop1 (red) in synchronized ring-stage PfTPx-1HA parasites. Nuclei stained with YOYO1 were imaged by conventional epifluorescence for cellular orientation. An area of overlap is enlarged (square Inset). (Scale bar, 0.5 and 0.2 µm, respectively.) (C) Immunofluorescence of ring-stage PfTPx-1HAglms (PfTPx-1 in green) transfected with a Sec13-Halo plasmid (red). (Scale bar, 2 µm.) (D) RNA-FISH of CSA expressing parasites that carry a Sec13-Halo plasmid (green). RNA-FISH was performed using custom-designed Stellaris probes that hybridize to var2csa transcripts (red). Representative images of colocalized signals (Upper) and adjacent signals (Lower) are shown. (Scale bar, 1 µm.) Quantification of signals (n = 128) that were found to be overlapping or adjacent to each other are shown to the right.
Fig. 5.
Fig. 5.
PfTPx-1 is involved in var gene switching. (A) Schematic of experimental design. Parasites were grown in the absence or presence of 5 mM glucosamine for the duration of the experiment (±GlcN). Blasticidin was added continuously for 3 wk to induce switching to the var-bsd (+blast, red rectangle). Blasticidin was then removed from the cultures to monitor switching away from var-bsd (−blast, blue rectangle). Parasites were collected 3, 6, or 12 wk following blasticidin removal. Synchronous ring-stage parasite (20 to 22 h postsynchronization) cultures were collected for RNA, and RT-qPCR for the var gene family was performed on cDNA at the times indicated. (B) Off switch rates per generation were calculated and plotted against the relative PfTPx-1 mRNA levels of the different parasite lines. The results of the two biological replicates are shown in blue or red dots. The ranges of the calculated switch rates per generation, for each of the parasite lines, are presented in the lower table. (C) Dynamics in var switching patterns over time measured by RT-qPCR. Each pie graph represents the total of var gene transcripts with each slice of the pie representing the abundance of an individual var gene within the pool of var transcripts. The percentage of bsd transcript present in the total var gene pool is written below each pie graph and the off rate of bsd is written in red.
Fig. 6.
Fig. 6.
PfTPx-1 overexpression induces activation of var2csa. (A) var gene-expression profiles were determined by RT-qPCR for each culture posttransfection at low levels of PfTPx-1 or GFP (control) overexpression and then 3 wk and 3 mo after increasing levels of overexpression by increasing the dose of blasticidin from 2 to 10 µg/mL. var gene expression was also determined from the original parent culture, C3, at 3 wk and 3 mo in culture. Each pie graph represents the total of var gene transcripts with each slice of the pie representing the abundance of an individual var gene within the pool of var transcripts. The percentage of var2csa transcript present in the total var gene pool is written below each pie graph. (B) Quantification of the percentage of var2csa transcript within the total var transcript pool for each parasite population.
Fig. 7.
Fig. 7.
PfTPx-1 colocalizes with PfSAMS in the nucleus of ring stage parasites. (A) Immunofluorescence microscopy of PfTPx-1HAglmS parasites (PfTPx-1 in red) transfected with a plasmid expressing PfSAM-synthetase with a mycx3 tag (green) in ring (Upper) and schizont (Lower) parasites. Nuclei are stained with DAPI. (Scale bar, 1 µm.) (B) PfSAMS is primarily nuclear in ring-stage parasites. Cellular fractionation of synchronized ring- and late-stage parasites was performed and the nuclear and cytoplasmic extracts (NE and CE, respectively) were subjected to Western blot analysis. PfSAMS was detected using anti-myc antibody; antialdolase antibody was used to confirm cytoplasmic extraction, while antihistone H2A was used as a nuclear marker. (C) var gene-expression profiles were determined by RT-qPCR for PfTPx-1HAglmS ring-stage parasites overexpressing PfSAMS or GFP control after 1 mo of overexpression (5 µg/mL blasticidin). The percentage of var2csa transcript present in the total var gene pool was calculated and is written below each pie graph.
Fig. 8.
Fig. 8.
PfTPx-1 knockdown causes transcriptional changes of several gene subsets. (A) Expression profile for the PfTPx-1 transcript (PF3D7_1438900) (bedgraph coverage illustration of relative expression from IGV) showing the knockdown of the PfTPx-1 in the transgenic line compared to the parent DC-J line. Western blot analysis demonstrating the reduction of PfTPx-1 protein levels in the transgenic lines are shown on the right. (B and C) MAplots of PfTPx-1HAglmS vs. DC-J control without (B) and with GlcN (C), show genes that are differentially regulated upon down-regulation of PfTPx-1 with GlcN. Within the plots, black dots represent nonsignificant genes. Significantly up-regulated and down-regulated genes (Padj < 0.05) are shown in red and blue, respectively. Significantly changed genes of the multicopy gene families are shown in gray. Triangles are used to represent values that are beyond the axes limit.

Similar articles

Cited by

References

    1. (WHO) World Malaria Report 2020 (2020). https://www.who.int/publications/i/item/9789240015791. Accessed 31 July 2022.
    1. Otto T. D., et al. , Long read assemblies of geographically dispersed Plasmodium falciparum isolates reveal highly structured subtelomeres. Wellcome Open Res. 3, 52 (2018). - PMC - PubMed
    1. Dzikowski R., Deitsch K. W., Genetics of antigenic variation in Plasmodium falciparum. Curr. Genet. 55, 103–110 (2009). - PMC - PubMed
    1. Epp C., Li F., Howitt C. A., Chookajorn T., Deitsch K. W., Chromatin associated sense and antisense noncoding RNAs are transcribed from the var gene family of virulence genes of the malaria parasite Plasmodium falciparum. RNA 15, 116–127 (2009). - PMC - PubMed
    1. Amit-Avraham I., et al. , Antisense long noncoding RNAs regulate var gene activation in the malaria parasite Plasmodium falciparum. Proc. Natl. Acad. Sci. U.S.A. 112, E982–E991 (2015). - PMC - PubMed

Publication types

Substances

LinkOut - more resources