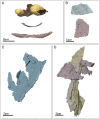
Examining atherosclerotic lesions in three dimensions at the nanometer scale with cryo-FIB-SEM
- PMID: 35939716
- PMCID: PMC9407640
- DOI: 10.1073/pnas.2205475119
Examining atherosclerotic lesions in three dimensions at the nanometer scale with cryo-FIB-SEM
Abstract
We employed in a correlative manner an unconventional combination of methods, comprising cathodoluminescence, cryo-scanning electron microscopy (SEM), and cryo-focused ion beam (FIB)-SEM, to examine the volumes of thousands of cubed micrometers from rabbit atherosclerotic tissues, maintained in close-to-native conditions, with a resolution of tens of nanometers. Data from three different intralesional regions, at the media-lesion interface, in the core, and toward the lumen, were analyzed following segmentation and volume or surface representation. The media-lesion interface region is rich in cells and lipid droplets, whereas the core region is markedly richer in crystals and has lower cell density. In the three regions, thin crystals appear to be associated with intracellular or extracellular lipid droplets and multilamellar bodies. Large crystals are independently positioned in the tissue, not associated with specific cellular components. This extensive evidence strongly supports the idea that the lipid droplet surfaces and the outer membranes of multilamellar bodies play a role in cholesterol crystal nucleation and growth and that crystal formation occurs, in part, inside cells. The correlative combination of methods that allowed the direct examination of cholesterol crystals and lipid deposits in the atherosclerotic lesions may be similarly used for high-resolution examination of other tissues containing pathological or physiological cholesterol deposits.
Keywords: atherosclerosis in rabbit models; cathodoluminescence; cholesterol crystals; correlative electron microscopy; lipid droplet.
Conflict of interest statement
The authors declare no competing interest.
Figures


Similar articles
-
3D cryoimaging of cell-mediated cholesterol crystal clearance in human atherosclerotic lesions.Proc Natl Acad Sci U S A. 2025 Sep 16;122(37):e2510133122. doi: 10.1073/pnas.2510133122. Epub 2025 Sep 5. Proc Natl Acad Sci U S A. 2025. PMID: 40911589
-
Cryo DualBeam Focused Ion Beam-Scanning Electron Microscopy to Evaluate the Interface Between Cells and Nanopatterned Scaffolds.Tissue Eng Part C Methods. 2011 Jan;17(1):1-7. doi: 10.1089/ten.TEC.2010.0251. Epub 2010 Aug 11. Tissue Eng Part C Methods. 2011. PMID: 20594113
-
Cryo-focused-ion-beam applications in structural biology.Arch Biochem Biophys. 2015 Sep 1;581:122-30. doi: 10.1016/j.abb.2015.02.009. Epub 2015 Feb 20. Arch Biochem Biophys. 2015. PMID: 25703192 Review.
-
Advanced cryo-tomography workflow developments - correlative microscopy, milling automation and cryo-lift-out.J Microsc. 2021 Feb;281(2):112-124. doi: 10.1111/jmi.12939. Epub 2020 Jul 2. J Microsc. 2021. PMID: 32557536
-
The Pathogen-Host Interface in Three Dimensions: Correlative FIB/SEM Applications.Trends Microbiol. 2019 May;27(5):426-439. doi: 10.1016/j.tim.2018.11.011. Epub 2018 Dec 29. Trends Microbiol. 2019. PMID: 30600140 Review.
Cited by
-
Cholesterol esters form supercooled lipid droplets whose nucleation is facilitated by triacylglycerols.Nat Commun. 2023 Feb 17;14(1):915. doi: 10.1038/s41467-023-36375-6. Nat Commun. 2023. PMID: 36807572 Free PMC article.
-
Lipid Droplet Surface Promotes 3D Morphological Evolution of Non-Rhomboidal Cholesterol Crystals.Adv Sci (Weinh). 2025 Jan;12(1):e2409201. doi: 10.1002/advs.202409201. Epub 2024 Nov 8. Adv Sci (Weinh). 2025. PMID: 39513471 Free PMC article.
-
Structural biology inside multicellular specimens using electron cryotomography.Q Rev Biophys. 2025 Jan 13;58:e6. doi: 10.1017/S0033583525000010. Q Rev Biophys. 2025. PMID: 39801355 Free PMC article. Review.
-
Cholesterol crystals in the pathogenesis of atherosclerosis.Nat Rev Cardiol. 2025 May;22(5):315-332. doi: 10.1038/s41569-024-01100-3. Epub 2024 Nov 18. Nat Rev Cardiol. 2025. PMID: 39558130 Review.
References
-
- Abela G. S., Cholesterol crystals piercing the arterial plaque and intima trigger local and systemic inflammation. J. Clin. Lipidol. 4, 156–164 (2010). - PubMed
-
- Dai J., et al. , Association between cholesterol crystals and culprit lesion vulnerability in patients with acute coronary syndrome: An optical coherence tomography study. Atherosclerosis 247, 111–117 (2016). - PubMed
Publication types
MeSH terms
Substances
LinkOut - more resources
Full Text Sources
Medical

