. 2022 Oct:32:100830.
doi: 10.1016/j.neo.2022.100830. Epub 2022 Aug 5.

Targeting interleukin 4 receptor alpha on tumor-associated macrophages reduces the pro-tumor macrophage phenotype

Affiliations

Targeting interleukin 4 receptor alpha on tumor-associated macrophages reduces the pro-tumor macrophage phenotype

Amber E de Groot et al. Neoplasia. 2022 Oct.

Abstract

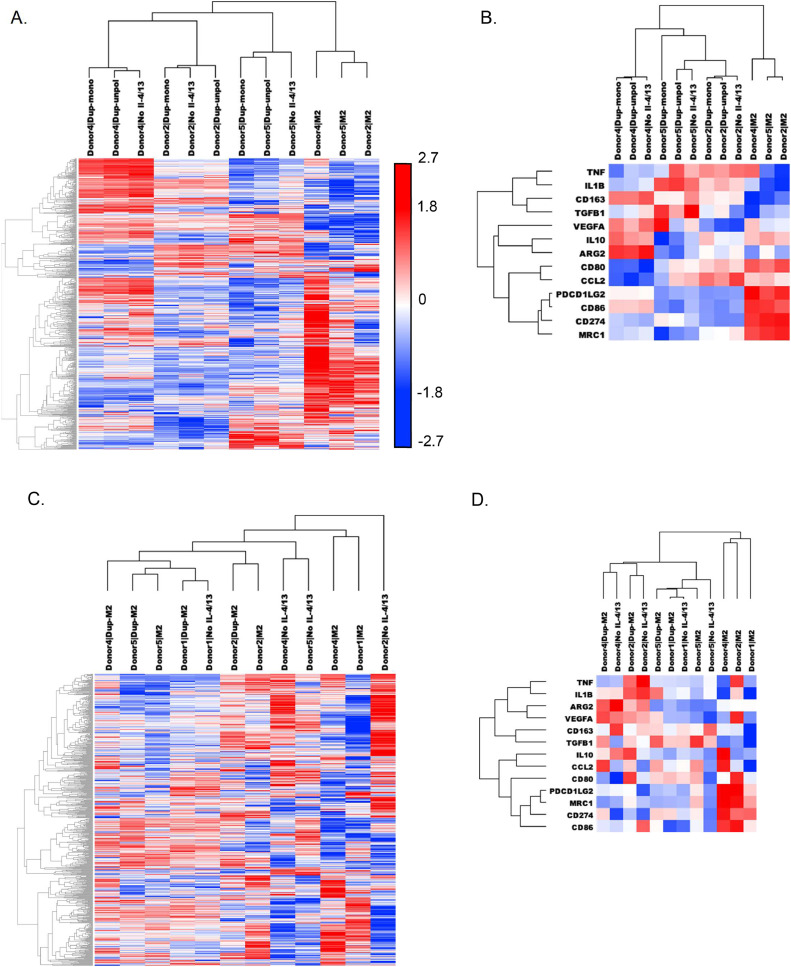
Tumor-associated macrophages (TAMs) are an abundant tumor-promoting cell type in the tumor microenvironment (TME). Most TAMs exhibit a pro-tumor M2-like phenotype supportive of tumor growth, immune evasion, and metastasis. IL-4 and IL-13 are major cytokines that polarize macrophages to an M2 subset and share a common receptor, IL-4 receptor alpha (IL-4R alpha). Treatment of human ex vivo polarized M2 macrophages and M2 macrophage precursors with IL-4R alpha antagonist antibody Dupilumab (Dupixent) reduces M2 macrophage features, including a shift in cell surface marker protein expression and gene expression. In animal models of prostate cancer, both pharmacologic inhibition of IL-4R alpha and genetic deletion of IL-4R alpha utilizing an Il4ra -/- mouse model result in decreased CD206 on TAMs. These data support IL-4R alpha as a target to reduce the pro-tumor, M2-like macrophage phenotype as a novel adjunct cancer therapy.

Keywords: Dupilumab; Dupixent; IL-4; IL-4R alpha; Macrophage; Prostate cancer.


Figures

Figure 1
Figure 1
Effects of Dupilumab on monocyte, M0, M1, and M2 signaling and protein expression. (A) A representative immunoblot of M2 macrophages, macrophages polarized with the M2 protocol except without IL-4 or IL13 (“No IL-4/13”), and Dupilumab-treated conditions. (B) Flow cytometry and (C) corresponding delta median fluorescence intensities (MFIs) of Dupilumab-treated M2 precursors (Dup-mono and Dup-unol). (D) Flow cytometry and (E) corresponding delta median fluorescence intensities (MFIs) of Dupilumab-treated M2 macrophages (Dup-M2).
Figure 2
Figure 2
Gene expression changes with Dupilumab treatment. Dupliumab was added to M2 precursors prior to polarization: M2, No IL-4/13, Dupmono, and Dup-unpol conditions were prepared from 3 separate donors (Donors 2, 4, and 5). (A) Heat map and dendrograms comparing each condition across all expressed genes in the nCounter Myeloid Innate Immunity Panel. (B) Heat map and dendrograms comparing each comparing each condition across canonical pro- and anti-tumor genes. Dupliumab was added after M2 polarization: M2, No IL-4/13, and Dup-M2 conditions were prepared from 4 separate donors (Donors 1, 2, 4, and 5). (C) Heat map and dendrograms comparing each condition across all expressed genes in the nCounter Myeloid Innate Immunity Panel. (D) Heat map and dendrograms comparing each condition across canonical pro- and anti-tumor genes. (E) Heat map and dendrograms comparing Dupilumab treated M2 precursors and macrophages with M1s, M0s and monocytes across canonical pro- and anti-tumor genes. Heat maps were generated using unsupervised hierarchical clustering with centered Pearson Correlation.
Figure 2
Figure 2
Gene expression changes with Dupilumab treatment. Dupliumab was added to M2 precursors prior to polarization: M2, No IL-4/13, Dupmono, and Dup-unpol conditions were prepared from 3 separate donors (Donors 2, 4, and 5). (A) Heat map and dendrograms comparing each condition across all expressed genes in the nCounter Myeloid Innate Immunity Panel. (B) Heat map and dendrograms comparing each comparing each condition across canonical pro- and anti-tumor genes. Dupliumab was added after M2 polarization: M2, No IL-4/13, and Dup-M2 conditions were prepared from 4 separate donors (Donors 1, 2, 4, and 5). (C) Heat map and dendrograms comparing each condition across all expressed genes in the nCounter Myeloid Innate Immunity Panel. (D) Heat map and dendrograms comparing each condition across canonical pro- and anti-tumor genes. (E) Heat map and dendrograms comparing Dupilumab treated M2 precursors and macrophages with M1s, M0s and monocytes across canonical pro- and anti-tumor genes. Heat maps were generated using unsupervised hierarchical clustering with centered Pearson Correlation.
Figure 3
Figure 3
Tumor growth and immune characteristics with IL-4R alpha signaling inhibition. FVB/N mice were inoculated with subcutaneous MycCaP tumors and treated twice per week with combinations of anti-IL-4R alpha, anti-IL-4 antibodies, or corresponding isotype controls. (A) Tumor growth measured by caliper measures and (B) endpoint tumor weight. Immune cell populations were determined by flow cytometry for (C) macrophages, (D) CD206+ macrophages, (E) CD206 relative MFI on tumor macrophages, (F) CD8+ T cells, and (G) CD4+ T cells. Relative mean fluorescence intensity (MFI) was determined by setting the average MFI of the WT cohort to 1. Significance of bar graphs were determined by one-way ANOVA followed by pairwise comparison with * p < 0.05, ** p < 0.01 and *** p < 0.001.
Figure 4
Figure 4
Il4ra KO versus WT tumor growth and immune characteristics. FVB/N Il4ra knockout (KO) and wild type (WT) mice were inoculated with subcutaneous MycCaP-luc tumors. (A) IL-4R alpha protein expression in FVB/N WT and FVB/N Il4ra KO spleens. (B) Tumor growth measured by BLI and (C) quantified at Day 18. (D) Tumor growth measured by caliper measurements. (E) Endpoint tumor weight. Immune cell populations were determined by flow cytometry for (F) macrophages, (G) CD206+ macrophages, (H) CD206 relative MFI on tumor macrophages, (I) CD8+ T cells, and (J) CD4+ T cells. Relative mean fluorescence intensity (MFI) was determined by setting the average MFI of the WT cohort to 1. Significance of bar graphs were determined by oneway ANOVA followed by pairwise comparison with * p < 0.05 and ** p < 0.01.

References

    1. Pollard JW. Tumour-educated macrophages promote tumour progression and metastasis. Perspective. 2004;4:71. doi: 10.1038/nrc1256. - DOI - PubMed
    1. Zarif JC, Baena-Del Valle JA, Hicks JL, et al. Mannose receptor-positive macrophage infiltration correlates with prostate cancer onset and metastatic castration-resistant disease. Eur Urol Oncol. 2019;2(4):429–436. doi: 10.1016/j.euo.2018.09.014. - DOI - PMC - PubMed
    1. Shiao SL, Chu GC-Y, Chung LWK. Regulation of prostate cancer progression by the tumor microenvironment. Cancer Lett. 2016;380(1):340–348. doi: 10.1016/j.canlet.2015.12.022. - DOI - PMC - PubMed
    1. Zarif JC, Taichman RS, Pienta KJ. TAM macrophages promote growth and metastasis within the cancer ecosystem. Oncoimmunology. 2014;3(7) doi: 10.4161/21624011.2014.941734. - DOI - PMC - PubMed
    1. Hu W, Qian Y, Yu F, et al. Alternatively activated macrophages are associated with metastasis and poor prognosis in prostate adenocarcinoma. Oncol Lett. 2015;10(3):1390–1396. doi: 10.3892/ol.2015.3400. - DOI - PMC - PubMed