. 2022 Sep;609(7928):846-853.
doi: 10.1038/s41586-022-05159-1. Epub 2022 Aug 8.

Autoantibody mimicry of hormone action at the thyrotropin receptor

Affiliations

Autoantibody mimicry of hormone action at the thyrotropin receptor

Bryan Faust et al. Nature. 2022 Sep.

Abstract

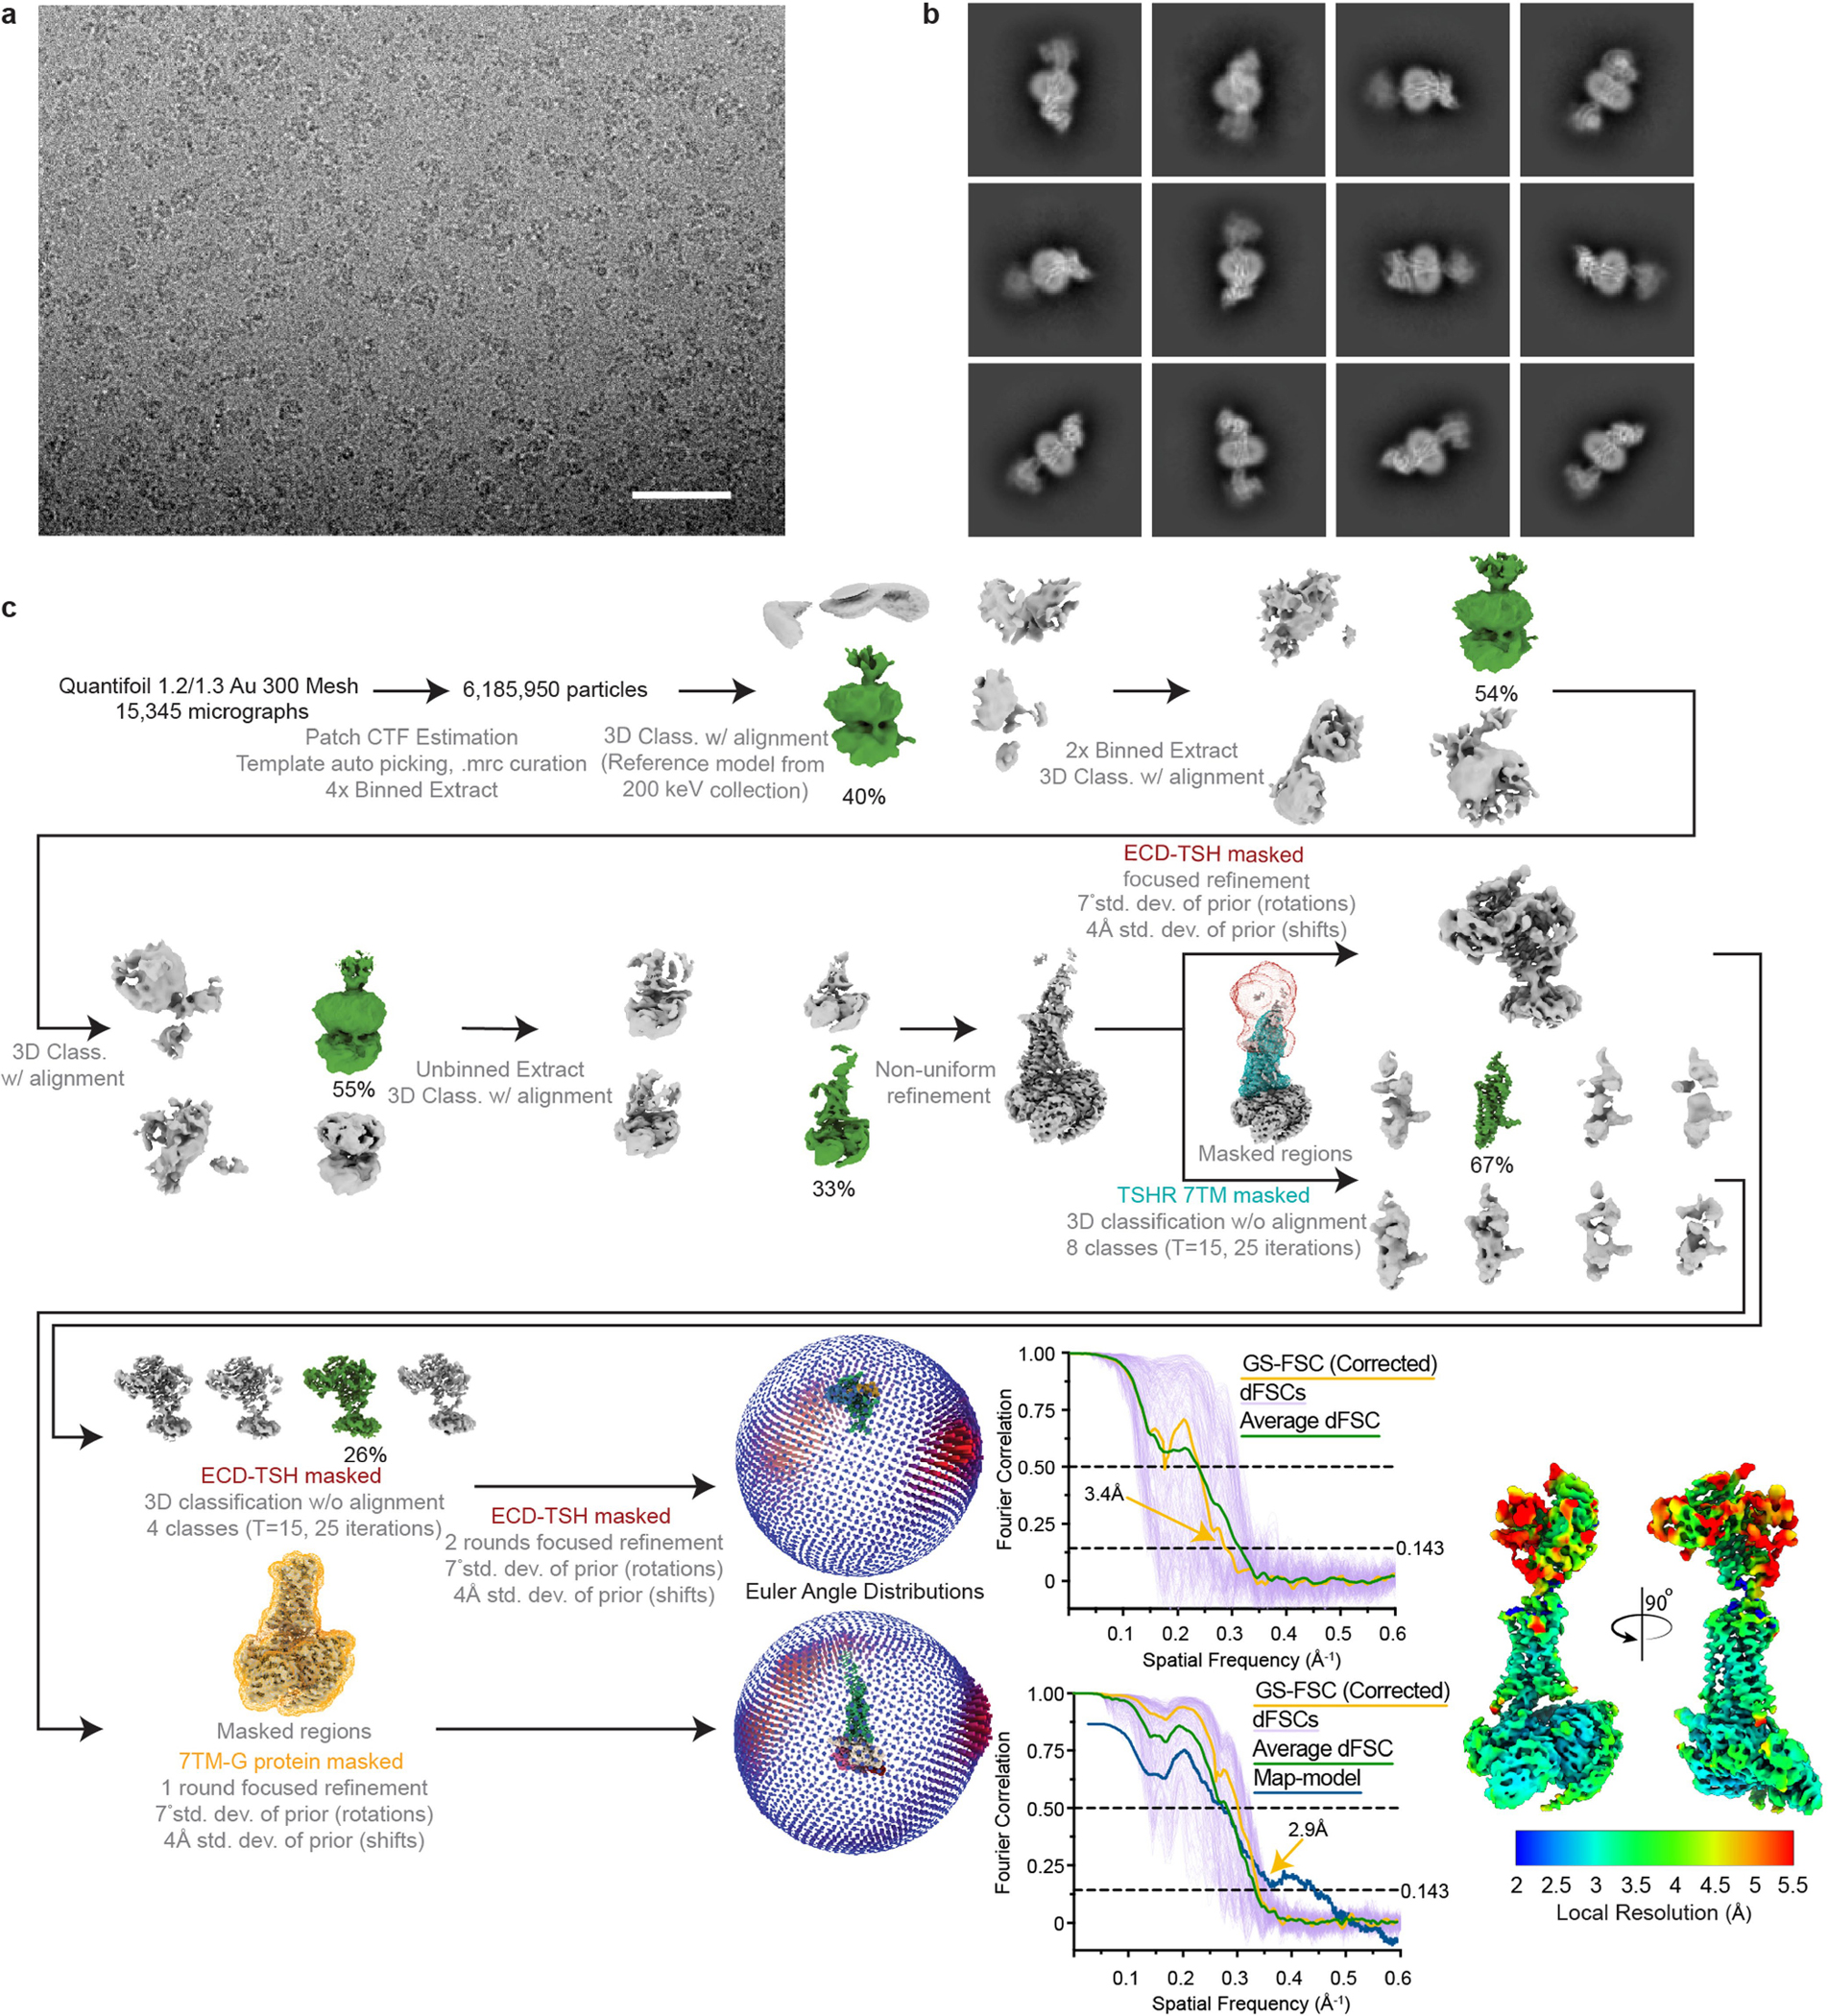
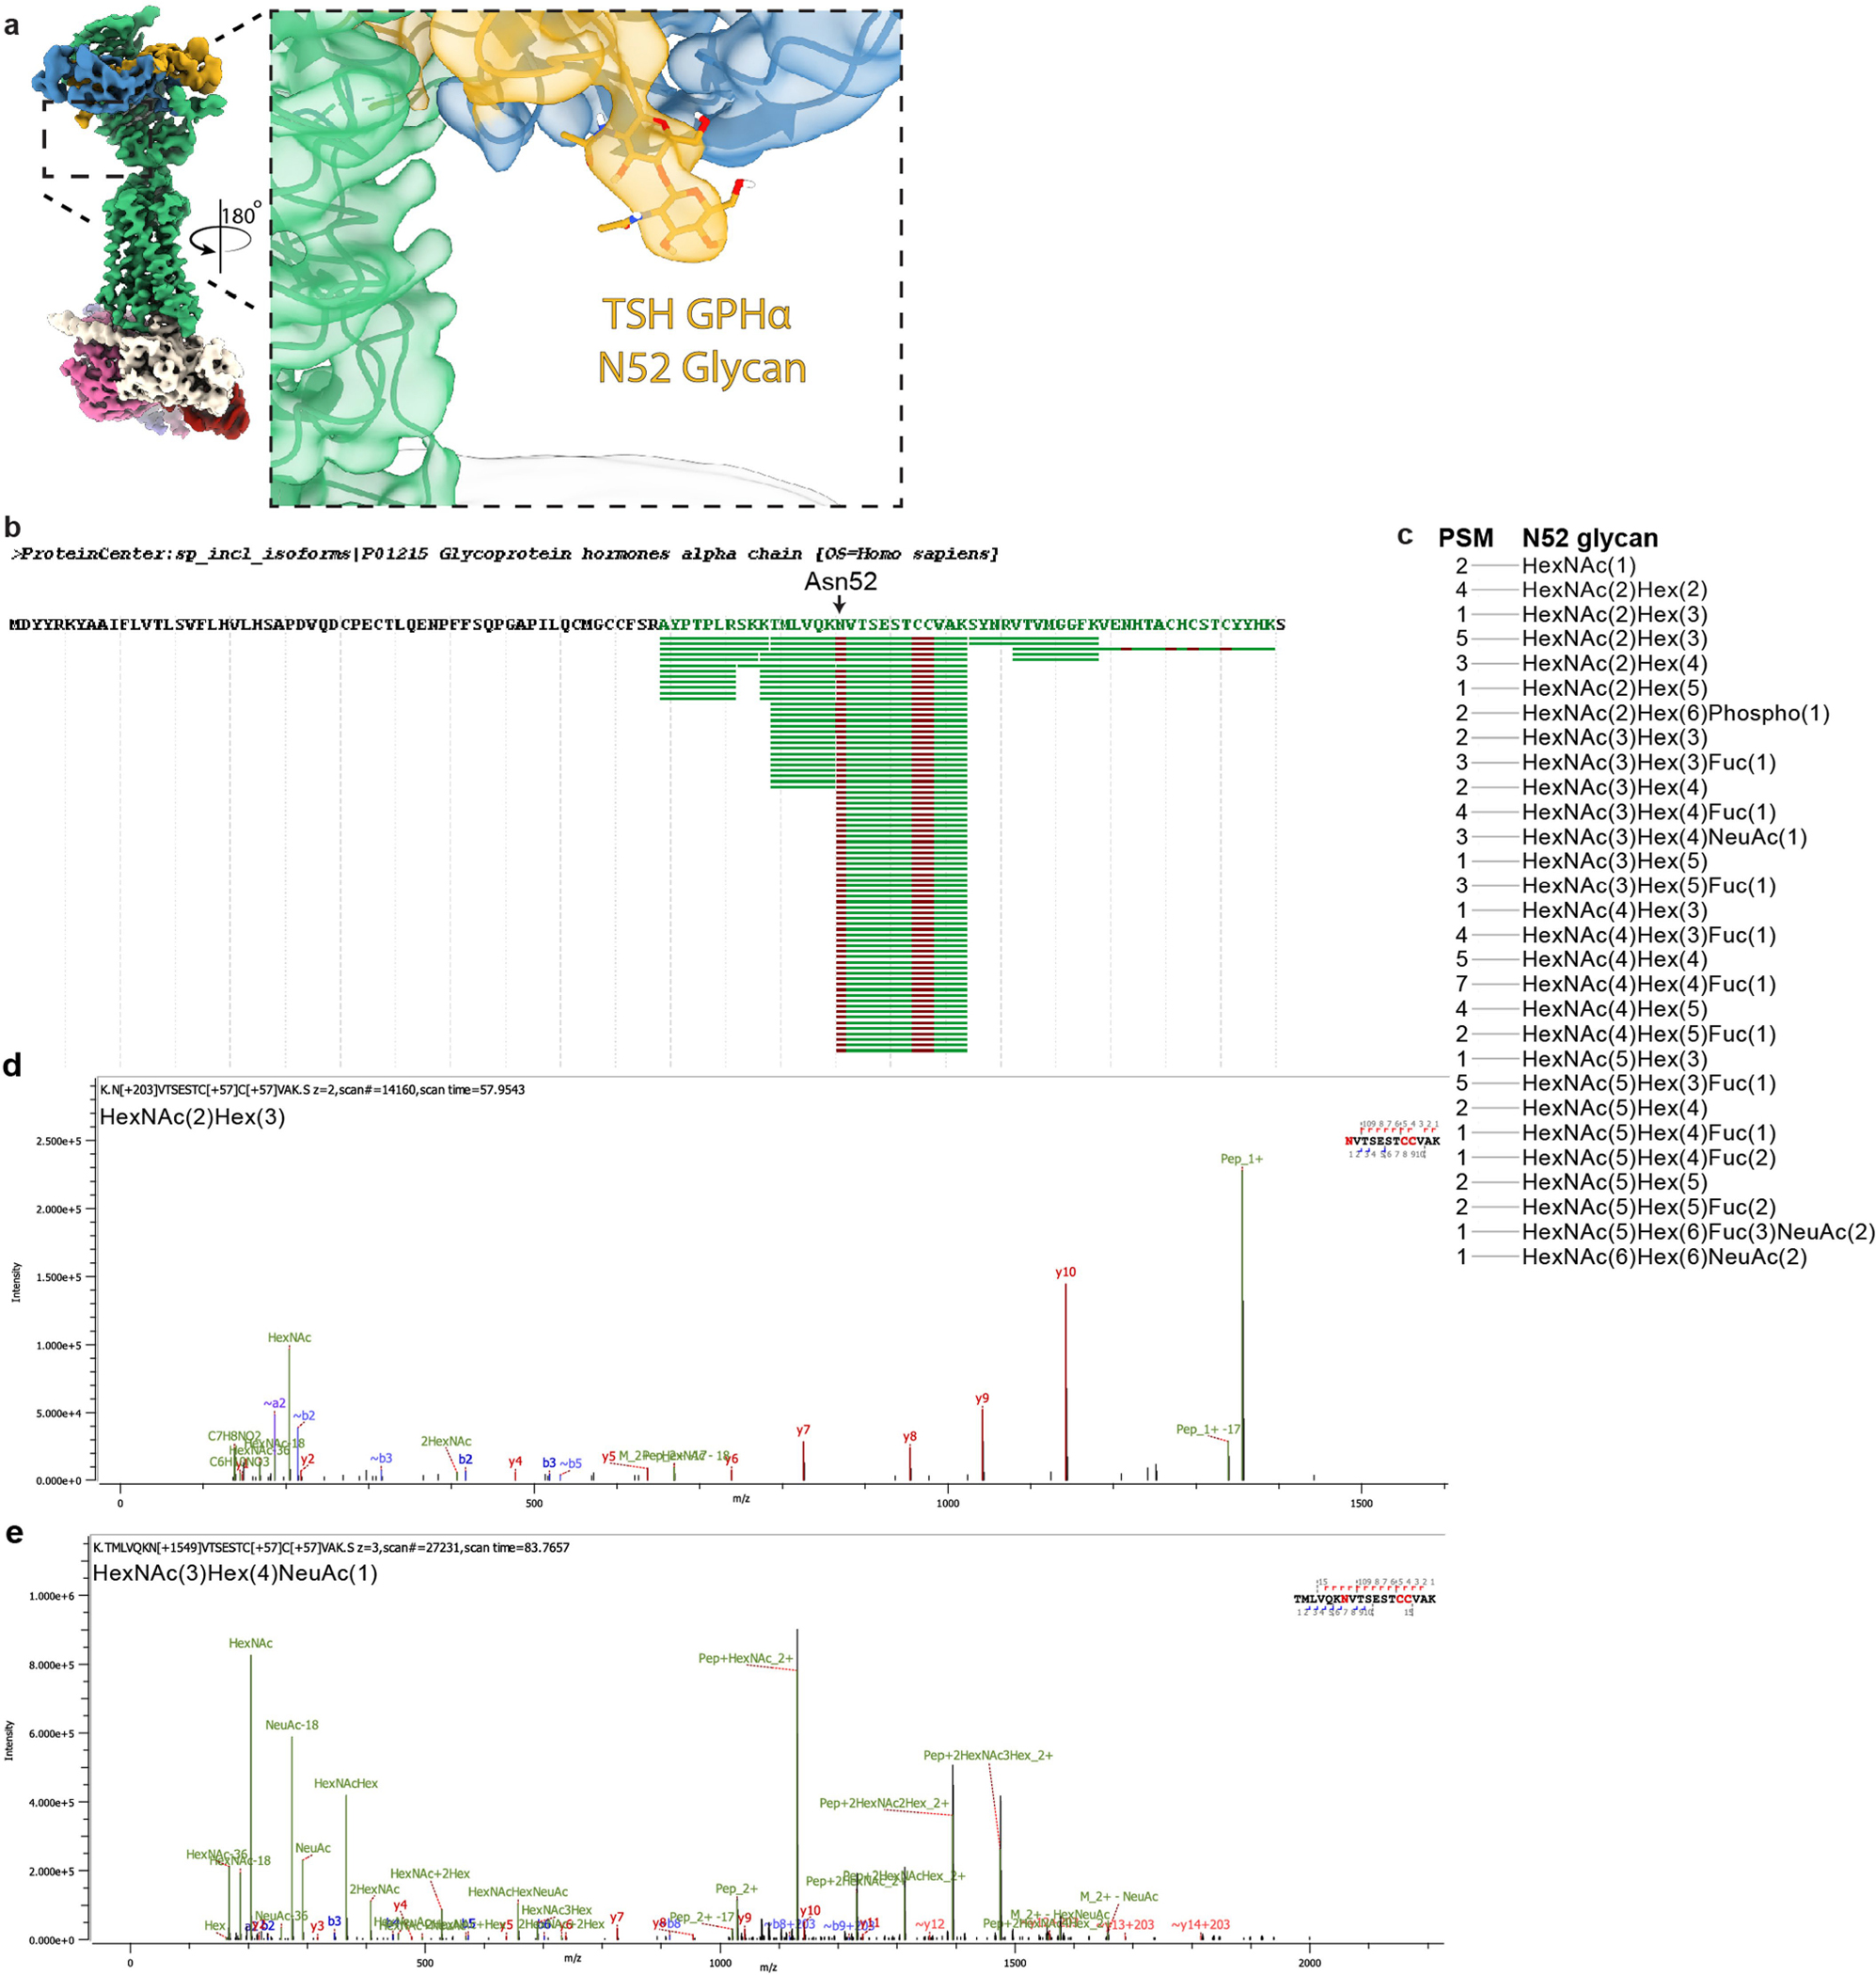
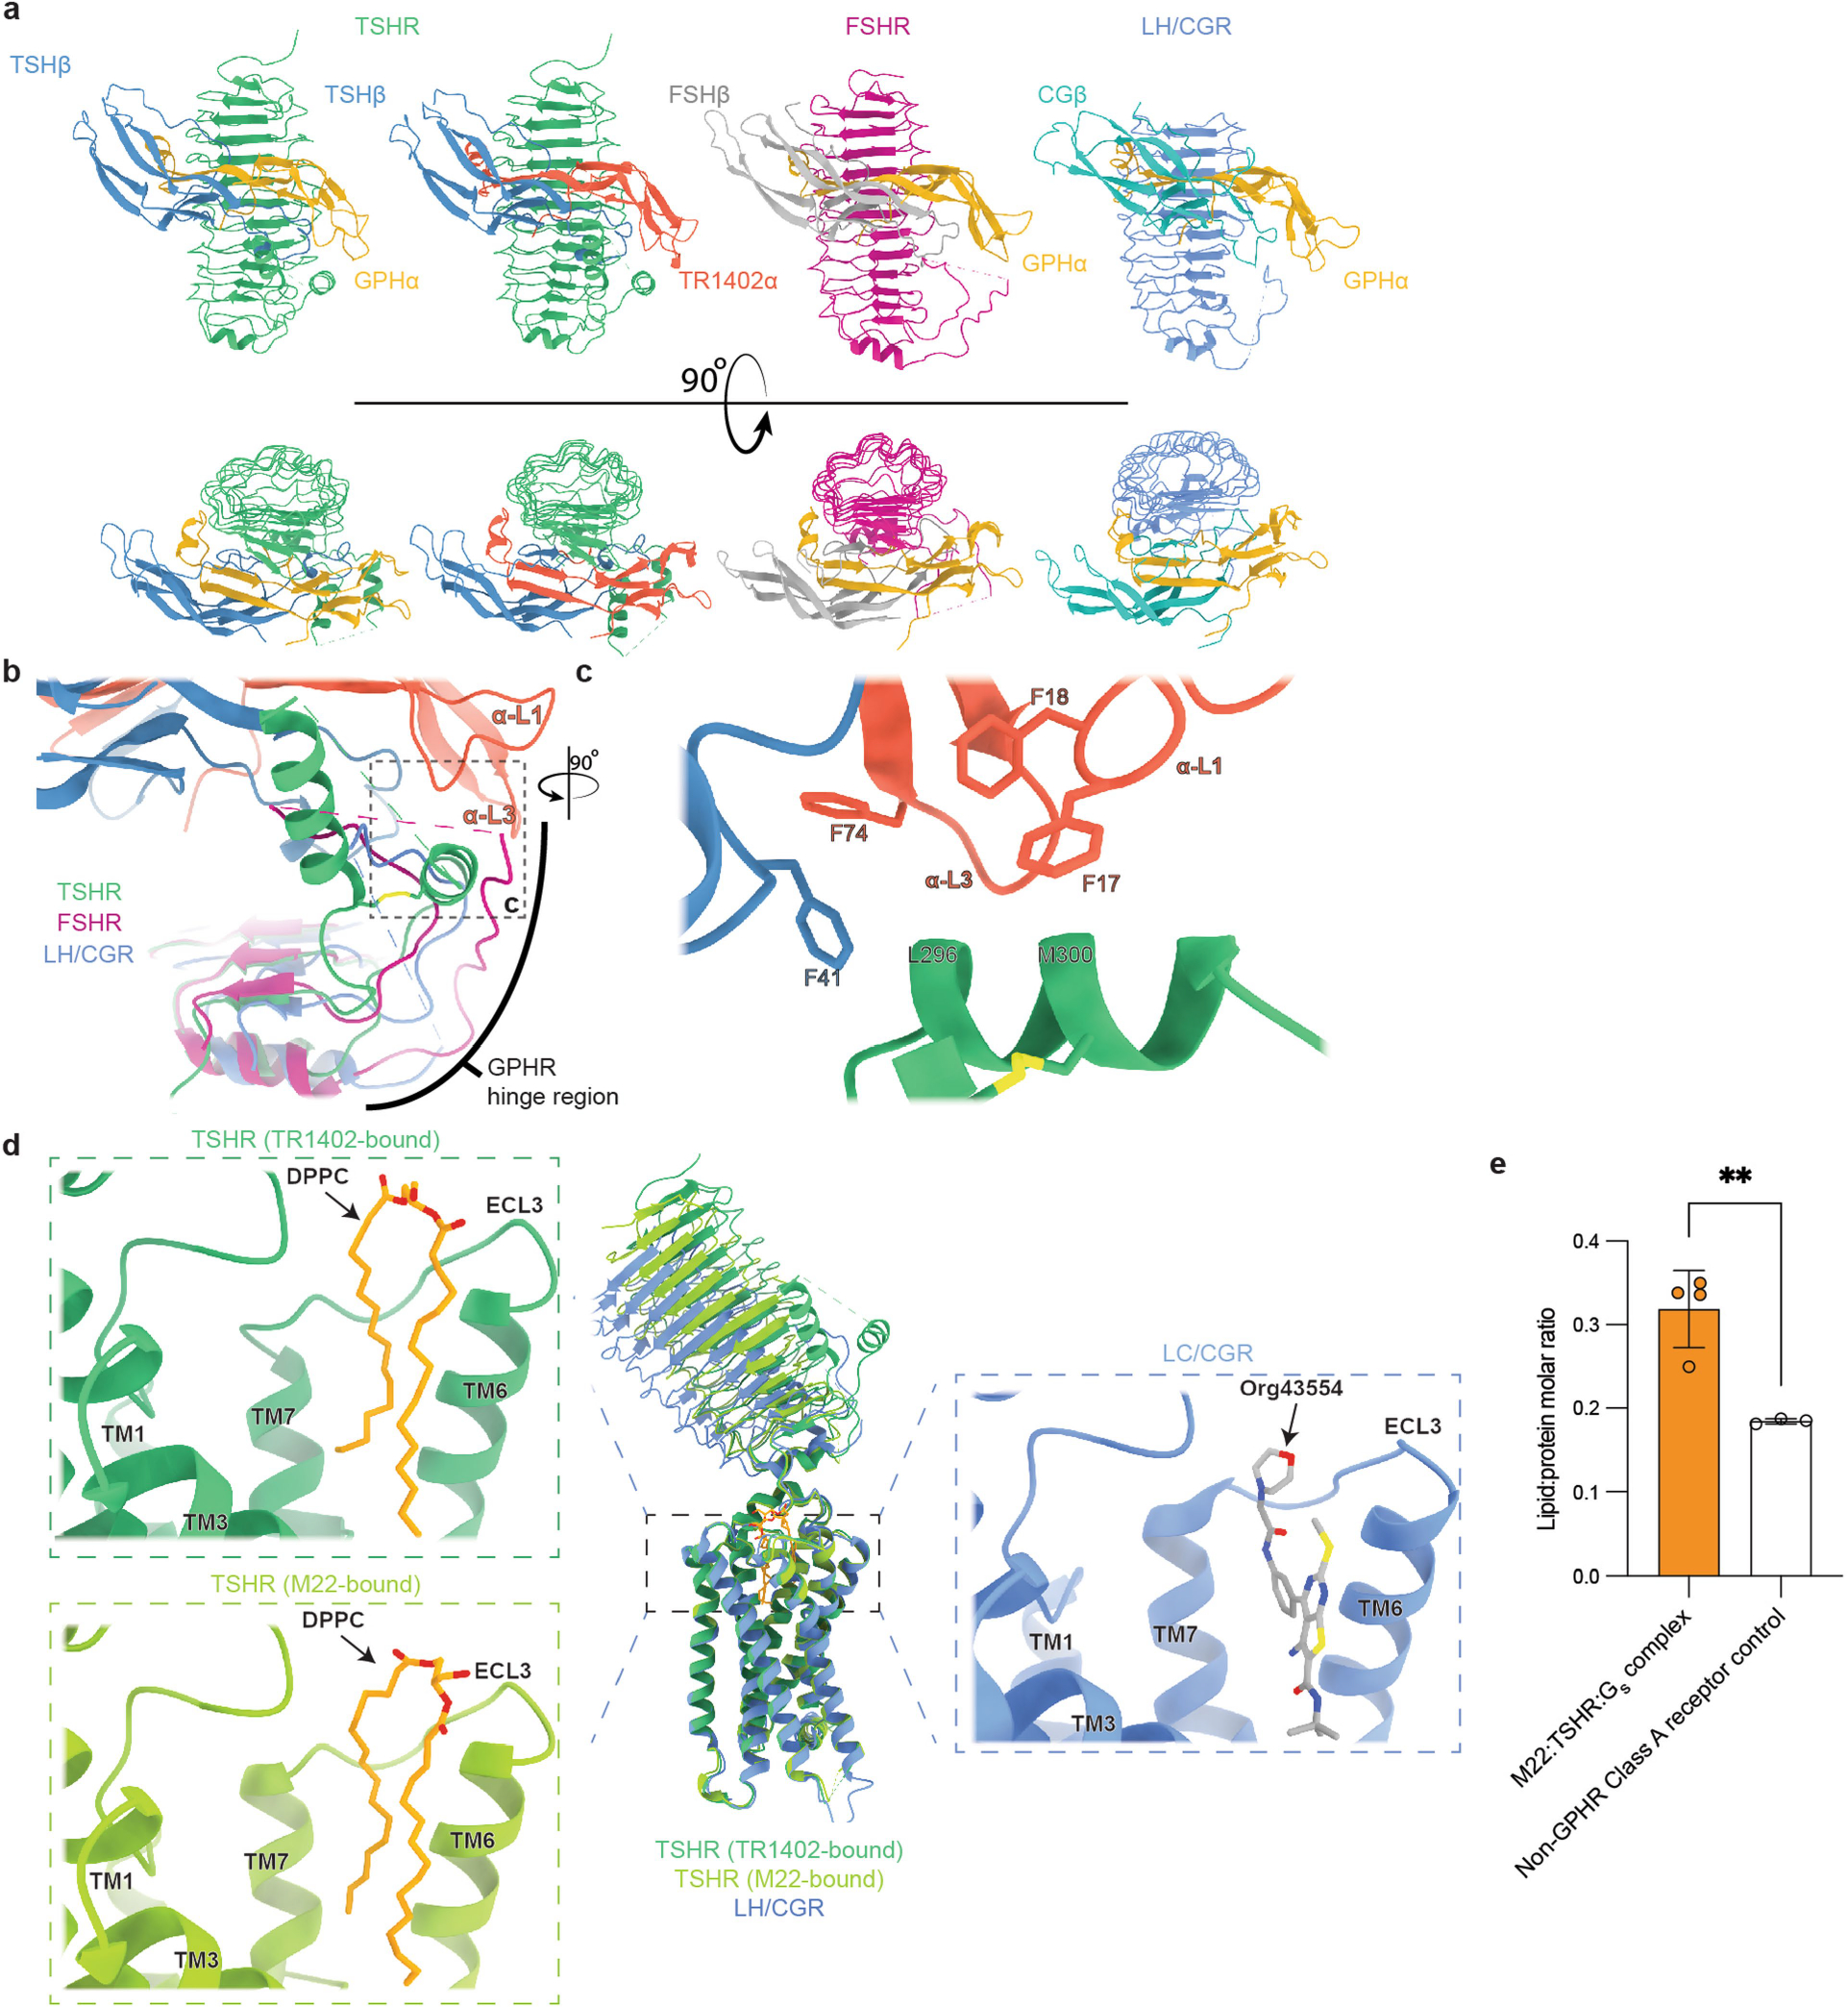
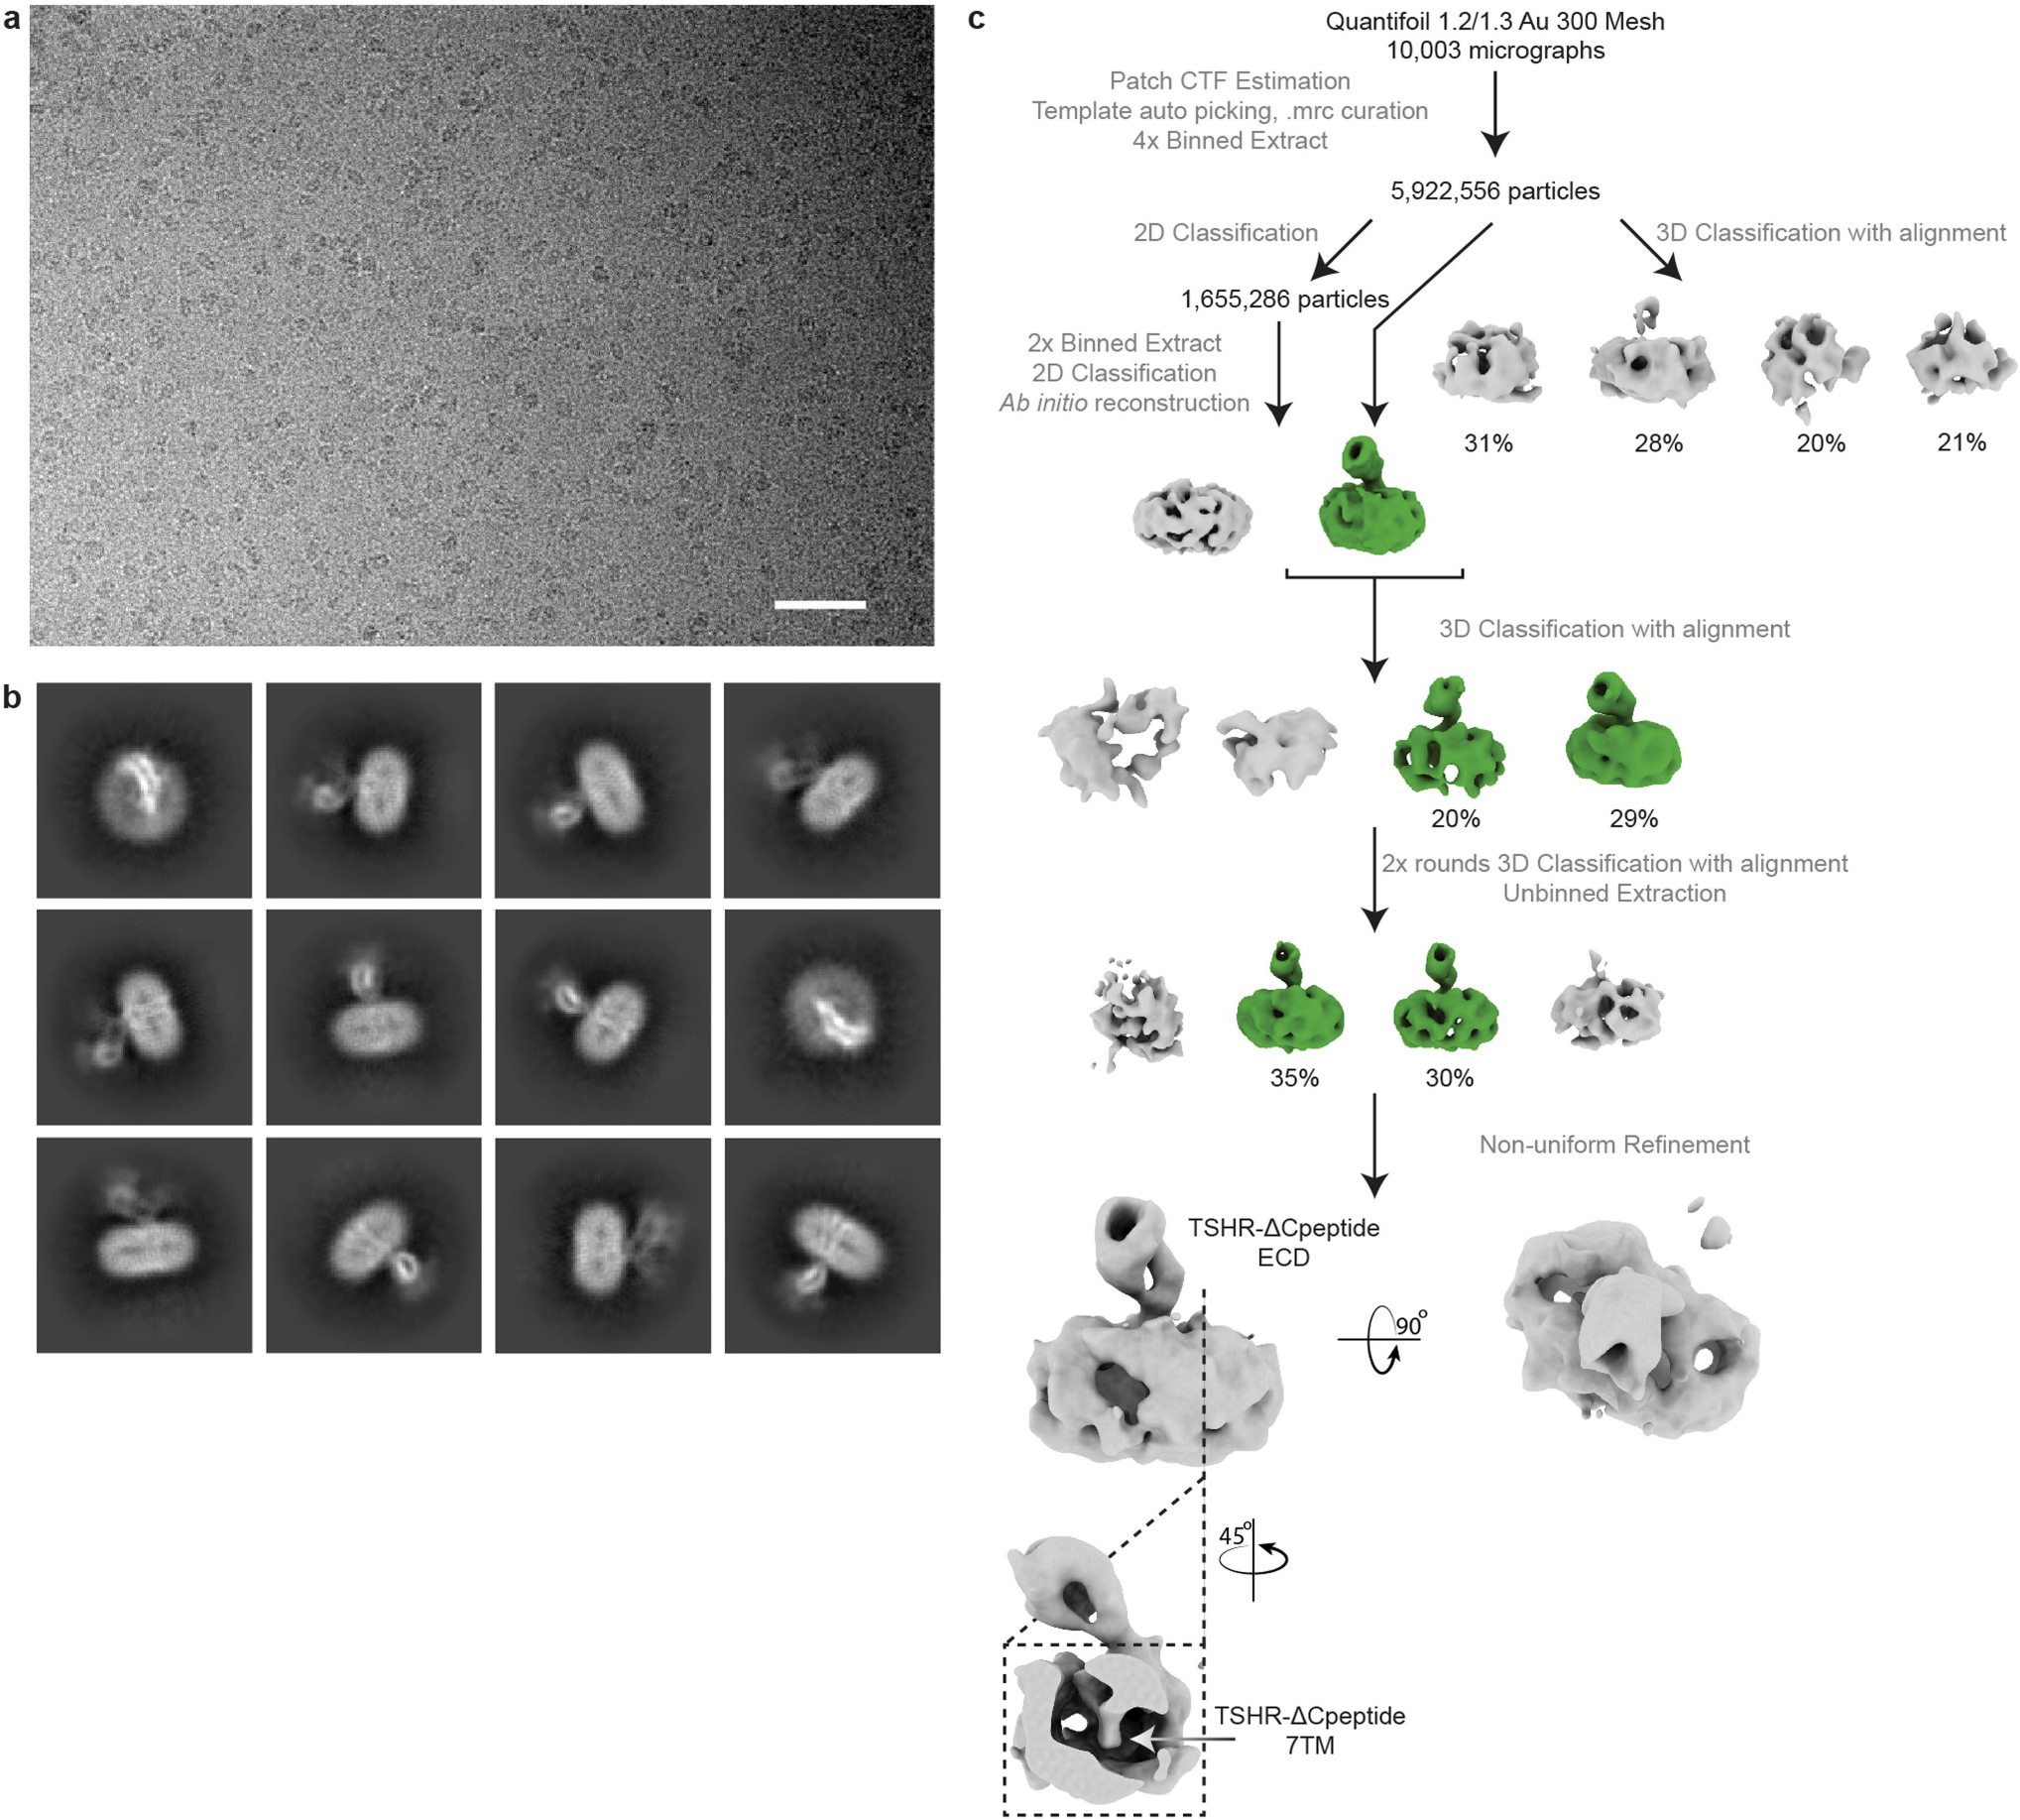
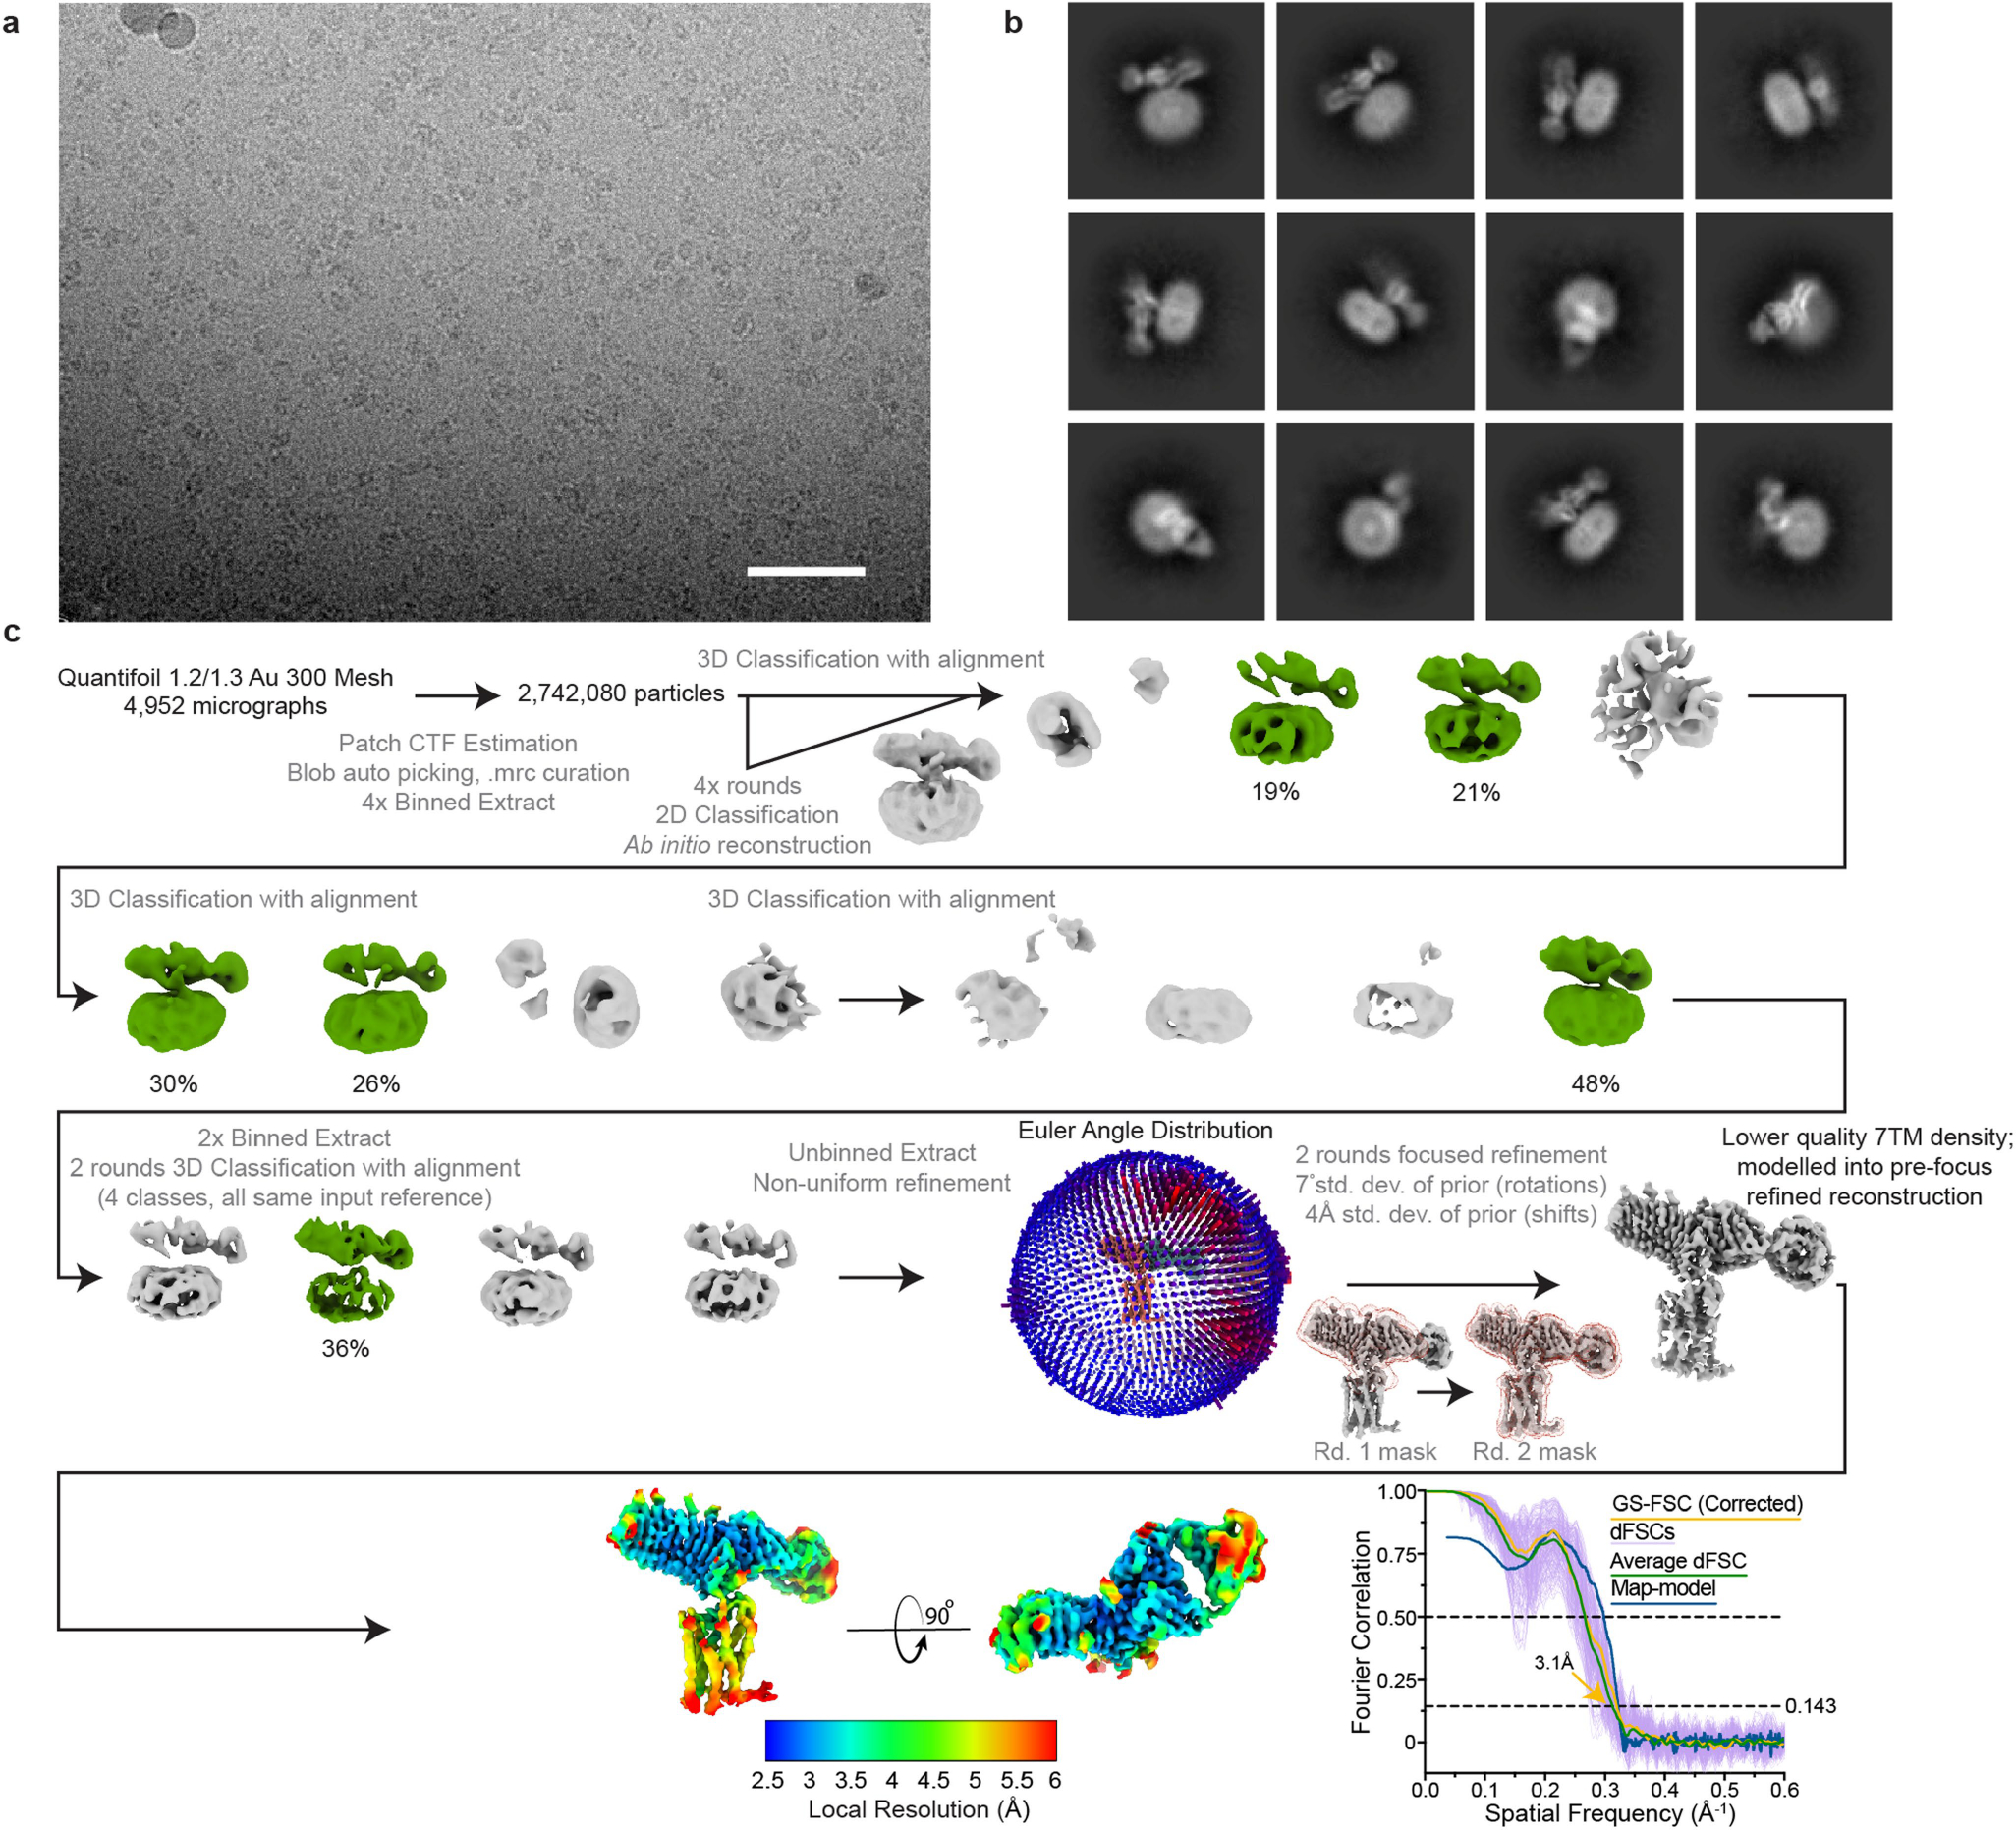
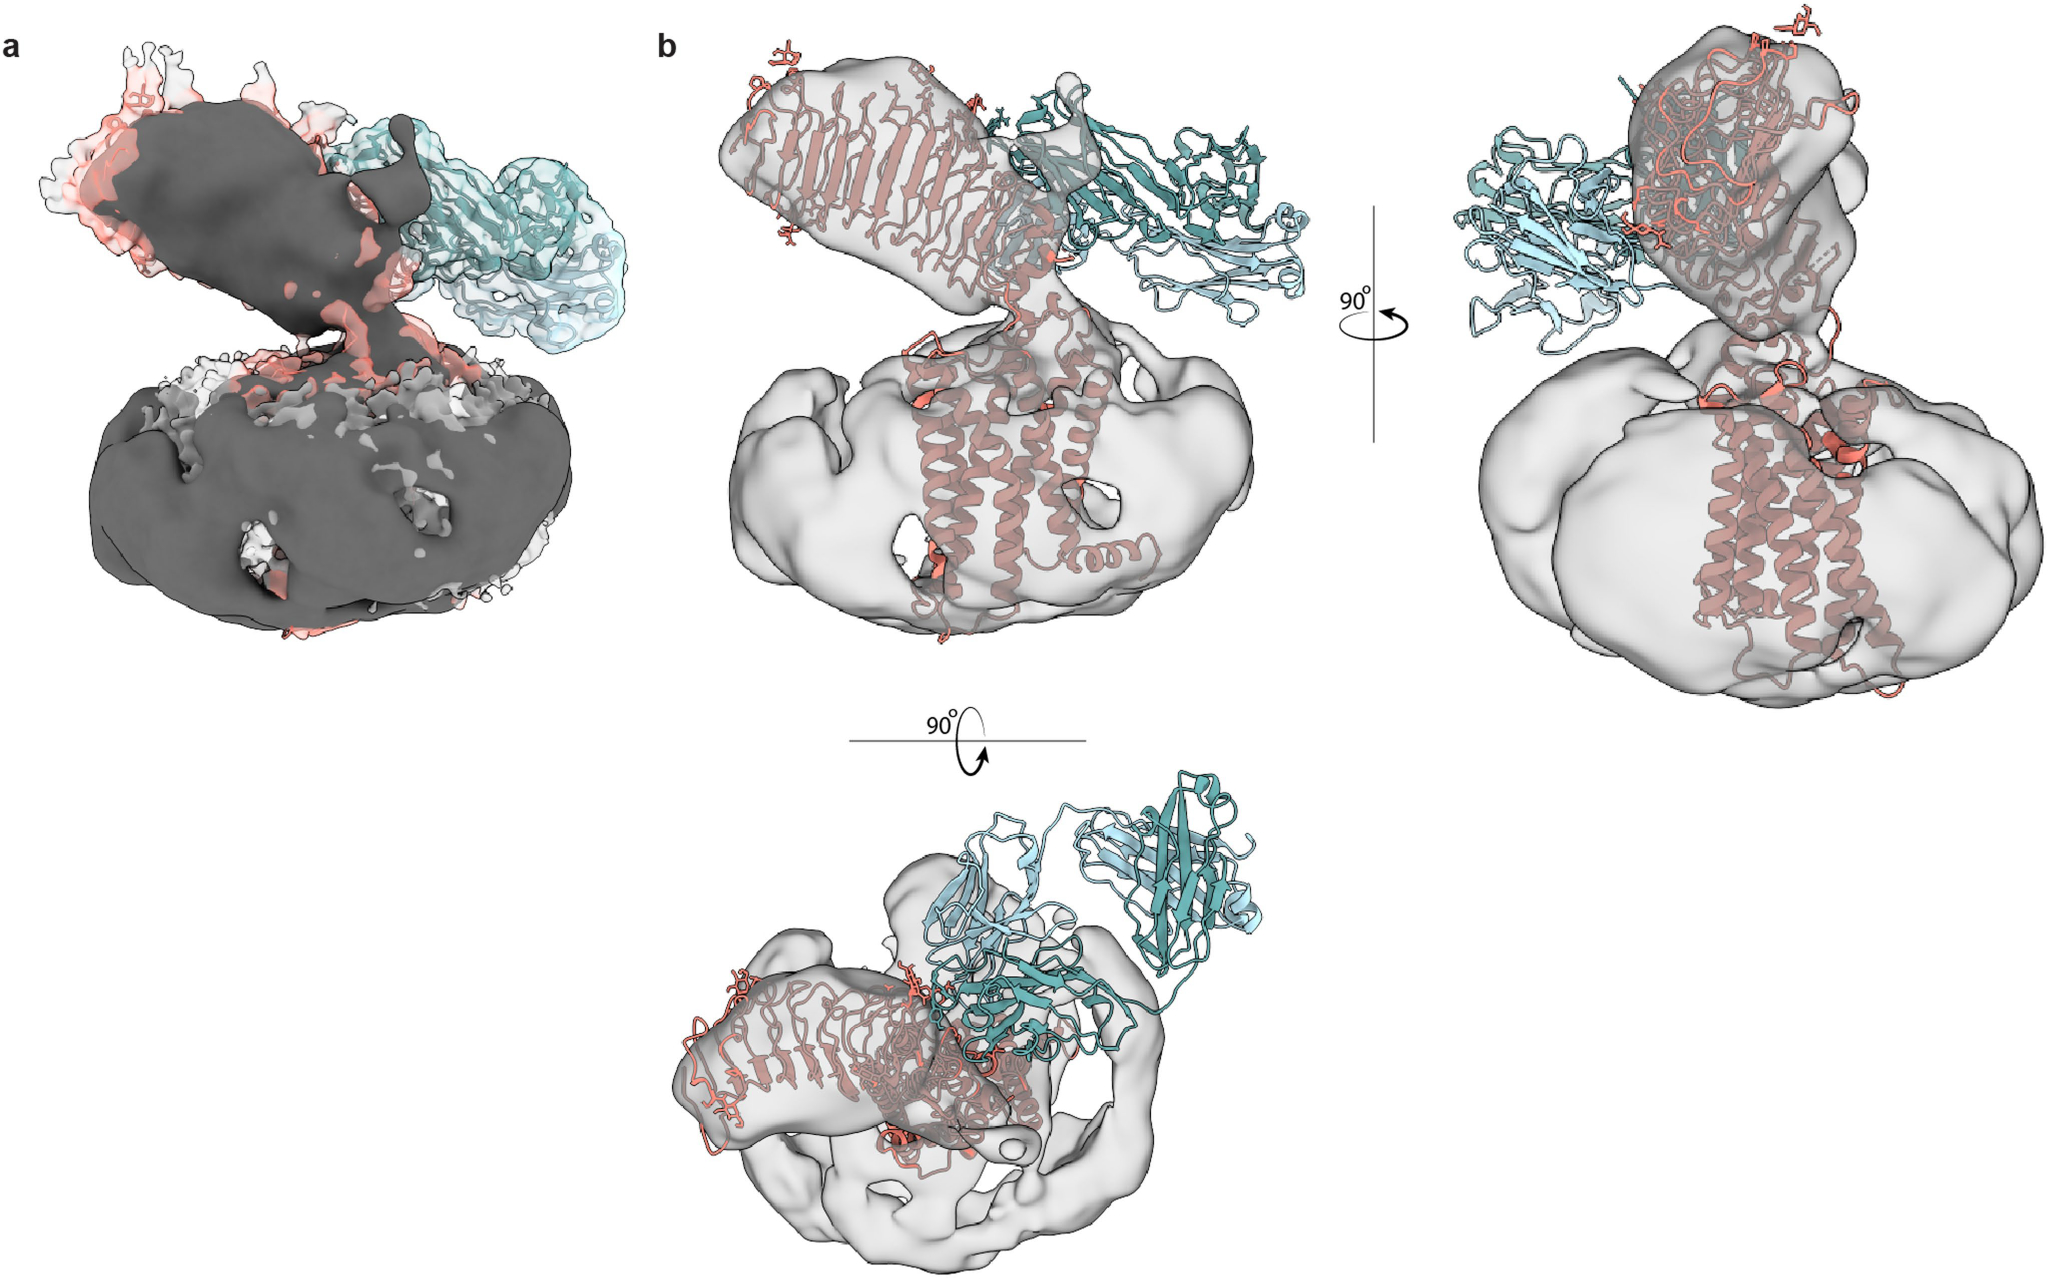
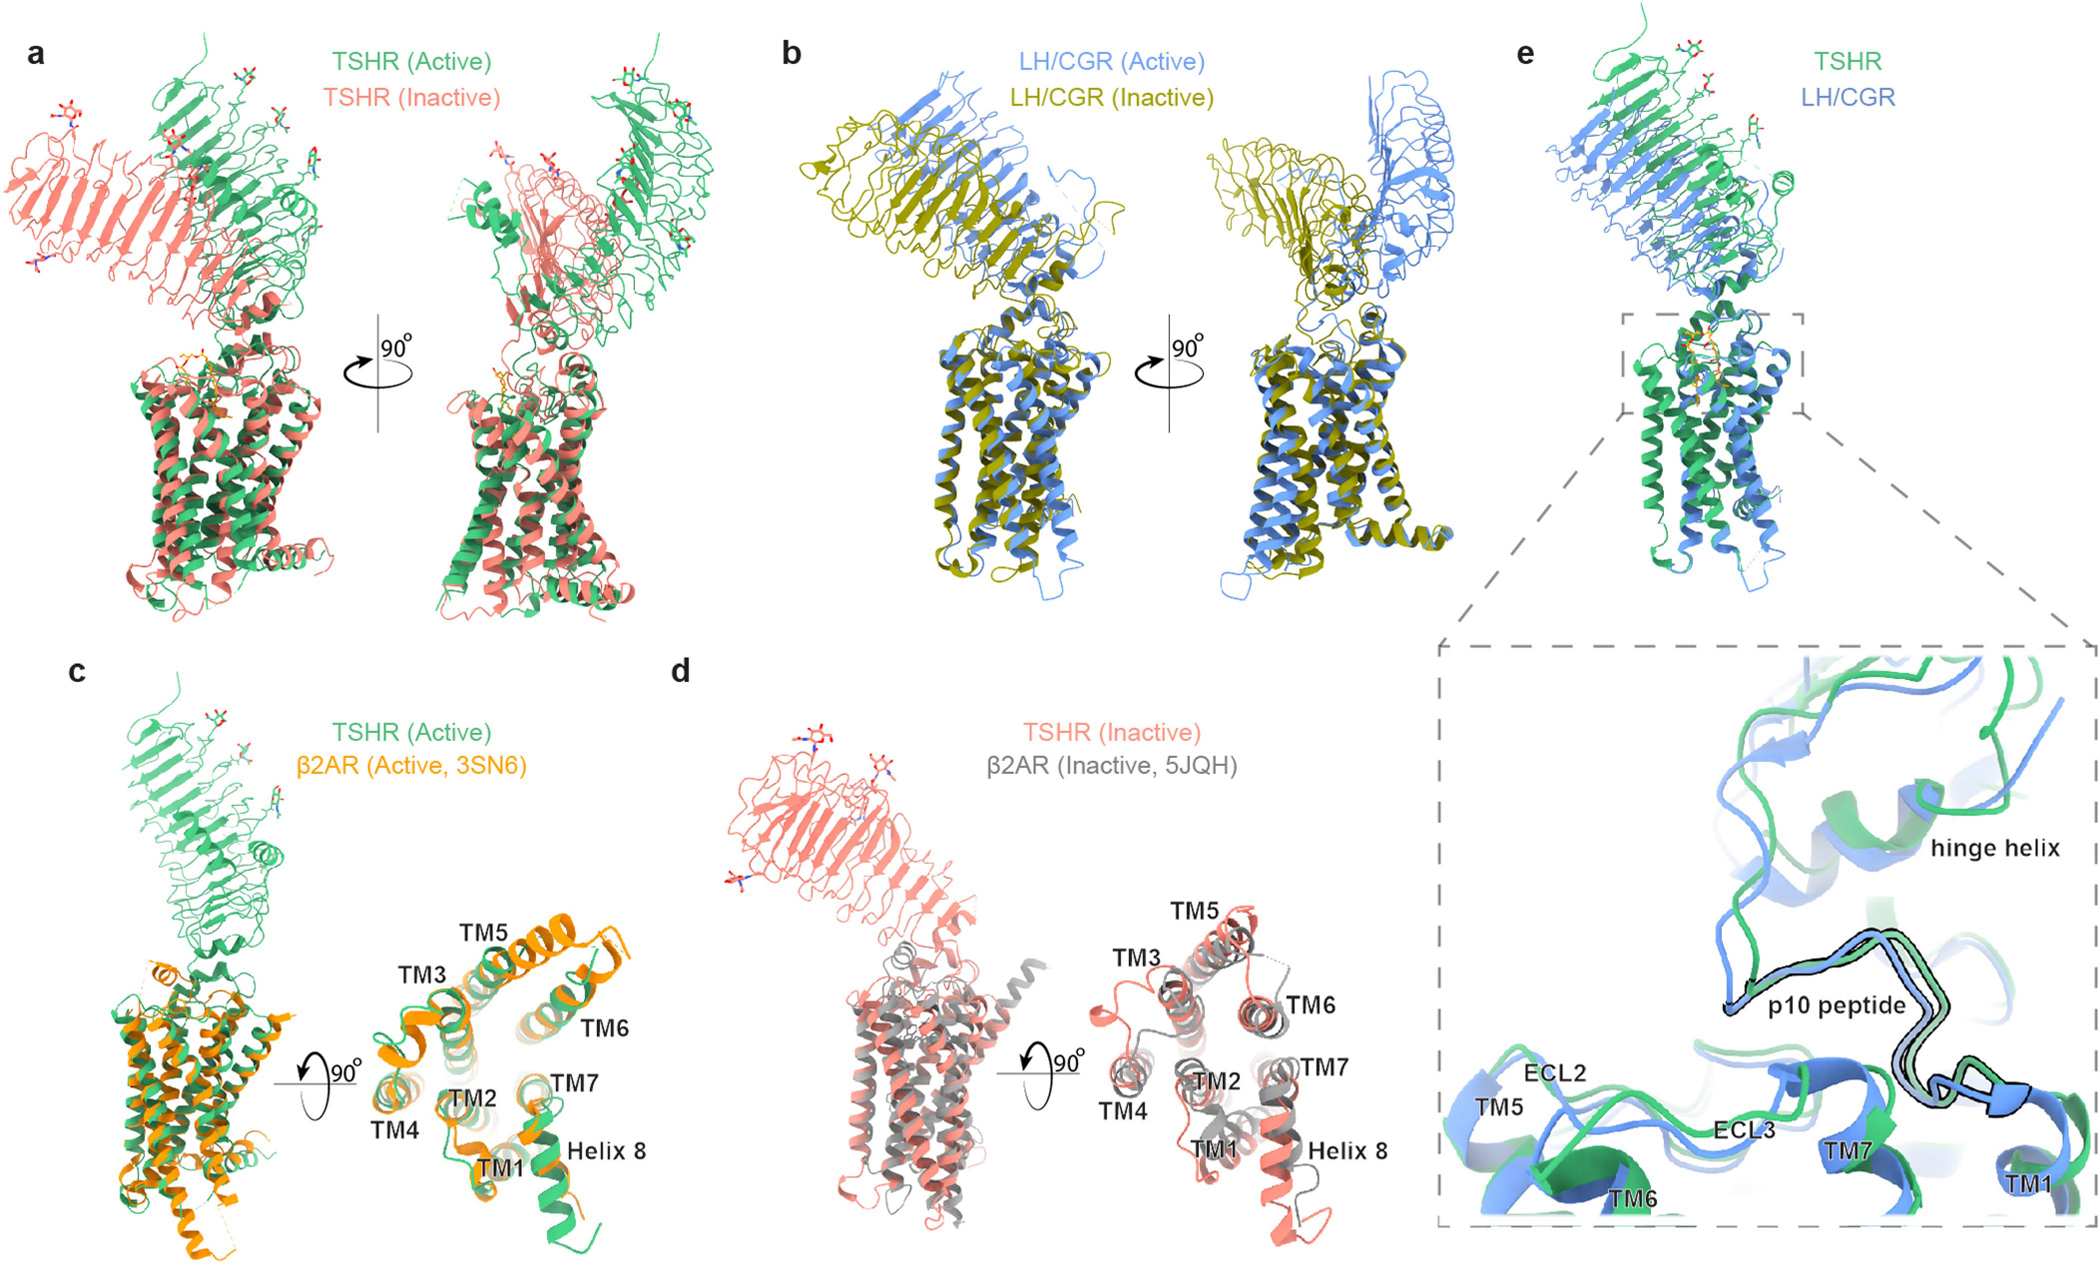
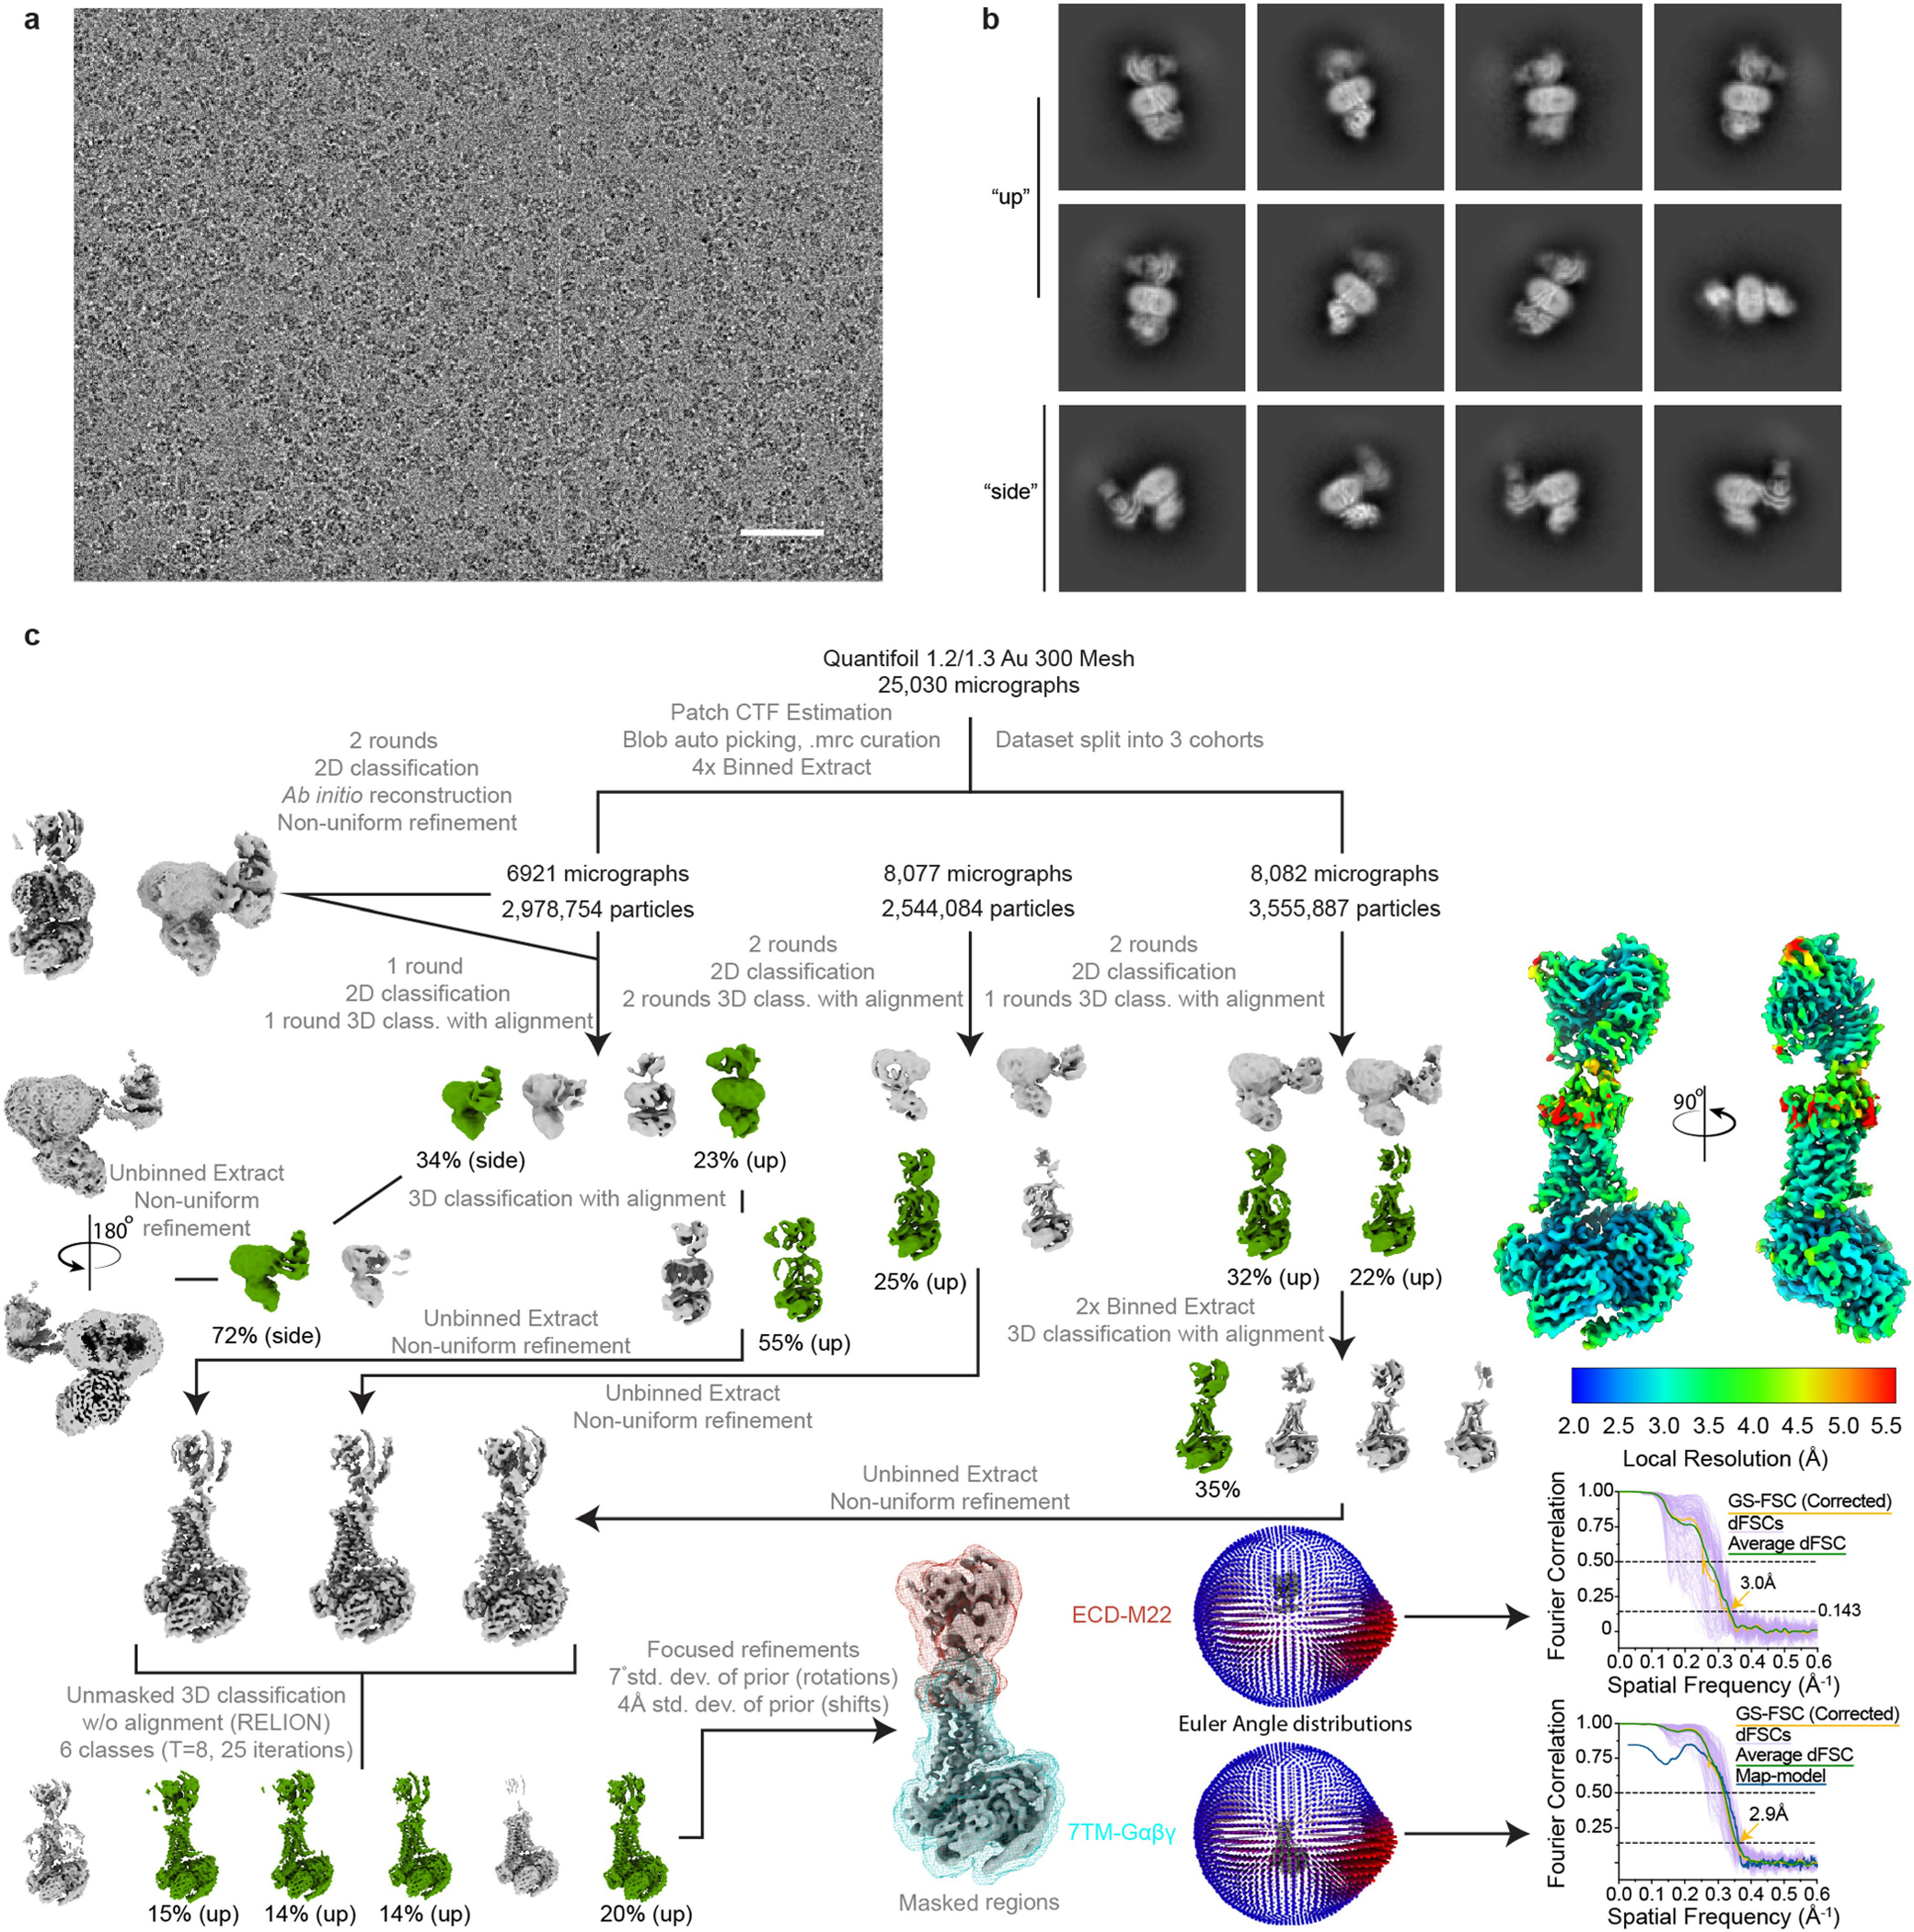
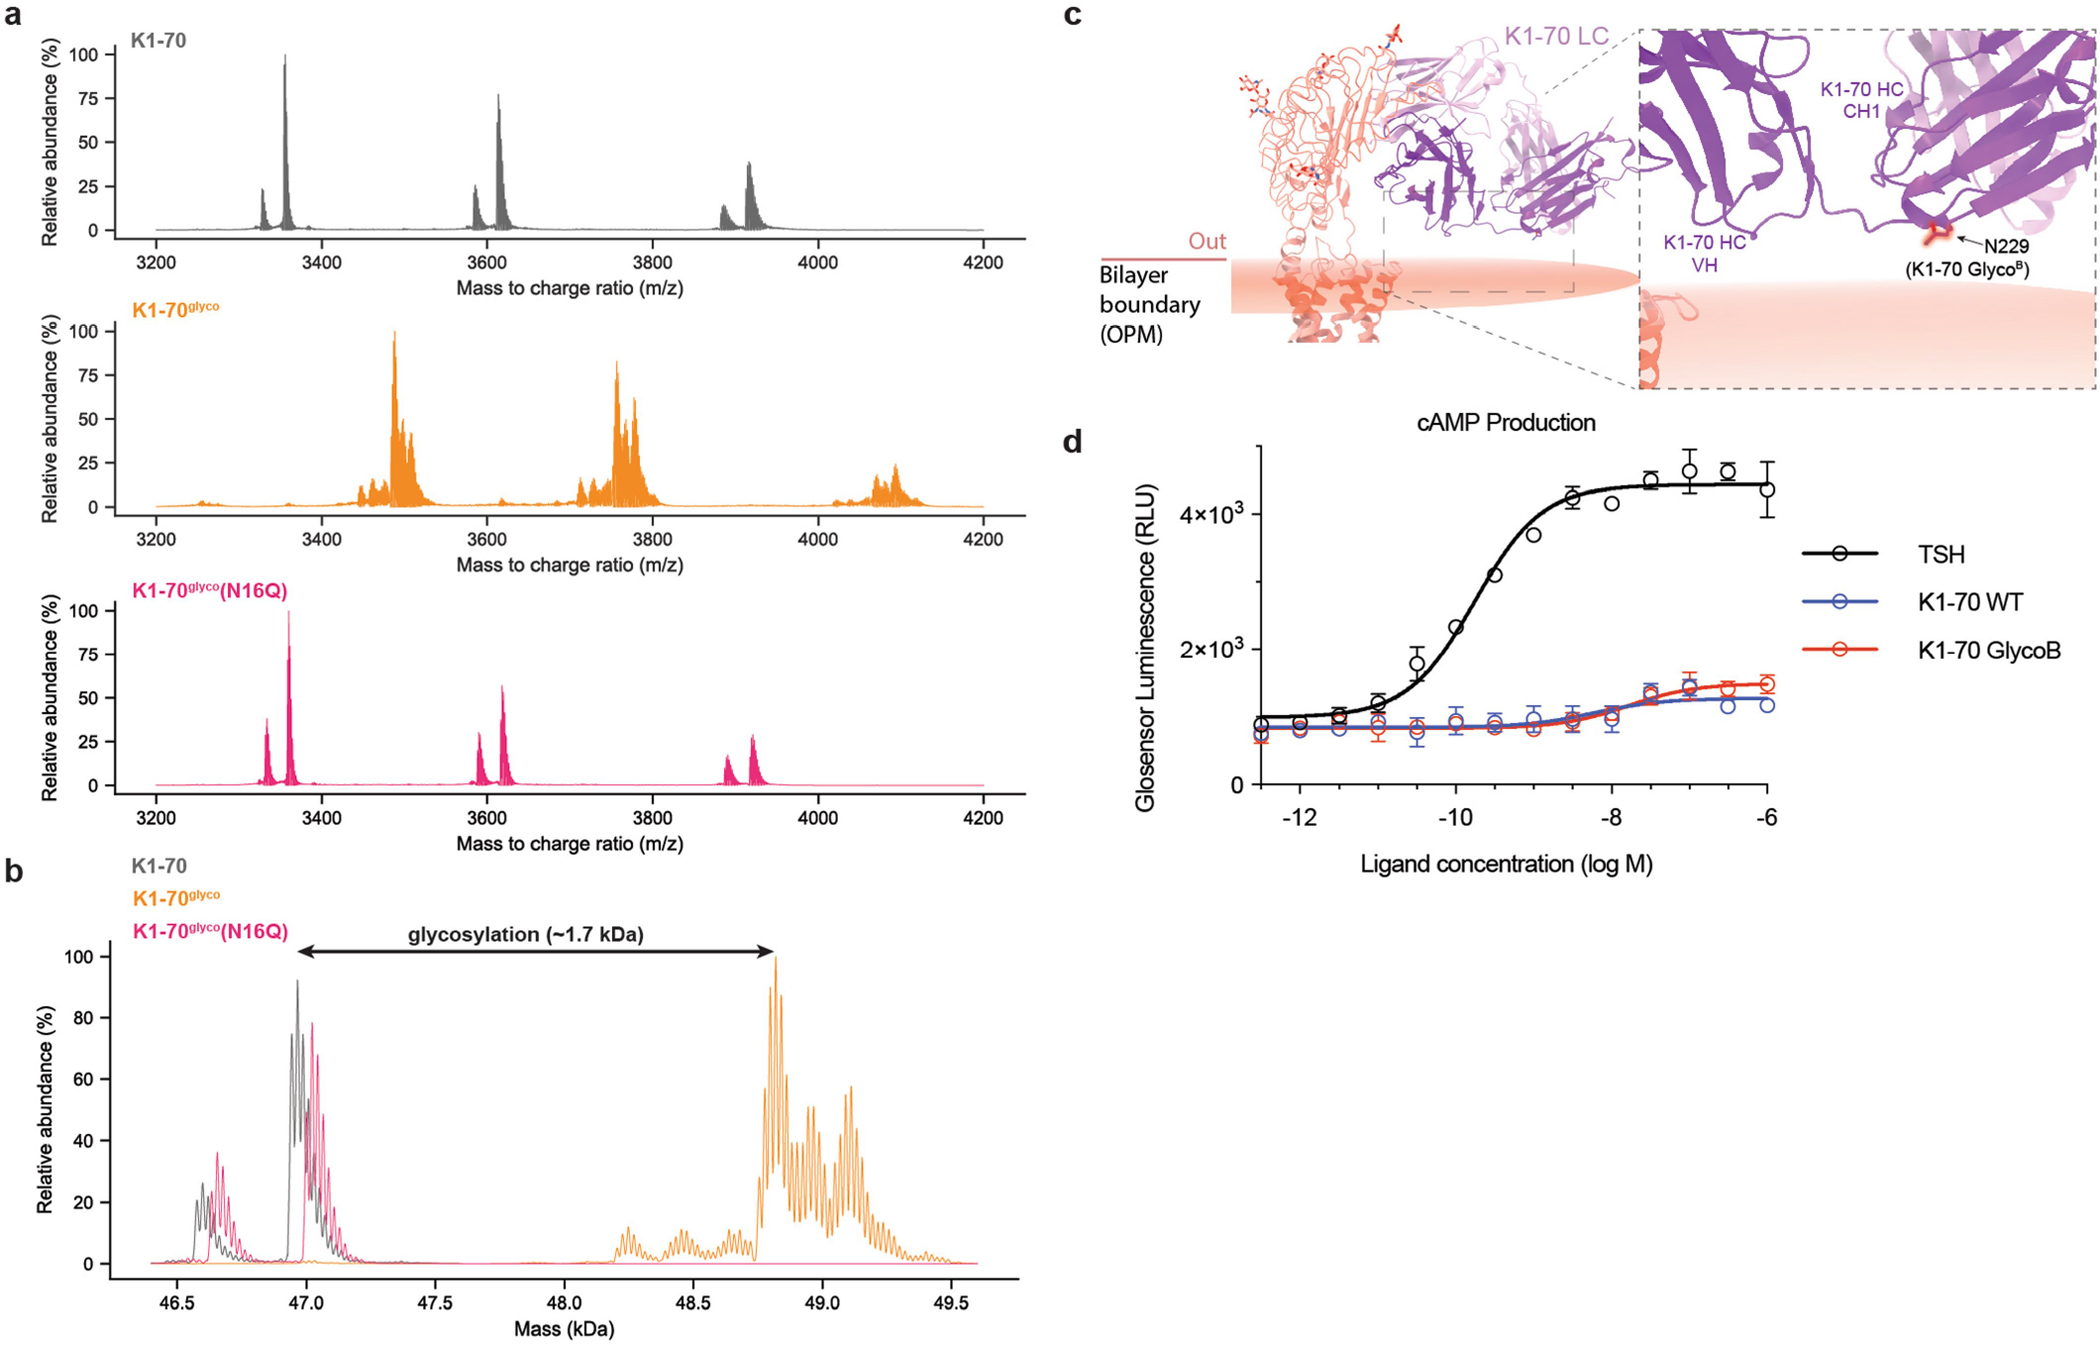
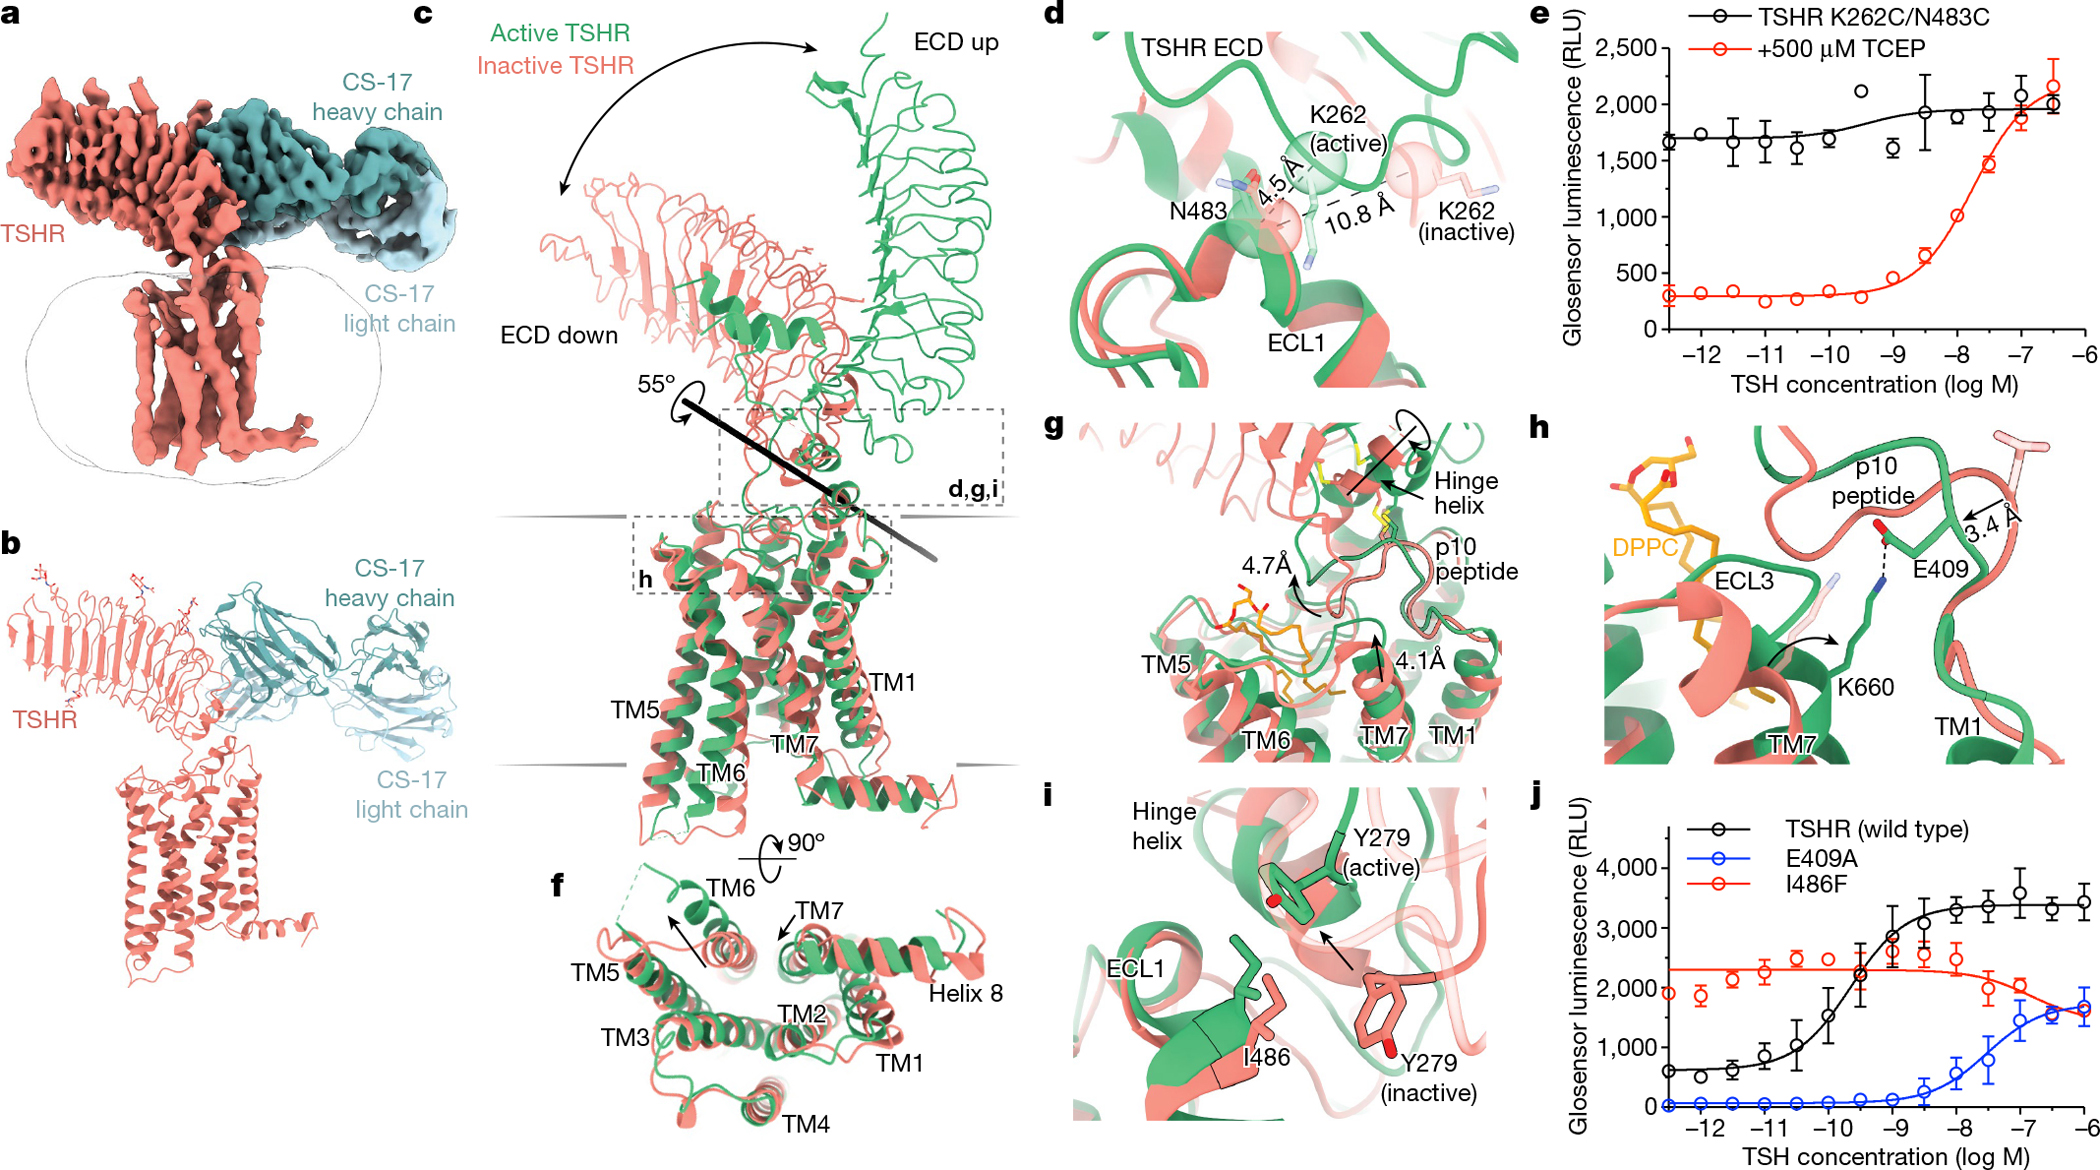
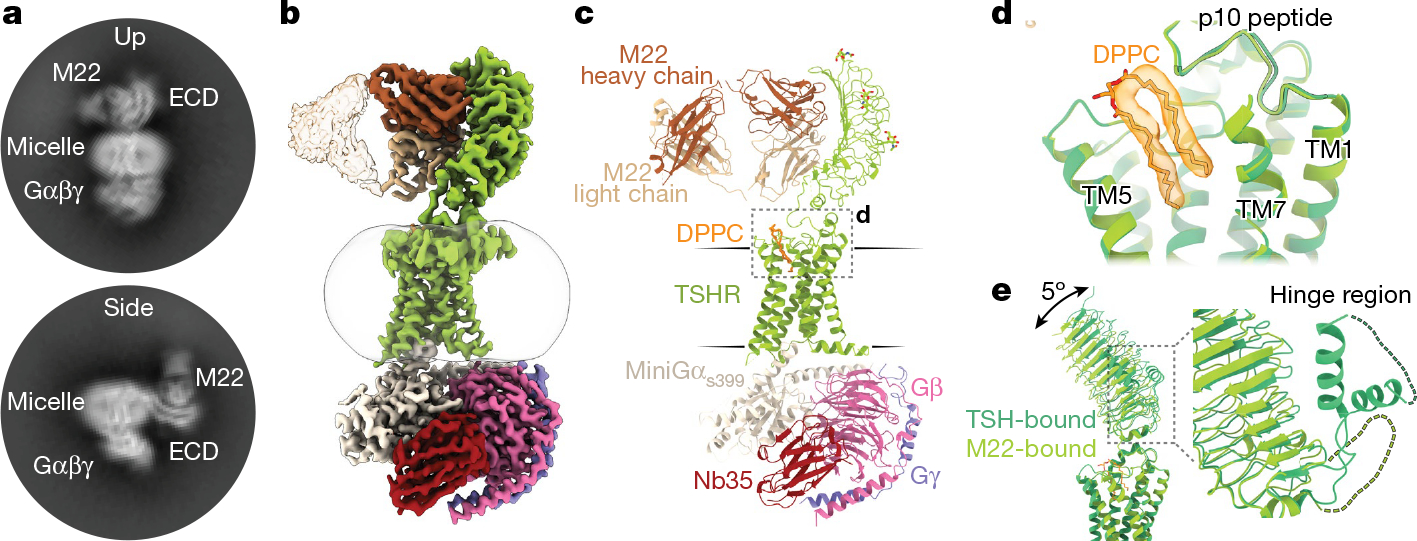
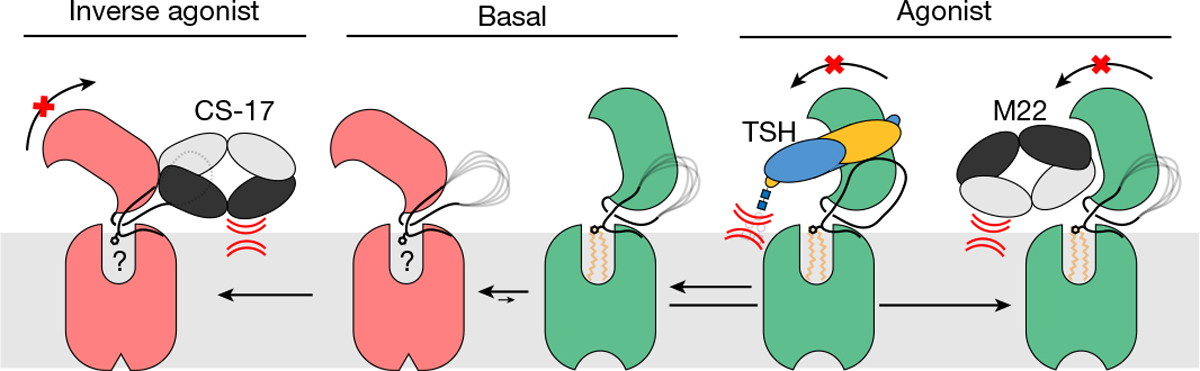
Thyroid hormones are vital in metabolism, growth and development1. Thyroid hormone synthesis is controlled by thyrotropin (TSH), which acts at the thyrotropin receptor (TSHR)2. In patients with Graves' disease, autoantibodies that activate the TSHR pathologically increase thyroid hormone activity3. How autoantibodies mimic thyrotropin function remains unclear. Here we determined cryo-electron microscopy structures of active and inactive TSHR. In inactive TSHR, the extracellular domain lies close to the membrane bilayer. Thyrotropin selects an upright orientation of the extracellular domain owing to steric clashes between a conserved hormone glycan and the membrane bilayer. An activating autoantibody from a patient with Graves' disease selects a similar upright orientation of the extracellular domain. Reorientation of the extracellular domain transduces a conformational change in the seven-transmembrane-segment domain via a conserved hinge domain, a tethered peptide agonist and a phospholipid that binds within the seven-transmembrane-segment domain. Rotation of the TSHR extracellular domain relative to the membrane bilayer is sufficient for receptor activation, revealing a shared mechanism for other glycoprotein hormone receptors that may also extend to other G-protein-coupled receptors with large extracellular domains.


Conflict of interest statement

Competing interests A.M. and R.O.D. are consultants for and stockholders in Septerna Inc. Y.C. is a consultant and advisor of Shuimu BioScience Ltd.

Figures

Extended Data Fig. 1 |
Extended Data Fig. 1 |. Signaling studies for TSHR.
a, b) DNA titrations of TSHR mutants tested in cAMP production assays. Median fluorescence intensity ± SD (n = 3) of anti-FLAG-A647 staining is plotted. Filled in bars represent the DNA concentration used for co-transfection experiments with pGlo cAMP biosensor plasmid. Horizontal red line indicates the mean wild-type (WT) TSHR fluorescence intensity. Flow cytometry experiments were performed in triplicate, with identical gating across all cell lines tested. c) cAMP production of TSHR cysteine mutants comparing the basal level (−) to 100 nM of TSH, M22, or CS-17 for untreated cells (left panel) and cells treated with 500 μM TCEP (right panel). Data points are means ± SD from three biological replicates. d, e) cAMP production curves comparing TSH and M22-mediated activation of WT and C-peptide deleted TSHR constructs. f) cAMP production curves for TSH and TR1402-mediated WT TSHR activation. g) cAMP production curves for TSH-mediated WT and TSHR mutant cell line (Y385F, Y385A) activation. h) cAMP production curves for M22-mediated WT and lipid-displacing TSHR mutant cell line (A644K, A647K) activation. Plotted data points in panels c-g are means of triplicate measurements ± SD from a representative experiment of n = 3 biological replicates.
Extended Data Fig. 2 |
Extended Data Fig. 2 |. Cryo-EM data processing for TSH-bound TSHR-Gs complex.
a) Representative image from 15,345 micrographs. Scale bar, 50 nm. b) Selected 2D class averages. c) Processing approach used for reconstruction of TSH-bound TSHR-Gs complex. A local resolution map was calculated from cryoSPARC using masks from indicated local refinement, then visualized with the composite map in the same scale. A viewing distribution plot was generated using scripts from the pyEM software suite and visualized in ChimeraX. GS-FSC and Directional FSC (dFSC, shown as purple lines) curves were generated in cryoSPARC and as previously described in Dang, S. et al. Nature 552, 426–429 (2017).
Extended Data Fig. 3 |
Extended Data Fig. 3 |. Model map correlation coefficients for cryo-EM structures.
Correlation values for resolved residues in each modeled chain are shown. Low values indicate regions that are poorly resolved, e.g. the 7TM domain of TSHR in CS-17-TSHR complex or the constant domains of the Fab fragments for CS-17 and M22.
Extended Data Fig. 4 |
Extended Data Fig. 4 |. Cryo-EM data processing for TR1402-bound TSHR-Gs complex.
a) Representative image from 14,277 micrographs. Scale bar, 50 nm. b) Selected 2D class averages from final reconstruction. c) Processing approach used for reconstruction of TR1402-bound TSHR-Gs complex. A local resolution map was calculated from cryoSPARC using masks from indicated local refinement, then visualized with the composite map in the same scale. A viewing distribution plot was generated using scripts from the pyEM software suite and visualized in ChimeraX. GS-FSC and dFSC curves were generated in cryoSPARC and as previously described in Dang, S. et al. Nature 552, 426–429 (2017).
Extended Data Fig. 5 |
Extended Data Fig. 5 |. Glycosylation status of native human TSH.
a) Cryo-EM density map of TSH-bound TSHR showing resolved glycan density for Asn52. b) Peptide coverage of Asn52 from native human TSH GPHα chain in mass spectrometry experiments. c) Peptide spectra match (PSM) of glycans detected on Asn52 of GPHα chain. d,e) Representative MS/MS spectra showing Asn52 with various length glycans.
Extended Data Fig. 6 |
Extended Data Fig. 6 |. Receptor:hormone interaction comparisons across the glycoprotein hormone receptor family.
a) Comparison of TSHR, FSHR (PDB: 4AY9), and LH/CGR ECD:hormone (PDB: 7FIH) interactions shows the comparable concave binding-interface and lateral-ECD contacts made by GPHα and receptor-specific β subunits. b) Alignment of the GPHR ECDs reveals the variability in modeled poses of hinge-hormone contacts observed in prior GPHR:hormone structures. c) The N-terminal hinge-hormone disulfide-linked alpha helix presents a hydrophobic face to the α-L1 and α-L3 loops of the TR1402 α-chain and is stabilized by multiple phenylalanine contacts in the GPHα and TSHβ chains. C-terminal hinge-region α helix hidden for visualization. d) Comparison of the TSHR and LHCGR (PDB: 7FIH) transmembrane pockets highlights the similarity in the DPPC and the allosteric agonist Org43554 binding sites. TM4/5 and ECL2 not shown. e) Lipid:protein molar ratio comparison between the M22:TSHR:Gs complex and a non-GPHR Class A receptor control. Data points represent individual measurements from technical replicates (n = 3 for non-GPHR control and n = 4 for M22:TSHR:Gs complex) of the ratio of pmol of lipid DPPC per pmol of protein. **P = 0.0088; Unpaired two-tailed t test was used to calculate statistical differences in lipid:protein molar ratios.
Extended Data Fig. 7 |
Extended Data Fig. 7 |. Cryo-EM data processing for Org 274179-0 bound TSHR.
a) Representative image from 10,003 micrographs. Scale bar, 50 nm. b) Selected 2D class averages generated from curated particles. c) Processing approach used for low resolution reconstruction. Despite starting with a similar or larger sized dataset as for other TSHR samples, the TSHR–Org 274179-0 complex did not yield high resolution reconstruction of the 7TM domain. A low-resolution reconstruction of the TSHR ECD was observed. This suggests potential flexibility between the TSHR 7TM domain and the ECD.
Extended Data Fig. 8 |
Extended Data Fig. 8 |. Cryo EM data processing for the CS-17 bound TSHR:Org 274179-0 complex.
a) Representative image from 4,952 micrographs. Scale bar, 50 nm. b) Selected 2D class averages generated from the final reconstruction. c) Processing approach used for reconstruction of the complex. A viewing distribution plot was generated using scripts from the pyEM software suite and visualized in ChimeraX. Local resolution map generated from non-uniform refinement mask in cryoSPARC. GS-FSC and dFSC curves were generated in cryoSPARC and as previously described in Dang, S. et al. Nature 552, 426–429 (2017).
Extended Data Fig. 9 |
Extended Data Fig. 9 |. Comparison of Org 274179-0 bound- and CS-17 bound TSHR EM maps.
a) Org 274179-0 bound-TSHR EM density map (dark) fit into the CS-17-bound TSHR map (colored by TSHR-CS-17 model). b) CS-17-bound TSHR model fit into Org 274179-0 bound-TSHR map, suggesting that inactive state TSHR ECD orientations are similar between CS-17 and Org 274179-0-bound states.
Extended Data Fig. 10 |
Extended Data Fig. 10 |. Comparison of TSHR activation with other GPCRs.
a) Ribbon diagram of TSHR in active and inactive conformations. b) Ribbon diagram of LH/CGR in active (PDB:7FIH) and inactive (PDB:7FIJ) conformations. A similar reorientation of the ECD is shared between TSHR and LH/CGR upon activation. c) Comparison of active TSHR to active β2-adrenoceptor (β2AR, PDB:3SN6). d) Comparison of inactive TSHR to inactive β2AR, PDB:5JQH). e) Comparison of active conformations of TSHR and LH/CGR reveals similar overall structures of the 7TM domain and the p10 peptide.
Extended Data Fig. 11 |
Extended Data Fig. 11 |. Cryo-EM data processing for M22-bound TSHR-Gs complex.
a) Representative image from 25,030 micrographs. Scale bar, 50 nm. b) Selected 2D class averages from final reconstruction. c) Processing approach used for reconstruction of M22-bound TSHR-Gs complex. A local resolution map was calculated from cryoSPARC using masks from indicated local refinement, then visualized with the composite map in the same scale. A viewing distribution plot was generated using scripts from the pyEM software suite and visualized in ChimeraX. GS-FSC and dFSC curves were generated in cryoSPARC and as previously described in Dang, S. et al. Nature 552, 426–j429 (2017).
Extended Data Fig. 12 |
Extended Data Fig. 12 |. Extent of ECD activation for all individual simulations across four simulation conditions.
Dashed lines indicate the projection metric values (see Methods) in the inactive (0.0 Å) and active (33.5 Å) state cryo-EM structures. Thick traces indicate the moving average smoothed over a 25-ns window, and thin traces represent unsmoothed data. Each column represents a distinct simulation condition: started from the active structure, with M22 bound (brown traces, first column); started from the active structure, with M22 removed (grey traces, second column); started from the inactive structure, with CS-17 bound (blue traces, third column); started from the inactive structure, with CS-17 removed (grey traces, fourth column).
Extended Data Fig. 13 |
Extended Data Fig. 13 |. Glycosylation of engineered K1-70glyco construct.
a) Native mass spectrum (nMS) of K1-70, K1-70glyco, and K1-70glyco(N16Q) Fab fragments. b) Accurate mass assignment of Fab fragments. nMS demonstrates ~1.7 kDa increased mass for K1-70glyco and more heterogeneity consistent with N-linked glycosylation. The smaller mass and increased homogeneity of the K1-70glyco(N16Q) construct further supports glycosylation at the engineered N16 position. c) Crystal structure of K1-70 TSHR-ECD complex (PDB: 2XWT) aligned to CS-17 bound TSHR. The membrane-proximal N229 residue (of the “GlycoB” glycosylation motif) is highlighted in red. d) cAMP production comparing K1-70 WT, K1-70 GlycoB and M22 Fab fragment-mediated activation of TSHR. Plotted data points are means of triplicate measurements ± SD from one of three biological replicates.
Fig. 1|
Fig. 1|. Cryo-EM structures of native human TSH and TR1402 bound to active TSHR complexed with heterotrimeric Gs
a,b, Cryo-EM maps of the TSHR–Gs–Nb35 complex bound to TSH (a) and TR1402 superagonist (b). TR1402 and TSH bind to the ECD of TSHR. c, Model of TR1402 bound to TSHR. Resolved N-linked glycans are highlighted for both TR1402 and TSHR. NAG, N-acetylglucosamine. d, The disulfide-linked α-helices of the TSHR hinge are outlined in black. d,e, TSHβ R34 and TR1402α R16 coordinate D382 and D386, respectively, in the TSHR hinge region (d), which positions Y385 into a hydrophobic pocket at the interface of hormone α and β chains (e). f, Sequences of TSH, FSH and the CG seatbelt loop regions between the 10th and 12th cysteine residues in the hormone-specific β chains. The seatbelt loop is further divided into regions I and II by a conserved aspartate (D94 in TSHR). Net charges in region I differ between the glycoprotein hormones. Region II of the seatbelt loop is conformationally divergent among the glycoprotein hormones. g,h, Close-up views of selectivity determinants in region I (g) and region II (h), as indicated in f. i, Cryo-EM density for the lipid dipalmitoylphosphatidylcholine (DPPC) in the TSHR transmembrane pocket. A644 and A647 side chains (highlighted in red) line the lipid binding pocket. j, cAMP production assay for mutations in the lipid binding site. Data are mean ± s.d. of triplicate measurements from a representative experiment of n = 3 biological replicates.
Fig. 2|
Fig. 2|. The activation mechanism of the TSHR revealed by the inactive structure bound to the inverse agonist CS-17.
a,b, Cryo-EM map (a) and model (b) of inactive TSHR bound to the CS-17 Fab. c, Structural comparison of inactive and active TSHR with the 7TM domain aligned. In inactive TSHR, the ECD is in a down orientation close to the membrane bilayer. In active TSHR, the ECD is in an up orientation. The ECD rotates 55° along an axis, as calculated by Dyndom3D. d, Disulfide trapping of the active TSHR ECD conformation using a K262C/N483C mutant TSHR. The Cα distance between positions 262 and 483 (indicated in parentheses) would only enable a disulfide bond when the ECD is in the active, up conformation but not in the inactive, down conformation. e, The K262C/N483C TSHR mutant is more constitutively active than wild-type TSHR (see Extended Data Fig. 1). Addition of 500 μM TCEP reduces basal activity of the K262C/N483C disulfide-locked construct. f, In the active state, TM6 of TSHR moves outward by 14 Å, and TM7 moves inward by 4 Å. g, Upon activation, rotation of the ECD leads to a rotation of the hinge helix, an extracellular displacement of the p10 peptide and an inward movement of the extracellular tip of TM7. h, E409 in the p10 peptide interacts with K660 in TM7 in active TSHR. Inactive-state side chains (transparent) are not resolved but the peptide backbone suggests that the E409–K660 interaction is not maintained. i, Y279 traverses approximately 6 Å across the ECL1–hinge helix interface directly over I486. j, Disruption of p10–TM7 interactions (E409A) and perturbation of the ECL1–hinge helix interface (I486F) affect TSH-mediated receptor activation and basal activity, respectively. Data are mean ± s.d. of triplicate measurements from a representative experiment of n = 3 biological replicates.
Fig. 3|
Fig. 3|. Activation of the TSHR by a Graves’ disease autoantibody.
a, Selected 2D class averages of the up and side orientations of the TSHR ECD for TSHR bound to M22. b,c, Cryo-EM map (b) and model (c) of the M22 Fab–TSHR–Gs–Nb35 complex. d, DPPC (orange) is modelled into the density present in the TSHR transmembrane pocket. TM6 and ECL3 are hidden for clarity. e, Alignment of TSHR 7TM domain between TSH and M22-bound models reveals minimal (around 5°) change in the orientation of the ECD. The TSHR α-helical hinge region is not resolved in the M22-bound receptor complex.
Fig. 4|
Fig. 4|. Membrane bilayer interactions are critical for TSHR activation.
a, Orientation of active and inactive TSHR in a mammalian plasma membrane bilayer as defined by the Orientations of Proteins in Membranes (OPM) server. b, Modelling of autoantibody agonist M22 binding to inactive TSHR with the ECD in the down orientation shows the expected clashes between the M22 light chain, the TSHR 7TM domain and the outer membrane bilayer. c, Modelling of binding of the inverse-agonist CS-17 onto active TSHR shows the expected clashes between the CS-17 constant domains and the membrane bilayer. d,e, In simulations with no antibodies present (grey traces), the TSHR ECD fluctuates between ECD up (active) and ECD down (inactive) orientations, regardless of the starting structure. M22 constrains the ECD to an ECD up orientation (brown trace), and CS-17 constrains the ECD to a down (inactive) orientation (blue trace). The ECD orientation is quantified using a projection metric as outlined in Methods. Thick traces represent smoothed values with an averaging window of 25 ns; thin traces represent unsmoothed values. Black dashed horizontal lines represent ECD orientations in cryo-EM structures. f, Modelling of TSH binding to inactive TSHR with the ECD in the down orientation. The membrane-proximal Asn52 glycan is highlighted. g, Modelling of K1-70 to inactive-state TSHR. K1-70 is compatible with binding to inactive-state TSHR. The location of an engineered membrane-proximal glycosylation site (K1-70 Q16N) and the distance to the OPM-determined static membrane plane are indicated. h, An engineered version of K1-70 with N-linked glycosylation at residue 16 (K1-70glyco) is more potent and efficacious at cAMP production than K1-70. Data are mean ± s.d. of triplicate measurements from a representative experiment of n = 3 biological replicates.
Fig. 5|
Fig. 5|. Model for TSHR activity.
In the basal state, the TSHR ECD can spontaneously transition to the up state, leading to constitutive activity. TSH stabilizes an upright ECD because steric clashes between the GPHα N52 glycan and the membrane bilayer prevent conversion of the ECD to the down state. Agonistic autoantibodies such as M22 activate TSHR in a similar manner by preventing the ECD down state. Conversely, inverse agonistic antibodies such as CS-17 prevent the ECD from assuming the up state, thereby locking TSHR in an inactive orientation.

References

    1. Oppenheimer JH & Samuels HH Molecular Basis of Thyroid Hormone Action (Academic Press, 1983).
    1. Vassart G & Dumont JE The thyrotropin receptor and the regulation of thyrocyte function and growth. Endocr. Rev. 13, 596–611 (1992). - PubMed
    1. Smith TJ & Hegedüs L Graves’ disease. N. Engl. J. Med. 375, 1552–1565 (2016). - PubMed
    1. Fekete C & Lechan RM Central regulation of hypothalamic–pituitary–thyroid axis under physiological and pathophysiological conditions. Endocr. Rev. 35, 159–194 (2014). - PMC - PubMed
    1. Laurent E, Mockel J, Van Sande J, Graff I & Dumont JE Dual activation by thyrotropin of the phospholipase C and cyclic AMP cascades in human thyroid. Mol. Cell. Endocrinol. 52, 273–278 (1987). - PubMed

MeSH terms