

Causal Inference of Body Ownership in the Posterior Parietal Cortex
- PMID: 35940875
- PMCID: PMC9480881
- DOI: 10.1523/JNEUROSCI.0656-22.2022
Causal Inference of Body Ownership in the Posterior Parietal Cortex
Abstract
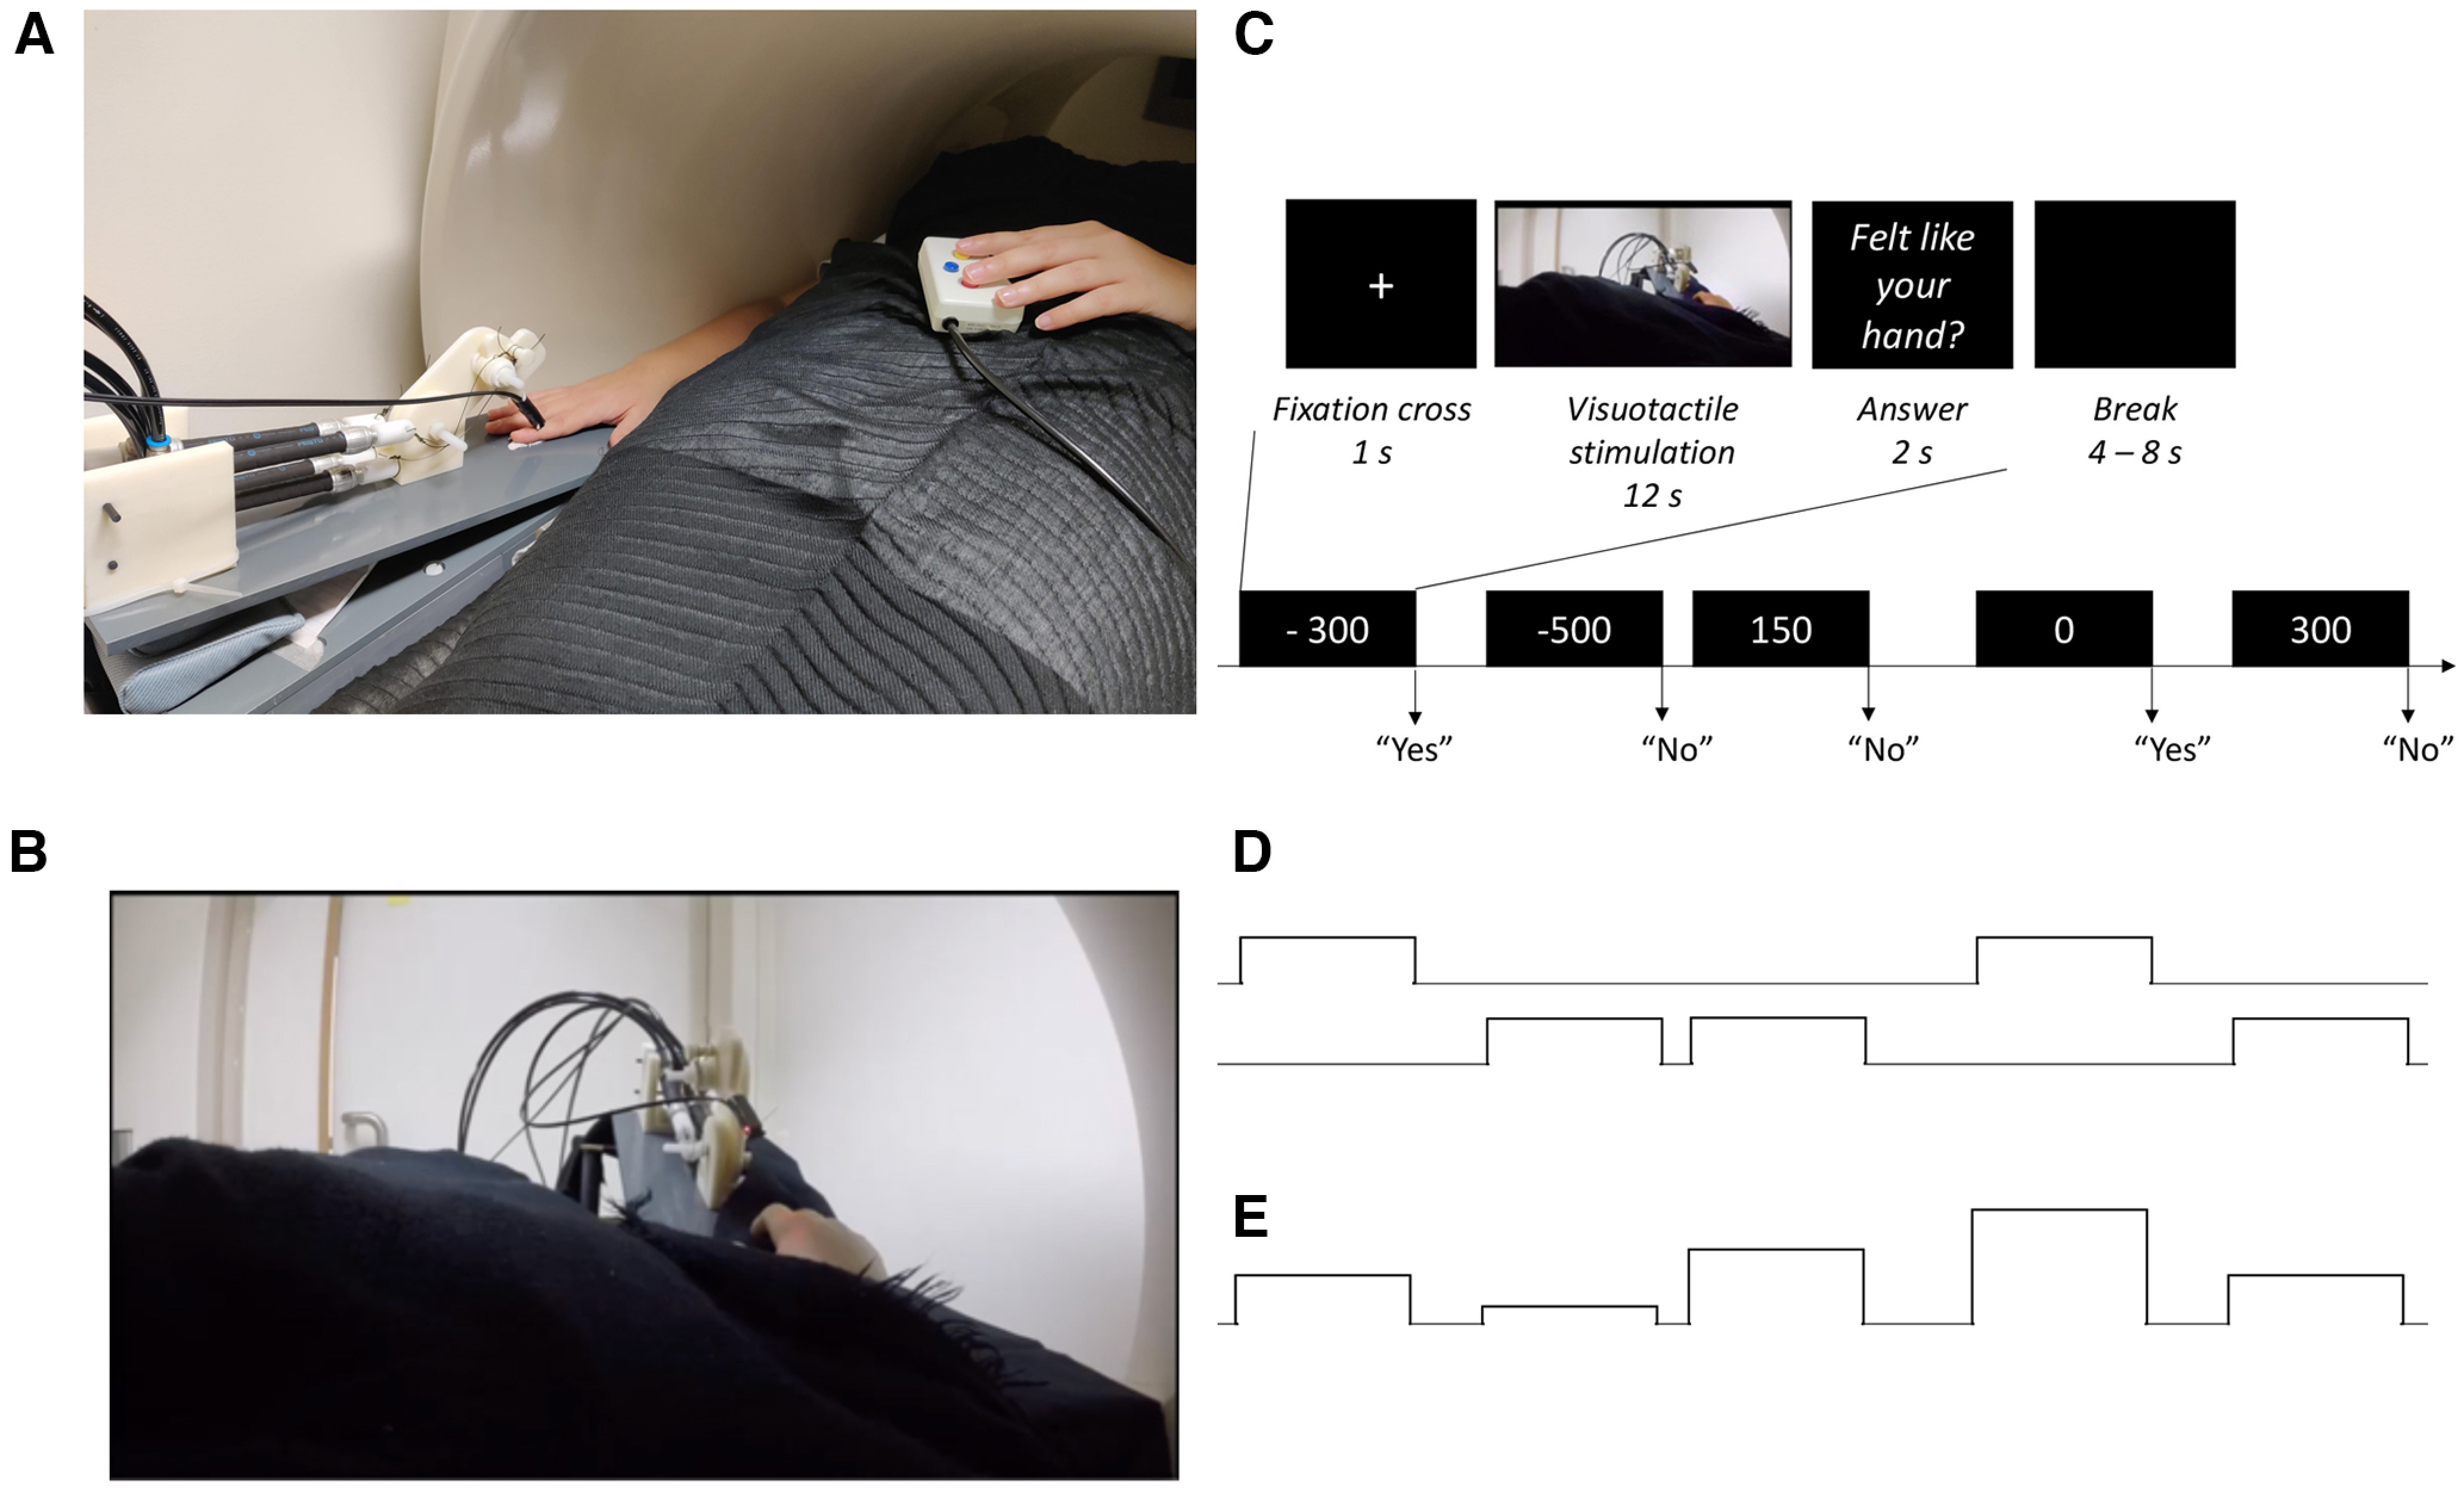
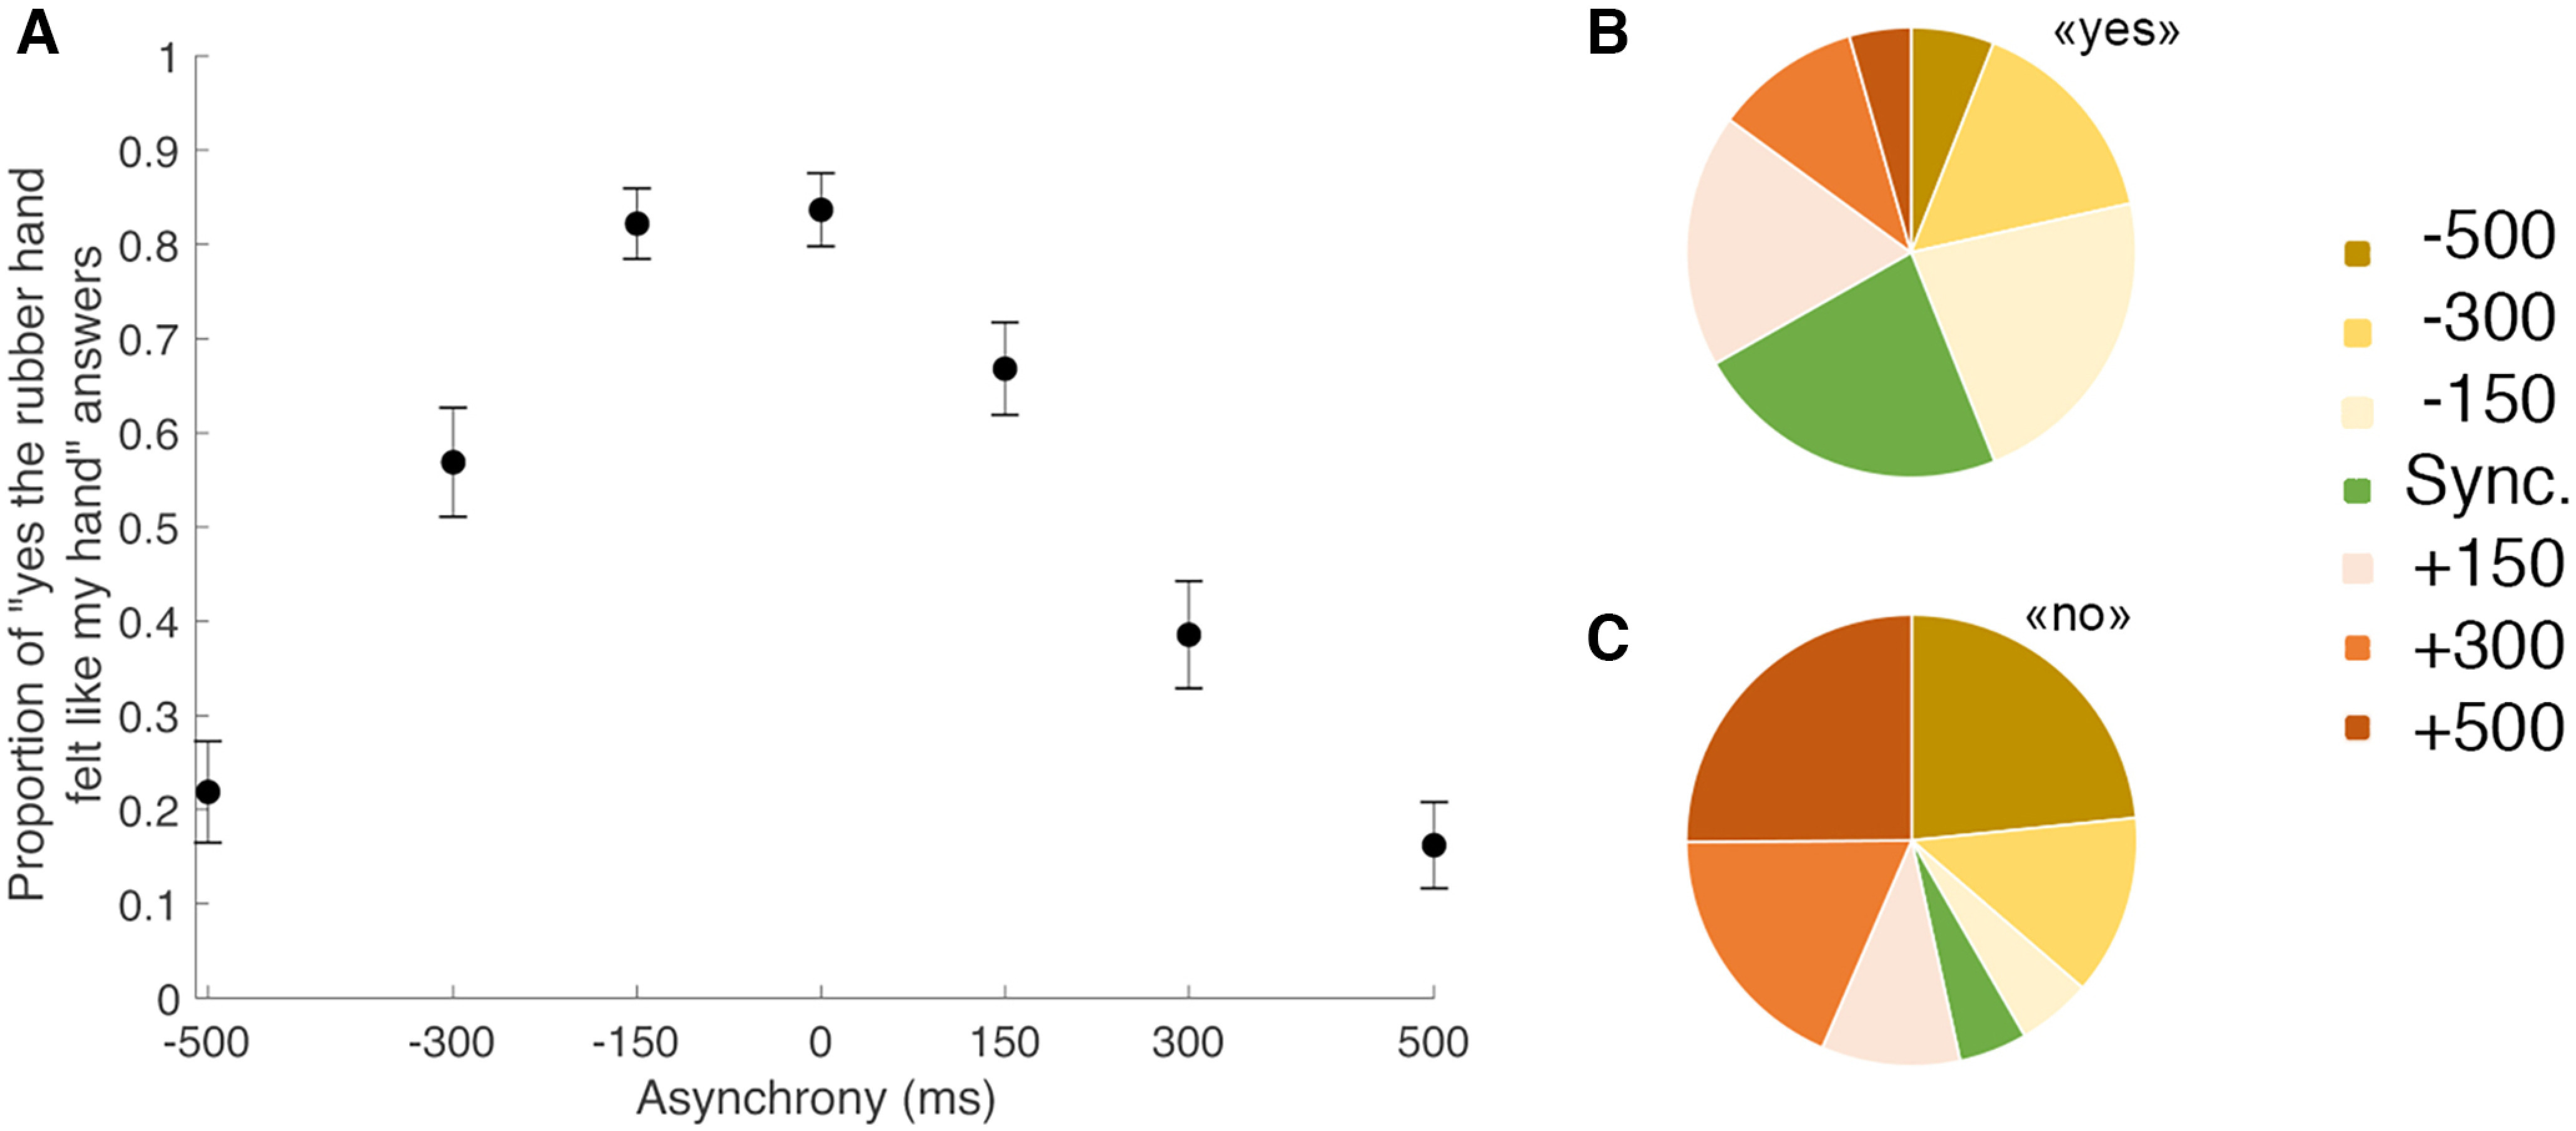
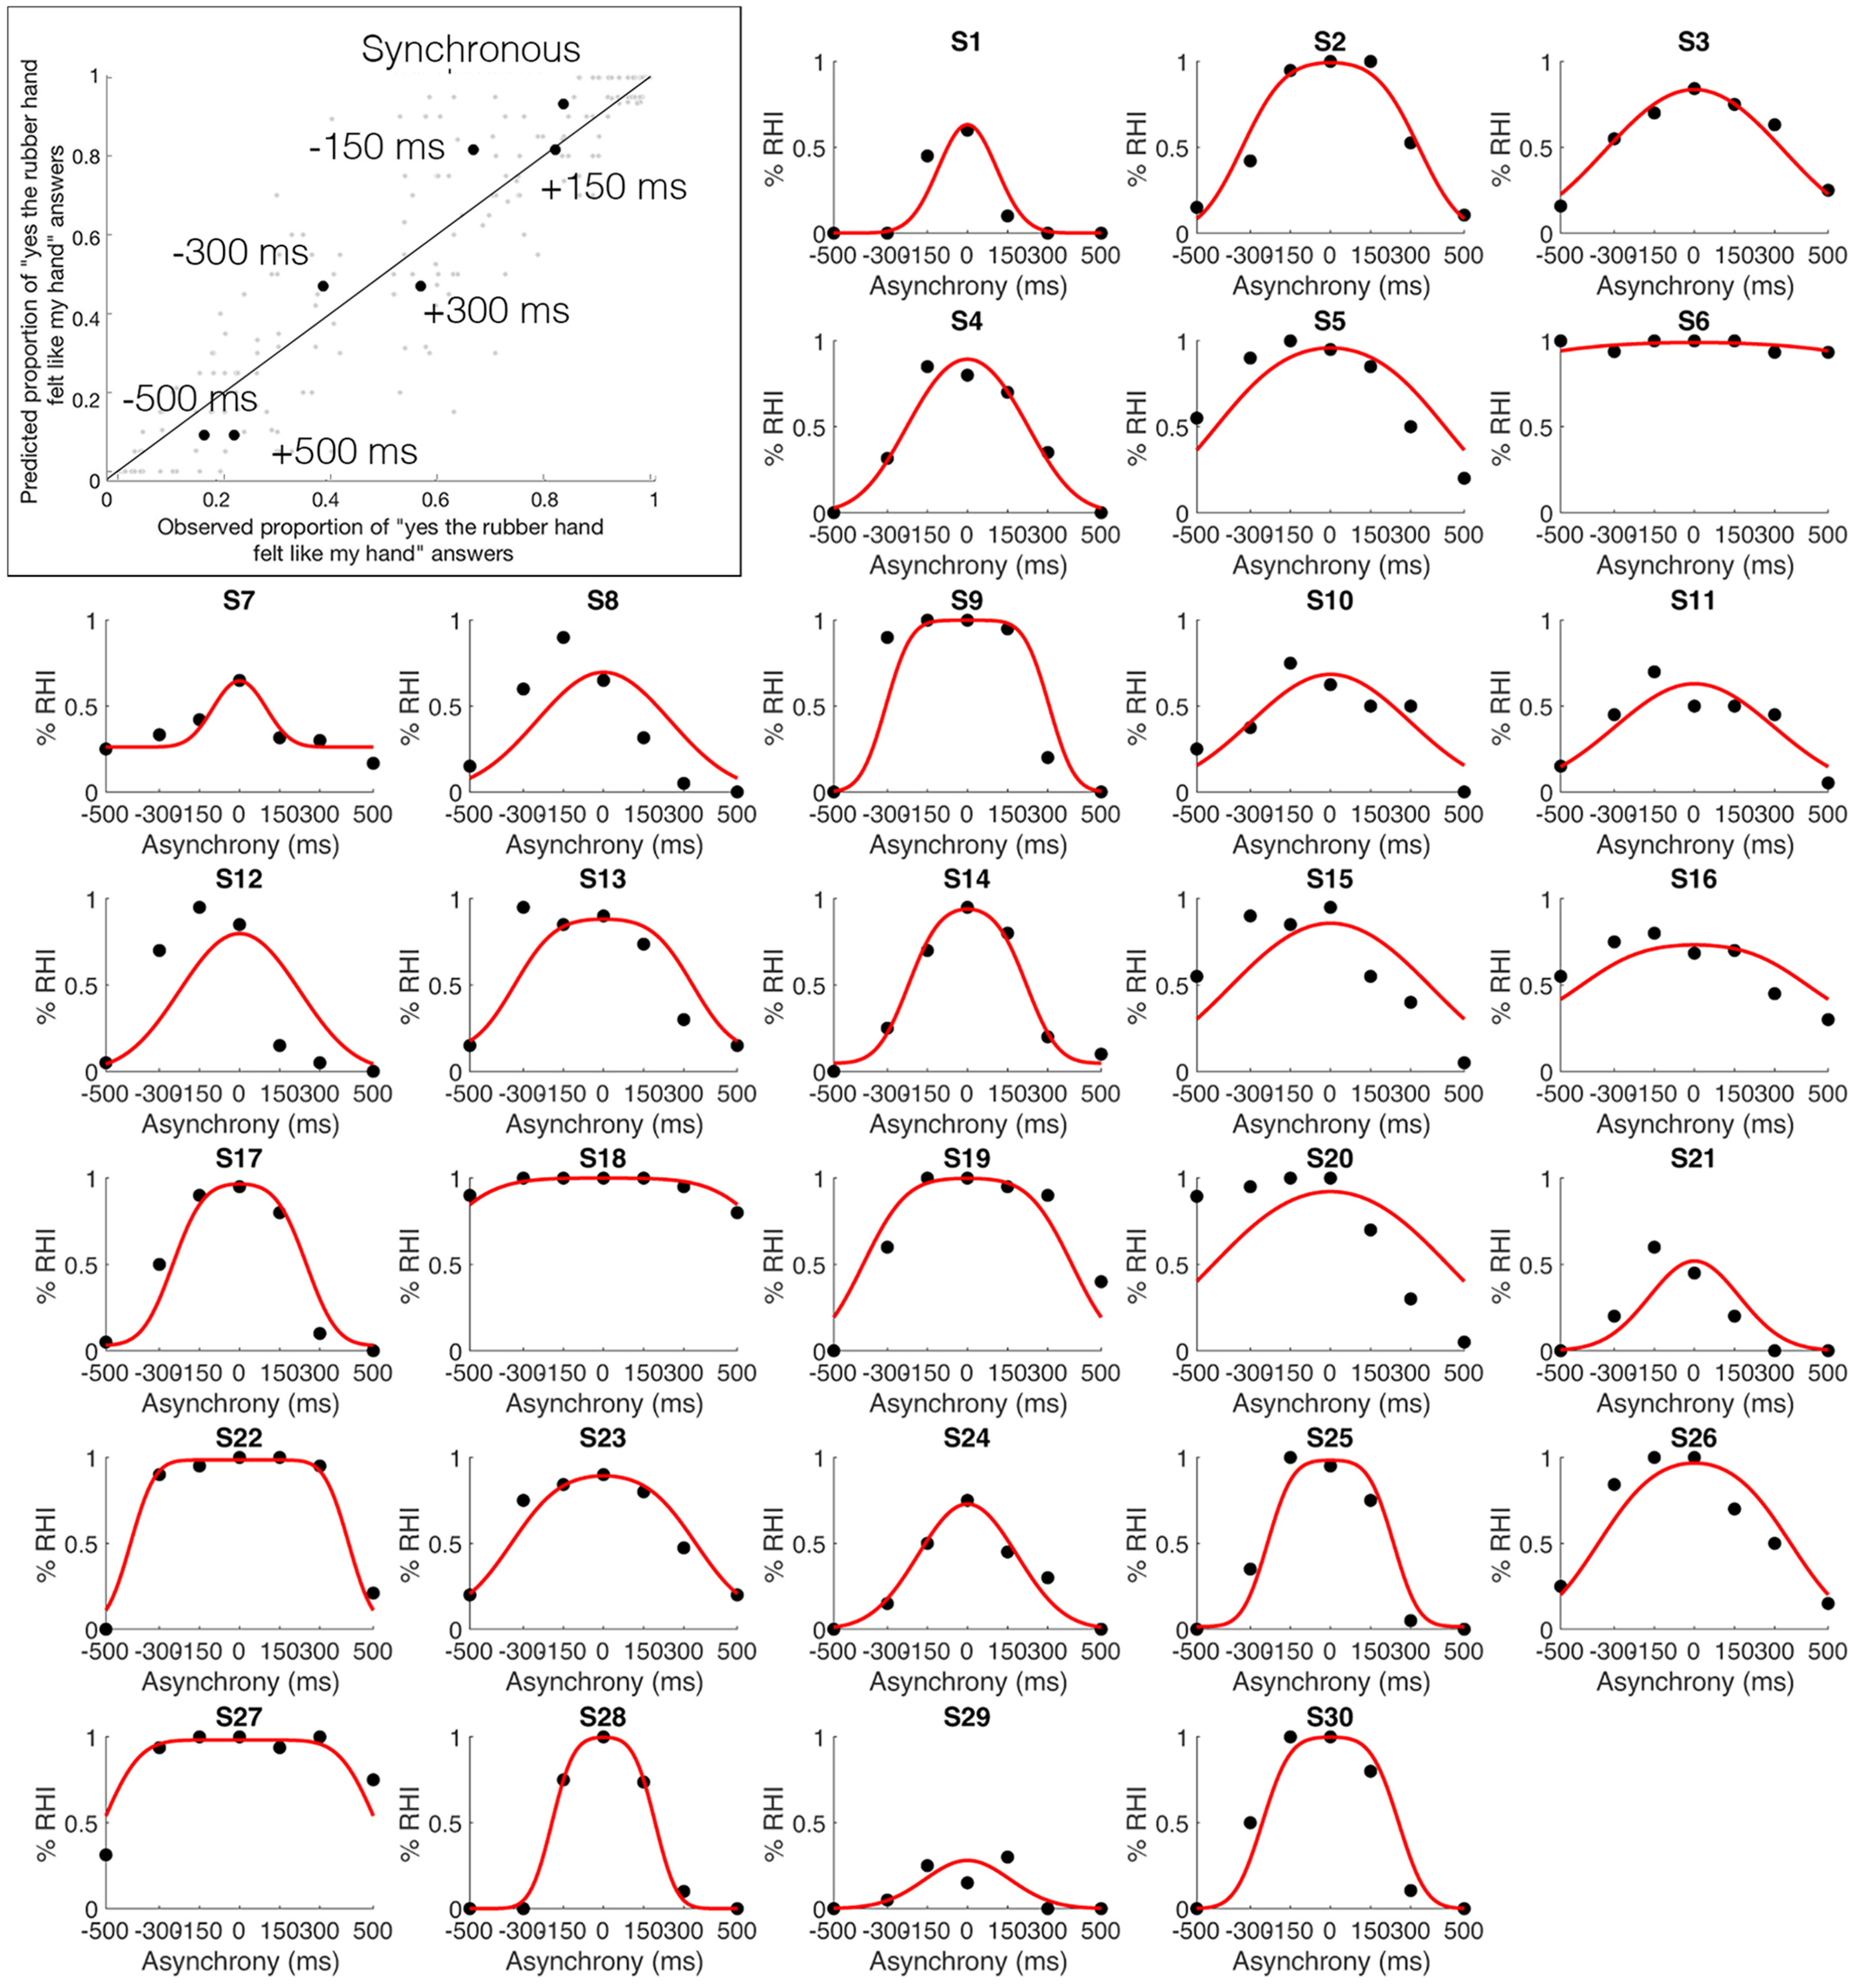
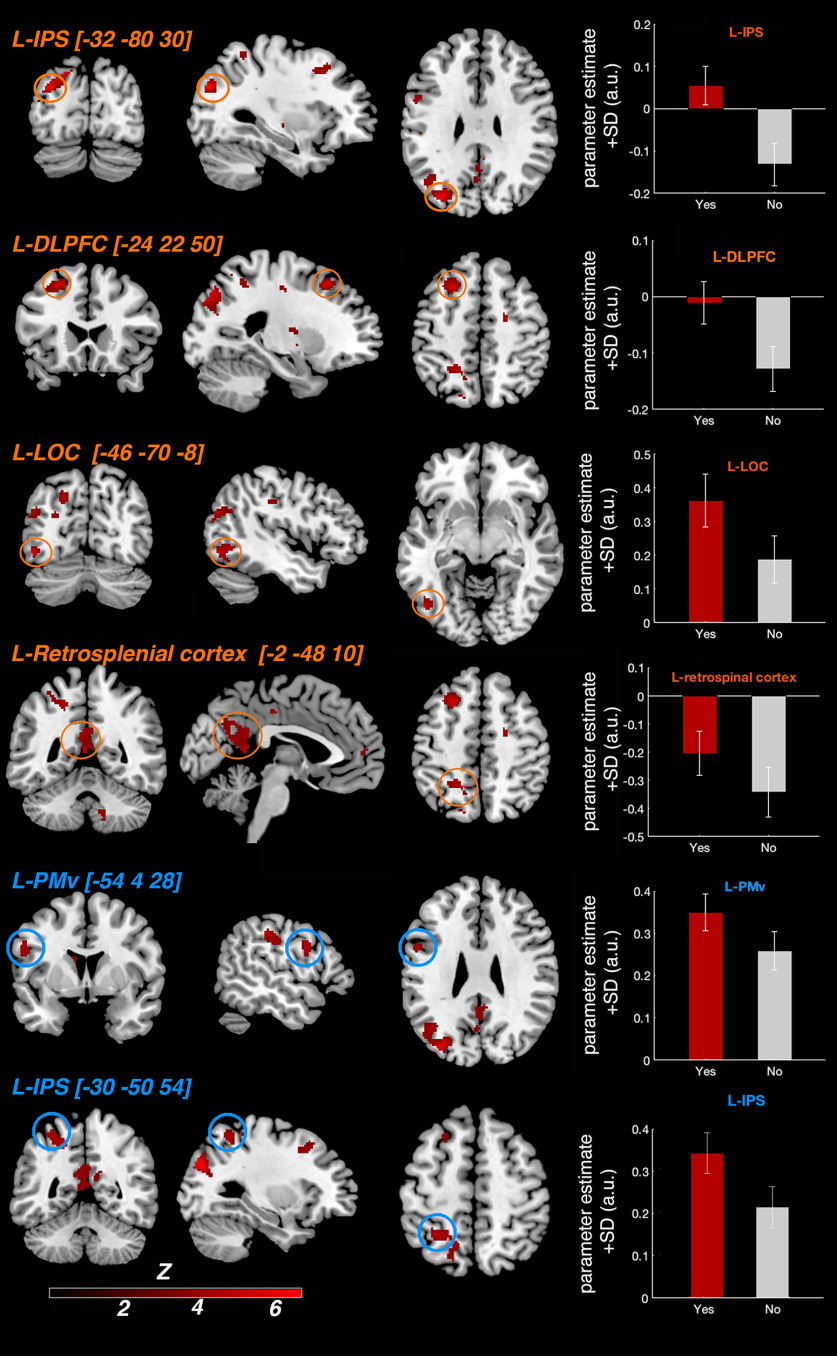
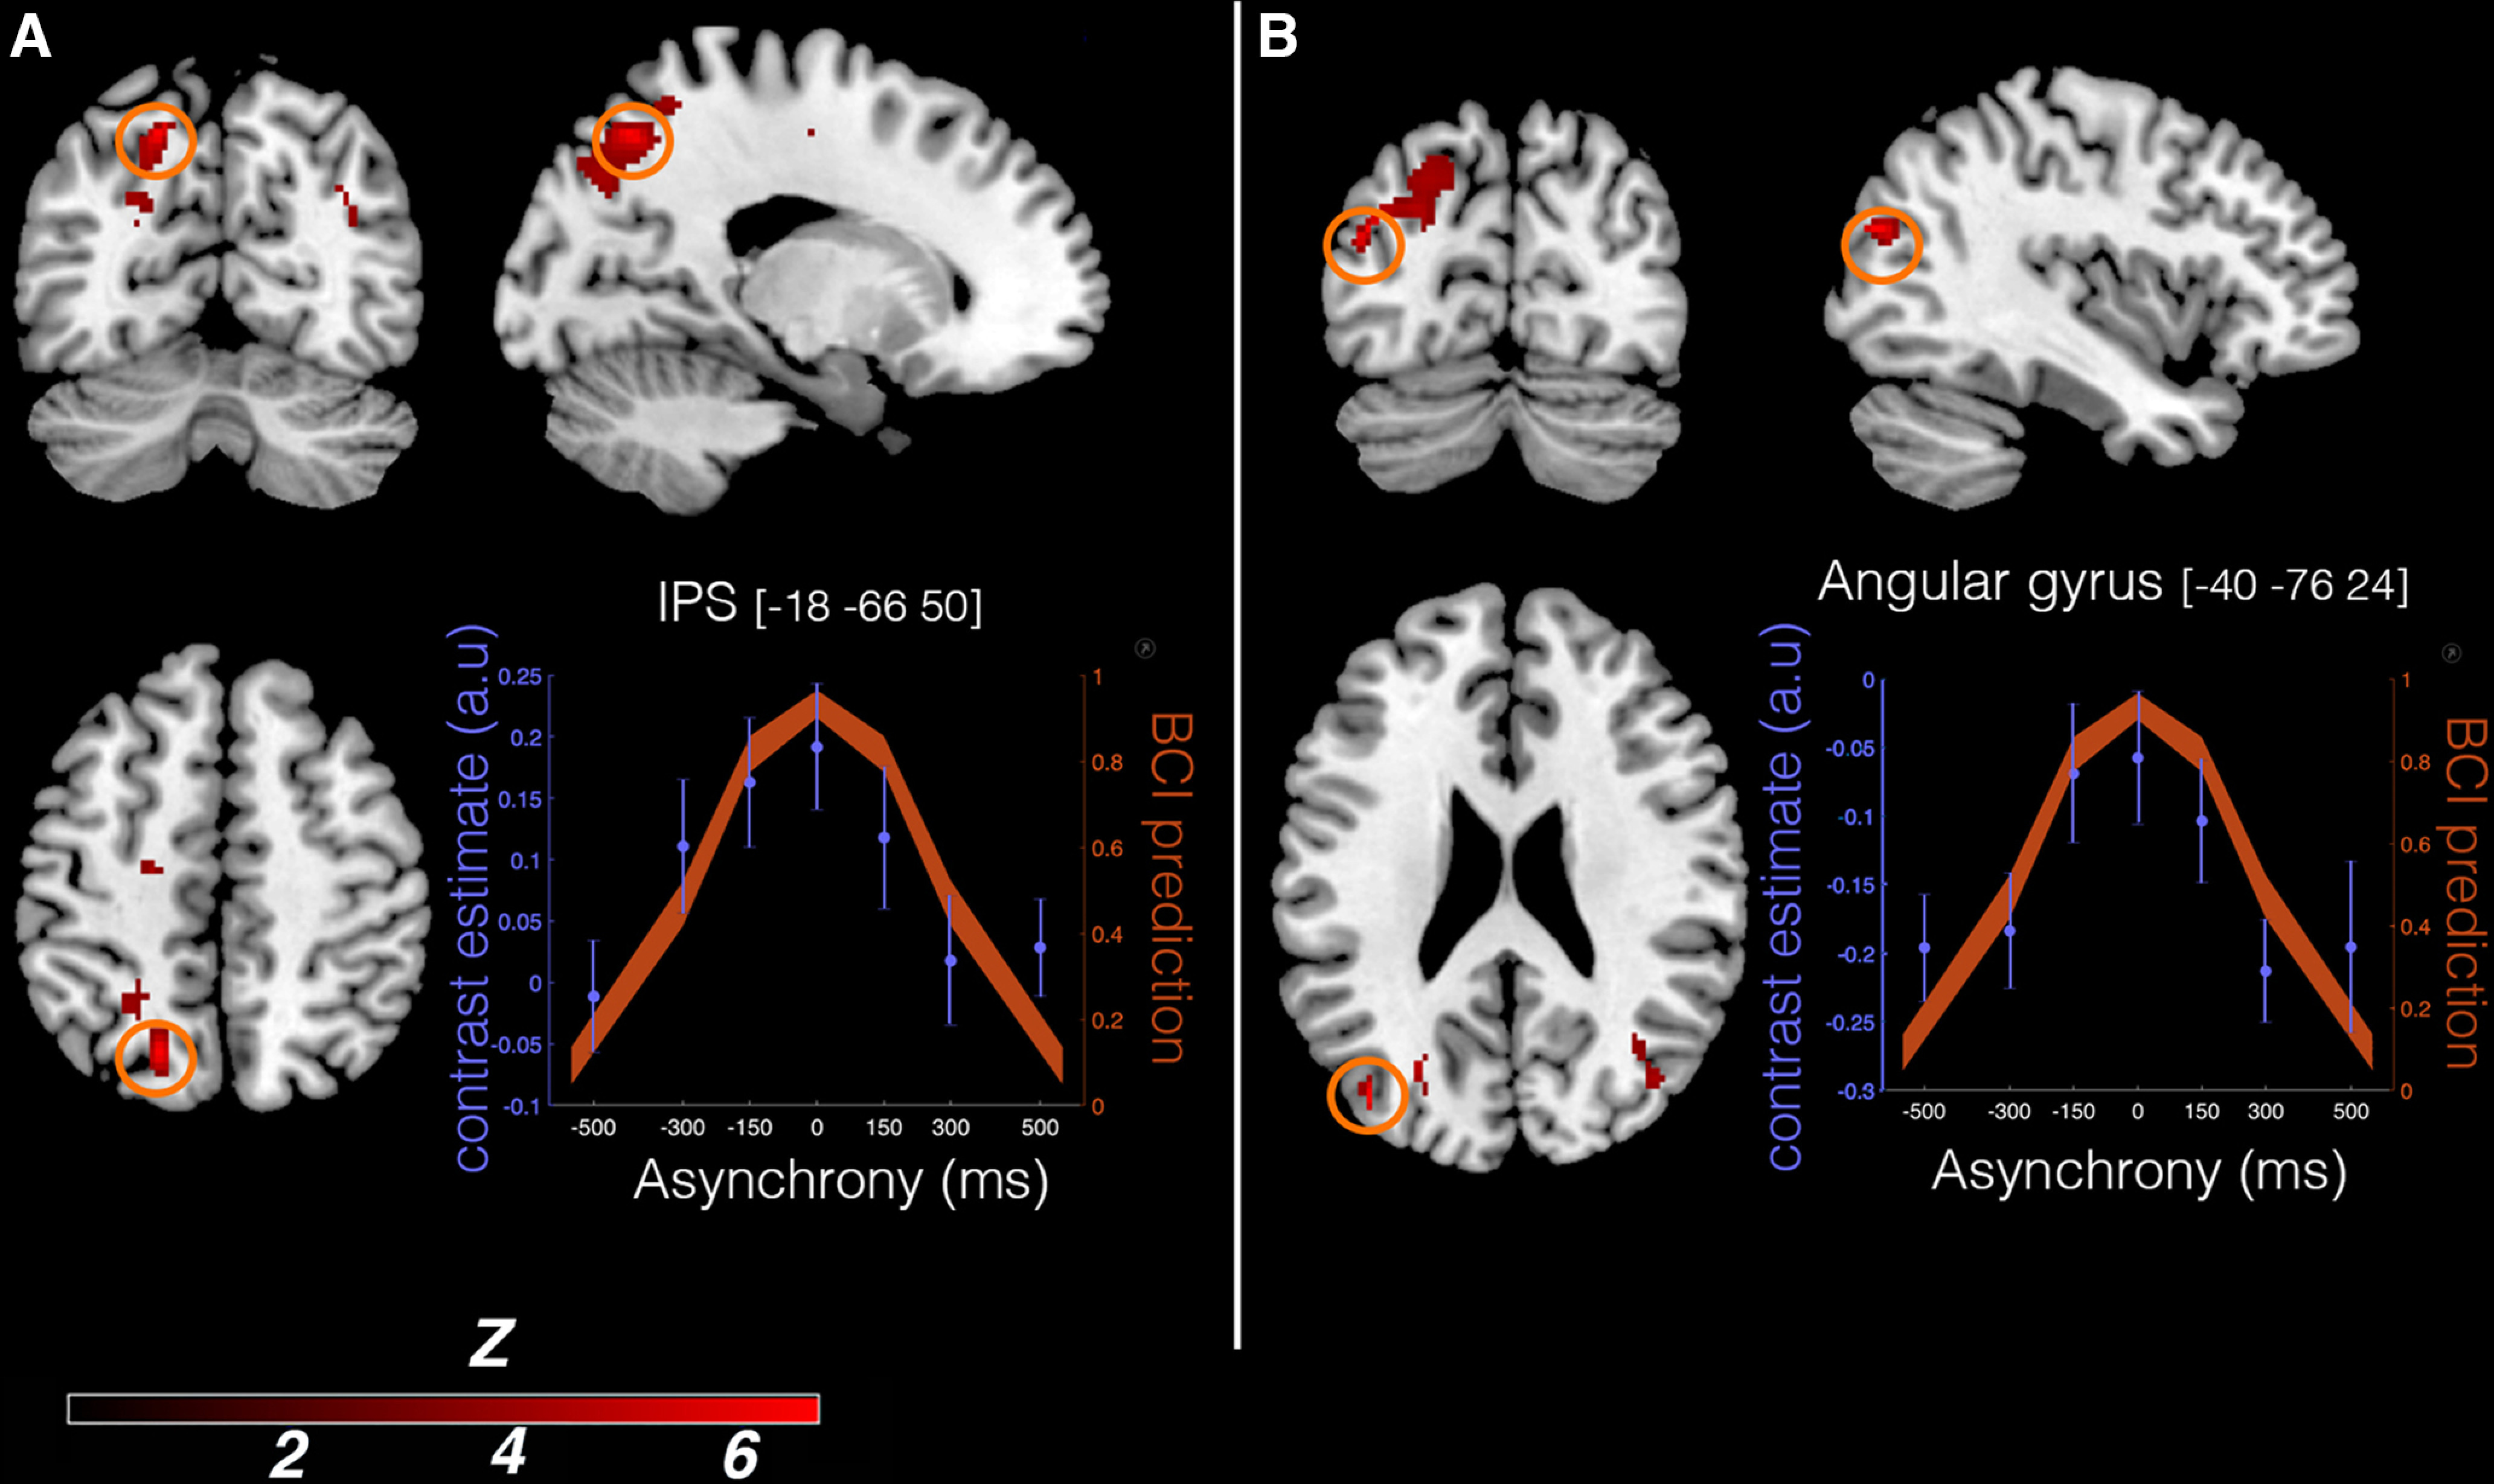
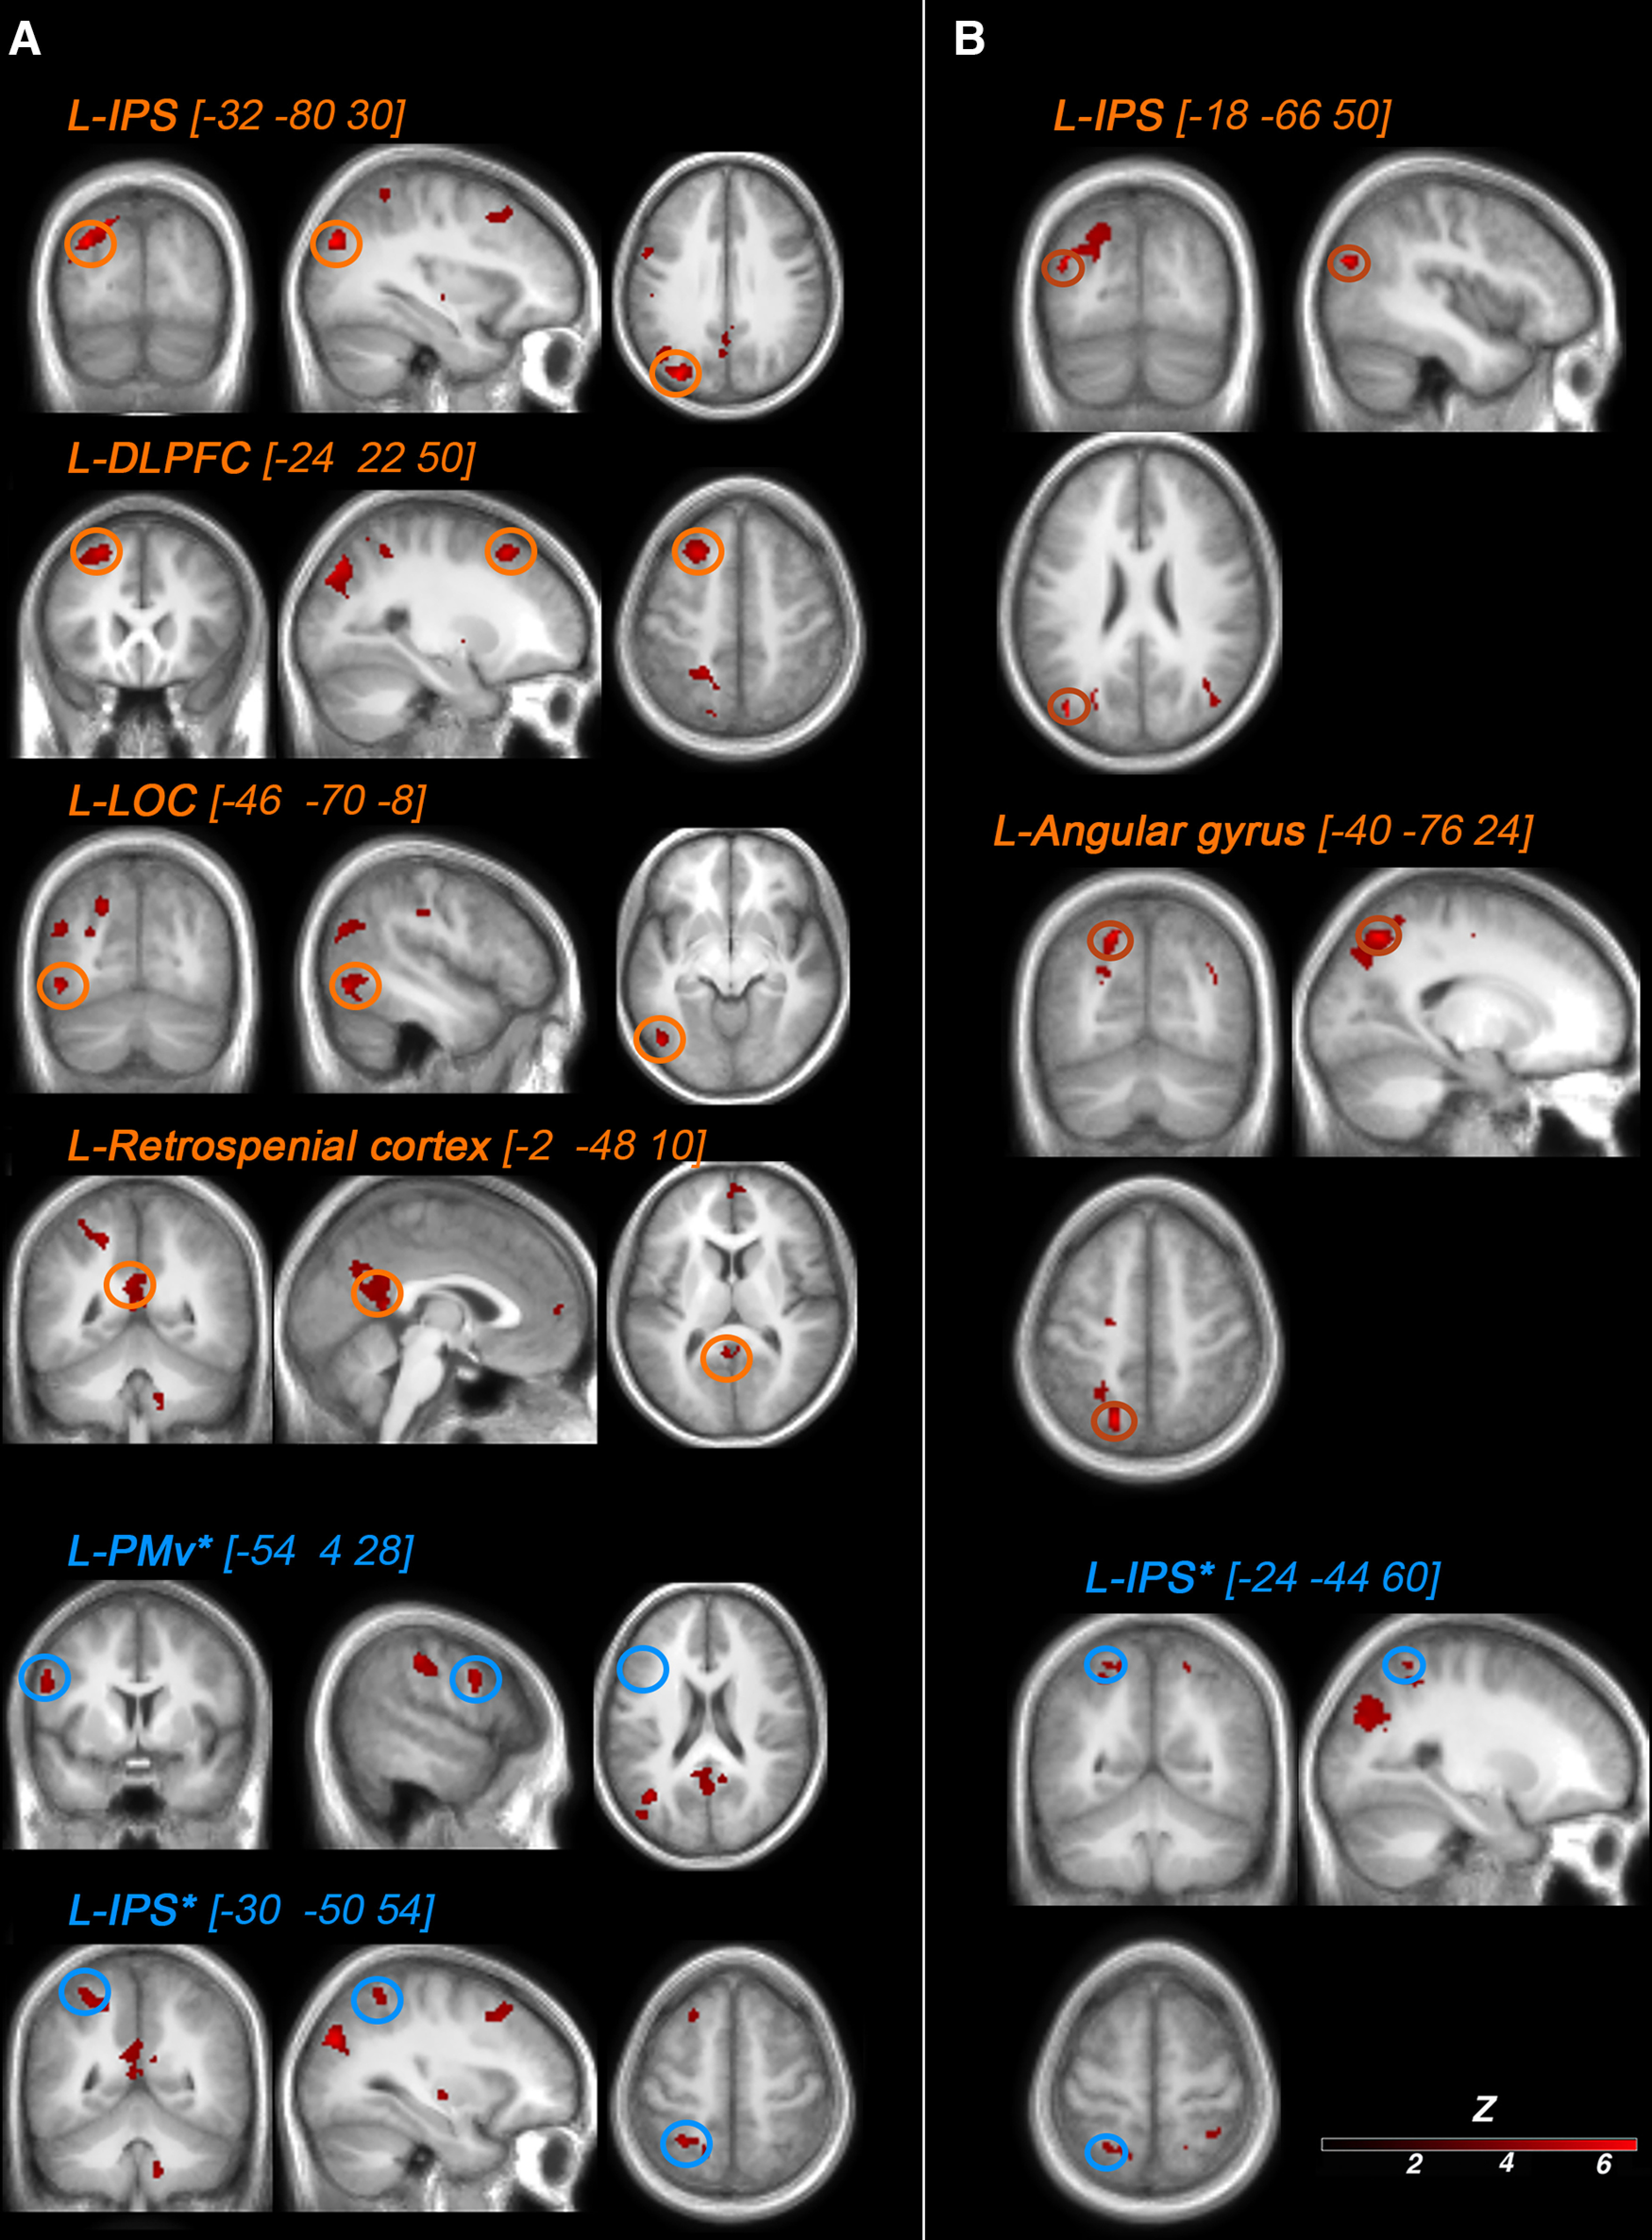
How do we come to sense that a hand in view belongs to our own body or not? Previous studies have suggested that the integration of vision and somatosensation in the frontoparietal areas plays a critical role in the sense of body ownership (i.e., the multisensory perception of limbs and body parts as our own). However, little is known about how these areas implement the multisensory integration process at the computational level and whether activity predicts illusion elicitation in individual participants on a trial-by-trial basis. To address these questions, we used functional magnetic resonance imaging and a rubber hand illusion-detection task and fitted the registered neural responses to a Bayesian causal inference model of body ownership. Thirty healthy human participants (male and female) performed 12 s trials with varying degrees of asynchronously delivered visual and tactile stimuli of a rubber hand (in view) and a (hidden) real hand. After the 12 s period, participants had to judge whether the rubber hand felt like their own. As hypothesized, activity in the premotor and posterior parietal cortices was related to illusion elicitation at the level of individual participants and trials. Importantly, activity in the posterior parietal cortex fit the predicted probability of illusion emergence of the Bayesian causal inference model based on each participant's behavioral response profile. Our findings suggest an important role for the posterior parietal cortex in implementing Bayesian causal inference of body ownership and reveal how trial-by-trial variations in neural signatures of multisensory integration relate to the elicitation of the rubber hand illusion.SIGNIFICANCE STATEMENT How does the brain create a coherent perceptual experience of one's own body based on information from the different senses? We examined how the likelihood of eliciting a classical bodily illusion that depends on vision and touch-the rubber hand illusion-is related to neural activity measured by functional magnetic resonance imaging. We found that trial-by-trial variations in the neural signal in the posterior parietal cortex, a well known center for sensory integration, fitted a statistical function that describes how likely it is that the brain infers that a rubber hand is one's own given the available visual and tactile evidence. Thus, probabilistic analysis of sensory information in the parietal lobe underlies our unitary sense of bodily self.
Keywords: Bayesian causal inference; body perception; functional MRI; multisensory integration; neuroimaging; psychophysics; rubber hand illusion.
Copyright © 2022 Chancel et al.
Figures
Similar articles
-
Uncertainty-based inference of a common cause for body ownership.Elife. 2022 Sep 27;11:e77221. doi: 10.7554/eLife.77221. Elife. 2022. PMID: 36165441 Free PMC article.
-
Proprioceptive uncertainty promotes the rubber hand illusion.Cortex. 2023 Aug;165:70-85. doi: 10.1016/j.cortex.2023.04.005. Epub 2023 May 4. Cortex. 2023. PMID: 37269634 Free PMC article.
-
Anodal transcranial direct current stimulation over the posterior parietal cortex reduces the onset time to the rubber hand illusion and increases the body ownership.Exp Brain Res. 2018 Nov;236(11):2935-2943. doi: 10.1007/s00221-018-5353-9. Epub 2018 Aug 6. Exp Brain Res. 2018. PMID: 30084055
-
Neural mechanisms underlying the Rubber Hand Illusion: A systematic review of related neurophysiological studies.Brain Behav. 2021 Aug;11(8):e02124. doi: 10.1002/brb3.2124. Epub 2021 Jul 21. Brain Behav. 2021. PMID: 34288558 Free PMC article.
-
Extending Bayesian Models of the Rubber Hand Illusion.Multisens Res. 2020 Jan 8;33(2):127-160. doi: 10.1163/22134808-20191440. Multisens Res. 2020. PMID: 31648196 Review.
Cited by
-
Uncertainty-based inference of a common cause for body ownership.Elife. 2022 Sep 27;11:e77221. doi: 10.7554/eLife.77221. Elife. 2022. PMID: 36165441 Free PMC article.
-
Sensory reweighting and self-motion perception for postural control under single-sensory and multisensory perturbations in older Tai Chi practitioners.Front Hum Neurosci. 2024 Nov 1;18:1482752. doi: 10.3389/fnhum.2024.1482752. eCollection 2024. Front Hum Neurosci. 2024. PMID: 39555493 Free PMC article.
-
Neural bases of the bodily self as revealed by electrical brain stimulation: A systematic review.Hum Brain Mapp. 2023 May;44(7):2936-2959. doi: 10.1002/hbm.26253. Epub 2023 Feb 28. Hum Brain Mapp. 2023. PMID: 36852645 Free PMC article.
-
Visual perspective and body ownership modulate vicarious pain and touch: A systematic review.Psychon Bull Rev. 2024 Oct;31(5):1954-1980. doi: 10.3758/s13423-024-02477-5. Epub 2024 Mar 1. Psychon Bull Rev. 2024. PMID: 38429591 Free PMC article.
-
Artificial embodiment displaces cortical neuromagnetic somatosensory responses.Sci Rep. 2024 Sep 27;14(1):22279. doi: 10.1038/s41598-024-72460-6. Sci Rep. 2024. PMID: 39333283 Free PMC article.
References
-
- Acerbi L, Ma WJ (2017) Practical Bayesian Optimization for Model Fitting with Bayesian Adaptive Direct Search. In Advances in Neural Information Processing Systems 30:1834–1844.
-
- Avillac M, Olivier E, Denève S, Ben Hamed S, Duhamel J-R (2004) Multisensory integration in multiple reference frames in the posterior parietal cortex. Cogn Process 5:159–166. 10.1007/s10339-004-0021-3 - DOI
-
- Bekrater-Bodmann R, Foell J, Diers M, Kamping S, Rance M, Kirsch P, Trojan J, Fuchs X, Bach F, Çakmak HK, Maaß H, Flor H (2014) The importance of synchrony and temporal order of visual and tactile input for illusory limb ownership experiences—an fMRI study applying virtual reality. PLoS One 9:e87013. 10.1371/journal.pone.0087013 - DOI - PMC - PubMed
Publication types
MeSH terms
LinkOut - more resources
Full Text Sources
Research Materials