. 2022 Sep 20;99(12):e1265-e1277.
doi: 10.1212/WNL.0000000000200892. Epub 2022 Aug 8.

Association of Microglial Activation With Spontaneous ARIA-E and CSF Levels of Anti-Aβ Autoantibodies

Affiliations

Association of Microglial Activation With Spontaneous ARIA-E and CSF Levels of Anti-Aβ Autoantibodies

Fabrizio Piazza et al. Neurology. .

Abstract

Background and objectives: Amyloid-related imaging abnormalities suggestive of vasogenic edema or sulcal effusion (ARIA-E) are the most common adverse events complicating Alzheimer disease (AD) immunotherapy with anti-β-amyloid (Aβ) monoclonal antibodies. ARIA-E can also occur spontaneously in cerebral amyloid angiopathy-related inflammation (CAA-ri), a rare autoimmune encephalopathy associated with increased CSF levels of anti-Aβ autoantibodies. Although the pathophysiologic mechanisms of ARIA-E remain to be fully elucidated, experimental evidence from ex vivo studies suggests that gantenerumab and aducanumab enable microglial activation. However, the in vivo evidence for a direct association between neuroinflammation and ARIA-E in patients with high CSF anti-Aβ (auto)antibody levels has never been demonstrated.

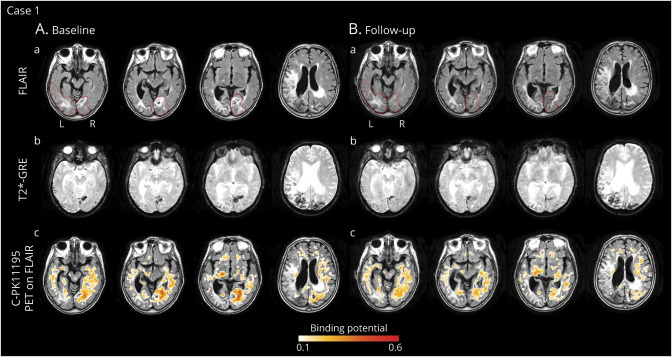
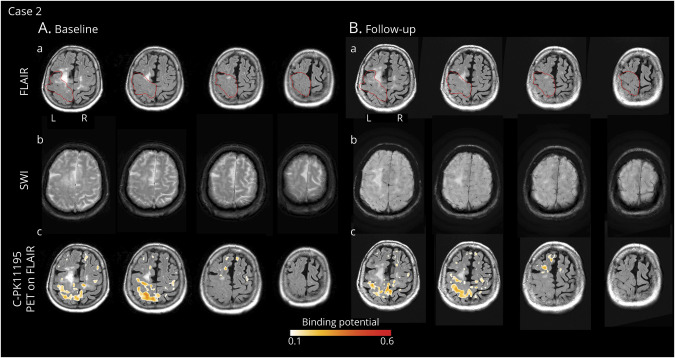
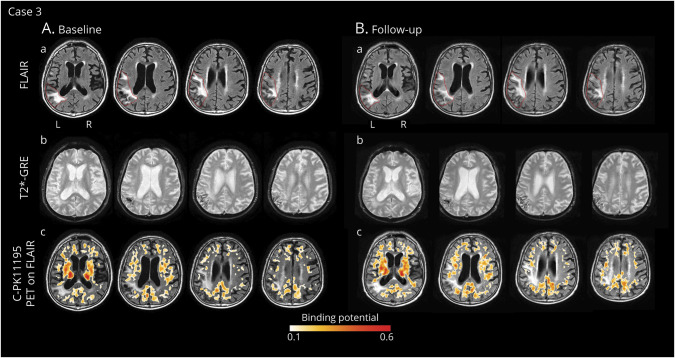
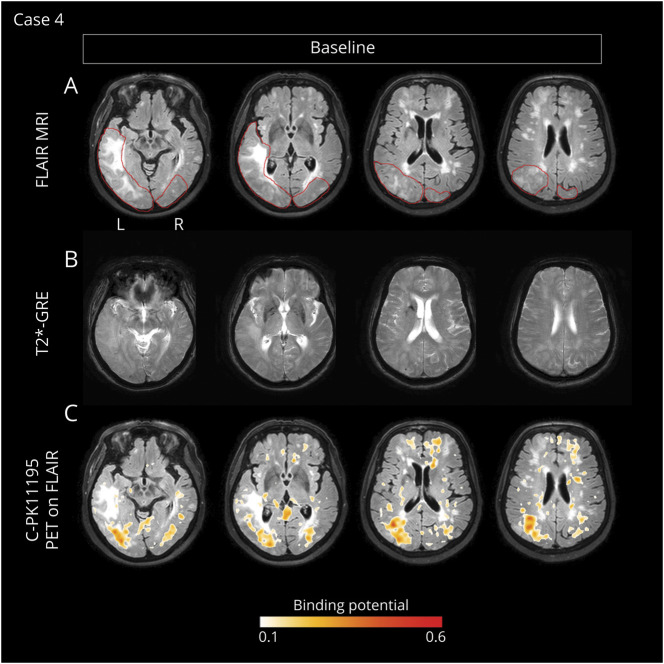
Methods: The spatial distribution and temporal variations of microglial activation associated with levels of anti-Aβ autoantibodies at (sub)acute presentation of ARIA-E and after corticosteroid therapy were evaluated in a longitudinal case series of patients with CAA-ri, the spontaneous variant of the iatrogenic ARIA-E reported in Aβ-lowering immunotherapy with monoclonal antibodies. Multimodal and multiparametric MRI was used for CAA and ARIA-E severity quantification, according to validated scoring system; CSF testing for anti-Aβ autoantibodies and AD biomarkers; 11C-PK11195 PET for activated microglia.

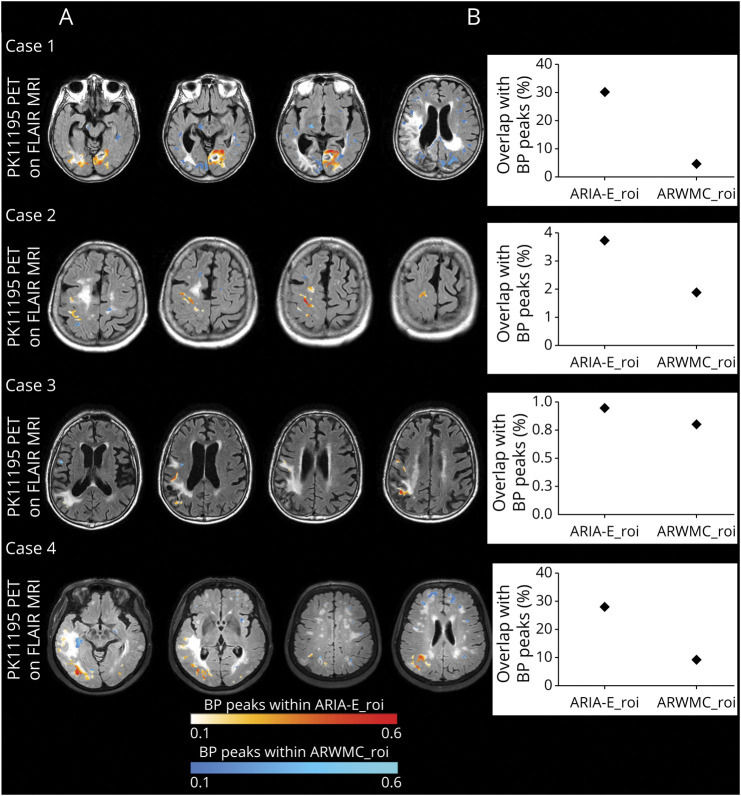
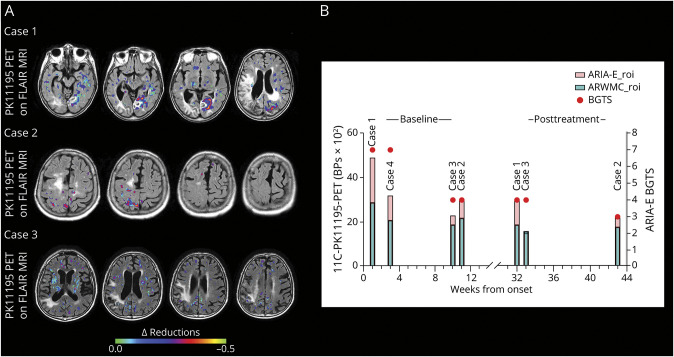
Results: At (sub)acute presentation, we found focal peaks of microglial activation having a greater spatial colocalization with ARIA-E compared with chronic age-related white matter change imaging abnormalities. The severity of ARIA-E and the magnitude of the associated microglial activation were greater in patients having AD and severe CAA concomitant disease compared with patients having CAA only. CSF anti-Aβ autoantibodies at presentation were high in all patients and markedly decreased at posttreatment follow-up, in parallel with clinical resolution of acute symptoms, reduced ARIA-E severity, and reduced microglial activation.

Discussion: Our findings extend the current notion of ARIA-E by providing the first in vivo 11C-PK11195 PET evidence for an association between microglial activation and the magnitude and severity of ARIA-E in patients with increased CSF concentration of anti-Aβ autoantibodies and comorbid AD and CAA disease. Our results highlight CSF testing for anti-Aβ autoantibodies as a promising diagnostic, prognostic, and therapy response biomarker to help guide future treatment and management decisions in real clinical practice and clinical trials.


Figures

Figure 1
Figure 1. Longitudinal In Vivo Imaging of Microglial Activation During the Course of Spontaneous ARIA-E in a Patient With Probable CAA-ri (Case 1)
(A) Baseline MRI and 11C-PK11195 PET images acquired within 1 week from presentation of (sub)acute symptoms. (a) T2-weighted (FLAIR) images showed spontaneous ARIA-E in the occipital lobe, bilaterally (red lines indicate the anatomic regions affected by ARIA-E). (b) Gradient echo-T2*-weighted imaging (GRE-T2*) sequence, coregistered to baseline FLAIR images, showed multiple cerebral microbleeds (CMBs) in the right and left occipital lobes, disseminated cortical superficial siderosis (cSS), and late subacute intracerebral hemorrhage (ICH) in the right occipital pole. CSF testing confirmed high concentrations of anti-Aβ autoantibodies. The diagnosis of probable CAA-ri was made. (c) 11C-PK11195 PET images, coregistered and superimposed onto baseline FLAIR images, revealed diffused binding potential peaks (BP peaks) of microglial activation, more evident within the ARIA-E anatomic region in the right occipital lobe. Treatment with high-dose corticosteroid pulse therapy was started, followed by slow tapering-off for the subsequent 5 months. (B) Follow-up MRI and 11C-PK11195 PET acquired 5 months after the starting of corticosteroids. MRI and PET images are coregistered to baseline FLAIR. (a) FLAIR images showed a marked reduction of vasogenic edema within the ARIA-E anatomic regions defined at baseline (red lines). (b) GRE-T2* images showed a reduction of the extent of signal drop near the subacute ICH in the right occipital pole and the appearing of 2 new CMBs localized outside the ARIA-E anatomic regions. (c) 11C-PK11195 PET revealed a globally reduced microglial activation that was more evident in the ARIA-E anatomic region. ARIA-E = amyloid-related imaging abnormalities suggestive of vasogenic edema; FLAIR = fluid-attenuated inversion recovery.
Figure 2
Figure 2. Microglial Activation Overlapping With ARIA-E and ARWMC at Baseline
(A) The figure shows baseline 11C-PK11195 binding potential peaks (BP peaks) overlapping ARIA-E (ARIA-E_roi) and ARWMC (ARWMC_roi) regions of interest. For each patient, BP peaks were extracted from the same baseline BP peak maps displayed on the left lower rows of Figures 1–4 and superimposed on FLAIR images acquired at baseline. The intensity of microglial activation is represented using a yellow to red scale for BP peaks overlapping with ARIA-E_roi and a dark to light blue scale for BP peaks overlapping with ARWMC_roi. (B) Graphical representation of the percentage of spatial interaction between microglial activation and ARIA-E_roi and ARWMC_roi computed, respectively, as the total number of BP peaks and ROI overlapping voxels normalized to the number of voxels of the ROI. ARIA-E = amyloid-related imaging abnormalities suggestive of vasogenic edema; ARWMC = age-related white matter change; FLAIR = fluid-attenuated inversion recovery; ROI = region of interest.
Figure 3
Figure 3. Delta Reductions of Microglial Activation at Posttreatment Follow‐up Monitoring
(A) The figure shows delta reduction maps for the 3 patients who had a second 11CPK11195 PET scan at posttreatment follow‐up monitoring. Delta reductions are expressed as the difference between 11C‐PK11195 PET binding potential peaks (BP‐peaks) of microglial activation at baseline and BP‐peaks at follow‐up, computed voxel‐vise. The colored scale represents the BPpeaks decrease at follow‐up. (B) The figure shows longitudinal variation of the mean BPs values of each region of interest (ROI), i.e. ARIA‐E_roi (red columns) and ARWMC_roi (green columns), calculated at baseline (left side) and at posttreatment follow‐up monitoring (right side) for each patient. Mean BP values are expressed as BPs x 102 for illustration purposes. Red circles represent BGTS values at each time point. ARIA‐E = amyloid‐related imaging abnormalities suggestive of vasogenic edema or sulcal effusion; ARWMC = age‐related white matter changes; BGTS = Barkhof Grand Total score; ROI = region of interest.
Figure 4
Figure 4. Longitudinal In Vivo Imaging of Microglial Activation During the Course of Spontaneous ARIA-E in a Patient With Possible CAA-ri (Case 2)
(A) Baseline MRI and 11C-PK11195 PET images acquired 2 months after symptom onset. (a) T2-weighted (FLAIR) images showed spontaneous ARIA-E, i.e., reduced amplitude of sulci in the left superior parietal and precentral areas consistent with vasogenic edema (red lines indicate the anatomic regions affected by ARIA-E). (b) Gradient echo-T2*-weighted imaging (GRE-T2*) sequence, coregistered to baseline FLAIR images, showed multiple cerebral microbleeds (CMBs) in the right and left parietal lobes. CSF testing for anti-Aβ autoantibody was positive. The diagnosis of possible CAA-ri was made. (c) 11C-PK11195 PET images, coregistered and superimposed onto baseline FLAIR images, revealed clusters of microglial activation mainly localized within the ARIA-E region. Treatment with high-dose corticosteroid pulse therapy was started. One week later, second line therapy with oral azathioprine was started due to clinical worsening attributed to a new inflammatory flare. (B) Follow-up MRI and 11C-PK11195 PET images acquired 2.5 months from starting immunosuppressive therapy. MRI and PET images are coregistered to baseline FLAIR. (a) FLAIR images showed only a partial reduction of vasogenic edema within the ARIA-E region identified at baseline (red lines). (b) GRE-T2* images showed 1 new CMB, not localized within the ARIA-E region. CSF testing for anti-Aβ autoantibodies confirmed reduced levels compared with baseline. (c) 11C-PK11195 PET revealed a global reduced microglial activation that was more evident in the ARIA-E region. ARIA-E = amyloid-related imaging abnormalities suggestive of vasogenic edema; CAA-ri = cerebral amyloid angiopathy–related inflammation; FLAIR = fluid-attenuated inversion recovery.
Figure 5
Figure 5. Longitudinal In Vivo Imaging of Microglial Activation During the Course of Spontaneous ARIA in a Patient With Possible CAA-ri (Case 3)
(A) Baseline MRI and 11C-PK11195 PET images acquired 2.5 months after presentation of (sub)acute symptoms. (a) T2-weighted (FLAIR) images showed spontaneous ARIA-E in the left lateral fronto-temporo-parietal area (red lines indicate the anatomic regions affected by ARIA-E). (b) Gradient echo-T2*-weighted imaging (GRE-T2*) sequence, coregistered to baseline FLAIR images, showed disseminated cortical superficial siderosis in the left and right parietal lobes. CSF testing confirmed high concentrations of anti-Aβ autoantibodies. A diagnosis of possible CAA-ri was made. (c) 11C-PK11195 PET binding potentials (BP peaks), coregistered and superimposed onto baseline FLAIR, revealed scattered clusters of microglial activation only partially localized within the ARIA-E anatomic region. Treatment with high-dose corticosteroid pulse therapy was started, with progressive resolution of clinical symptoms. (B) Follow-up MRI and 11C-PK11195 PET acquired three and a half months after starting corticosteroids therapy. All images are coregistered to baseline FLAIR. (a) FLAIR images showed only a slight decrease in microglial activation, compared with baseline. (b) GRE-T2* images did not reveal any new microbleeds. CSF testing for anti-Aβ autoantibodies confirmed reduced levels compared with baseline. (c) 11C-PK11195 PET revealed a slight decrease in microglial activation within and outside the ARIA-E anatomic region. ARIA-E = amyloid-related imaging abnormalities suggestive of vasogenic edema; CAA-ri = cerebral amyloid angiopathy–related inflammation; FLAIR = fluid-attenuated inversion recovery.
Figure 6
Figure 6. Longitudinal In Vivo Imaging of Microglial Activation During the Course of Spontaneous ARIA in a Patient With Possible CAA-ri (Case 4)
Baseline MRIs and 11C-PK11195 PET acquired 3 weeks after symptom onset. (A) T2-weighted (FLAIR) images showed spontaneous ARIA-E in the left and right occipital lobes (red lines indicate the anatomic regions affected by ARIA-E). (B) Gradient echo-T2*-weighted imaging (GRE-T2*) sequence, coregistered to baseline FLAIR, showed disseminated cortical and subcortical microbleeds in the left temporal lobe and subarachnoid hemorrhage in the left parietal lobe. CSF testing confirmed high concentrations of anti-Aβ autoantibodies. A diagnosis of probable CAA-ri was made. (C) 11C-PK11195 PET binding potential peaks (BP peaks), coregistered and superimposed onto baseline FLAIR, reveal diffuse BP peak clusters of microglial activation that were mainly colocalized within the ARIA-E anatomic regions. The patient was treated with high-dose corticosteroid pulse therapy, with marked improvement of clinical symptoms. ARIA-E = amyloid-related imaging abnormalities suggestive of vasogenic edema; CAA-ri = cerebral amyloid angiopathy–related inflammation; FLAIR = fluid-attenuated inversion recovery.

References

    1. Antolini L, DiFrancesco JC, Zedde M, et al. . Spontaneous ARIA-like events in cerebral amyloid angiopathy-related inflammation: a multicenter prospective longitudinal cohort study. Neurology. 2021;97(18):e1809-e1822. - PMC - PubMed
    1. Piazza F, Greenberg SM, Savoiardo M, et al. . Anti-amyloid beta autoantibodies in cerebral amyloid angiopathy-related inflammation: implications for amyloid-modifying therapies. Ann Neurol. 2013;73(4):449-458. - PubMed
    1. Sperling RA, Jack CR Jr, Black SE, et al. . Amyloid-related imaging abnormalities in amyloid-modifying therapeutic trials: recommendations from the Alzheimer's Association Research Roundtable Workgroup. Alzheimers Dement. 2011;7(4):367-385. - PMC - PubMed
    1. Avgerinos KI, Ferrucci L, Kapogiannis D. Effects of monoclonal antibodies against amyloid-β on clinical and biomarker outcomes and adverse event risks: a systematic review and meta-analysis of phase III RCTs in Alzheimer's disease. Ageing Res Rev. 2021;68:101339. - PMC - PubMed
    1. Barakos J, Purcell D, Suhy J, et al. . Detection and management of amyloid-related imaging abnormalities in patients with Alzheimer's disease treated with anti-amyloid beta therapy. J Prev Alz Dis. 2022;9(2):211-220. - PubMed

Publication types

MeSH terms