. 2022 Oct;80(4):301-313.e3.
doi: 10.1016/j.annemergmed.2022.05.036. Epub 2022 Aug 6.

Ambulances Required to Relieve Overcapacity Hospitals: A Novel Measure of Hospital Strain During the COVID-19 Pandemic in the United States

Affiliations

Ambulances Required to Relieve Overcapacity Hospitals: A Novel Measure of Hospital Strain During the COVID-19 Pandemic in the United States

Kimon L H Ioannides et al. Ann Emerg Med. 2022 Oct.

Abstract

Study objective: One in 4 deaths from COVID-19 has been attributed to hospital crowding. We simulated how many ambulances would be required to rebalance hospital load through systematic interhospital transfers. We assessed the potential feasibility of such a strategy and explored whether transfer requirement was a helpful measure and visualization of regional hospital crowding during COVID-19 surges.

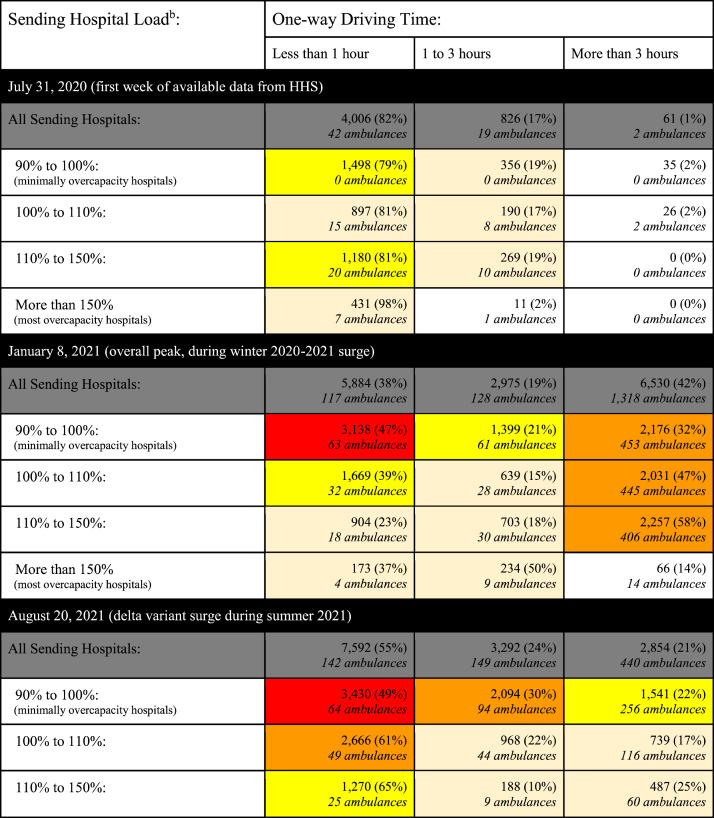
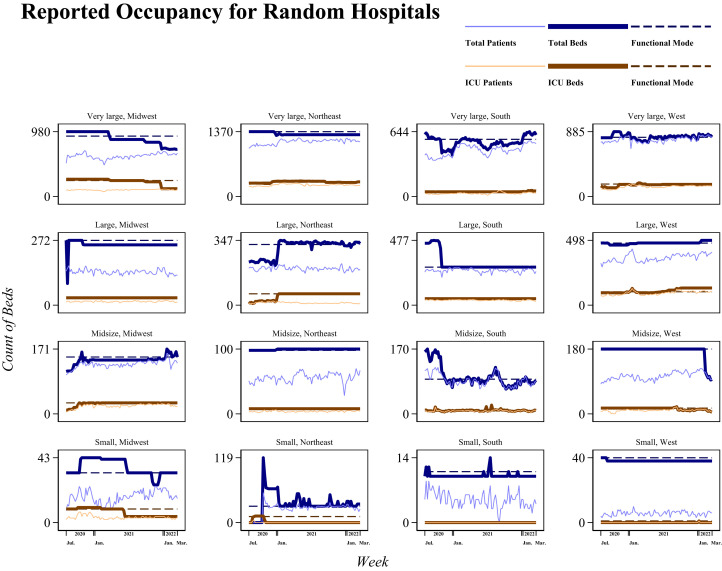
Methods: Using data from the United States hospitals reporting occupancy to the Department of Health and Human Services from July 2020 to March 2022 and road network driving times, we estimated the number of ambulances required weekly to relieve overcapacity hospitals.

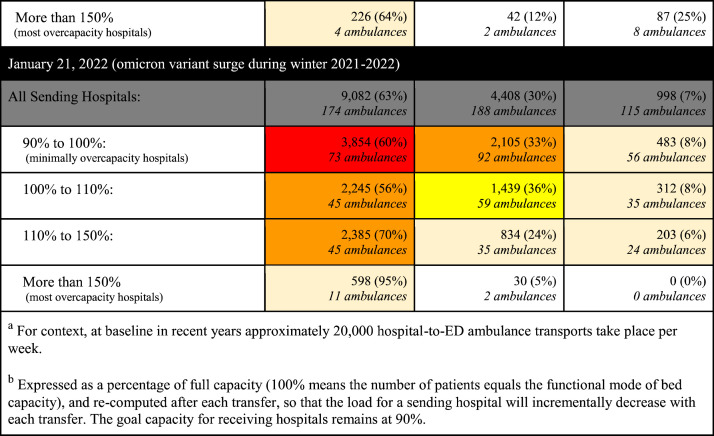
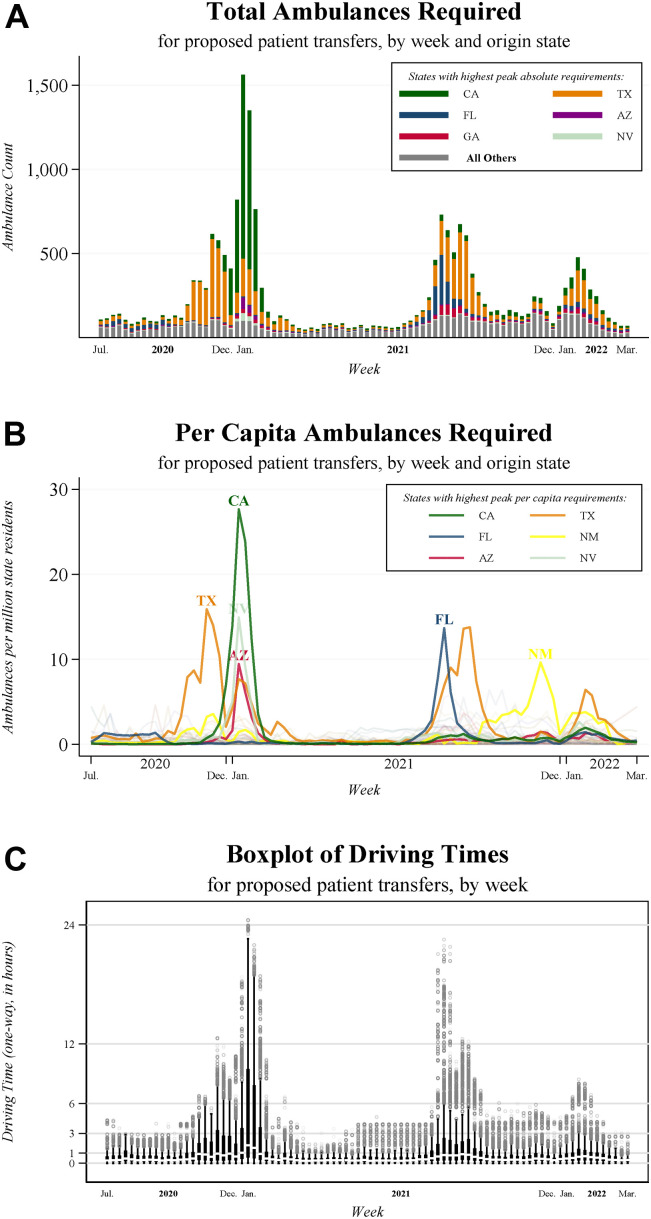
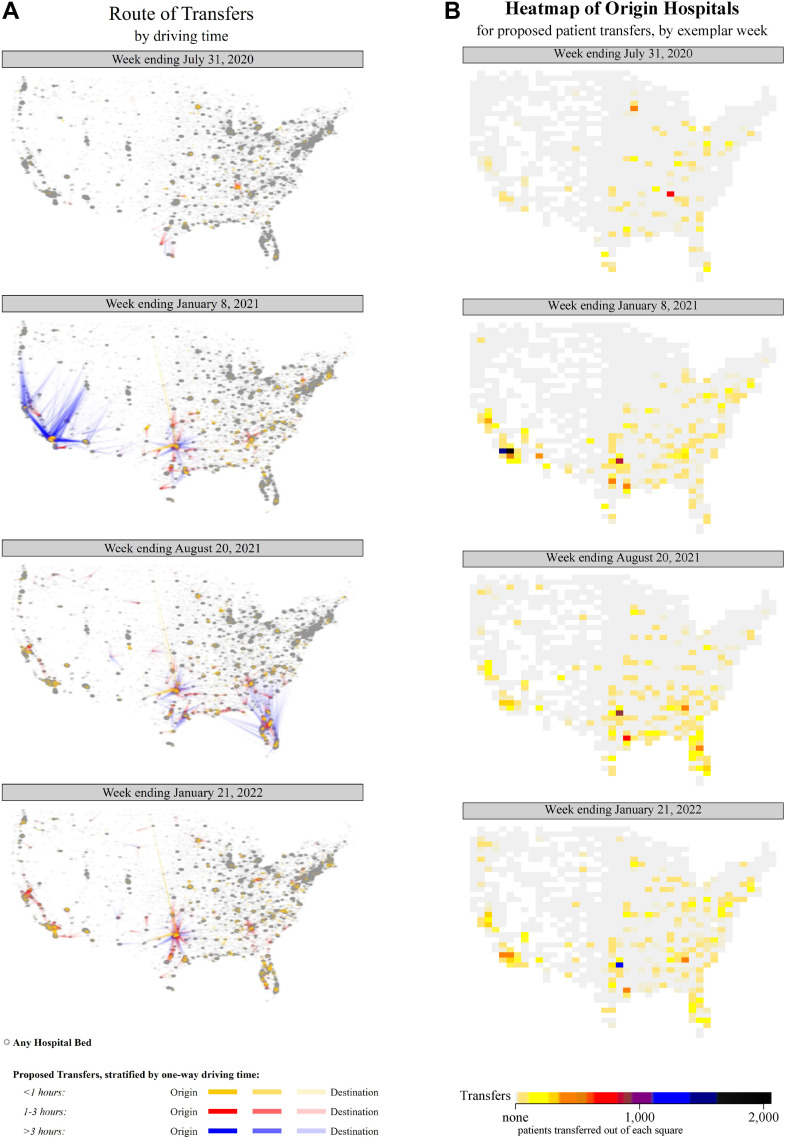
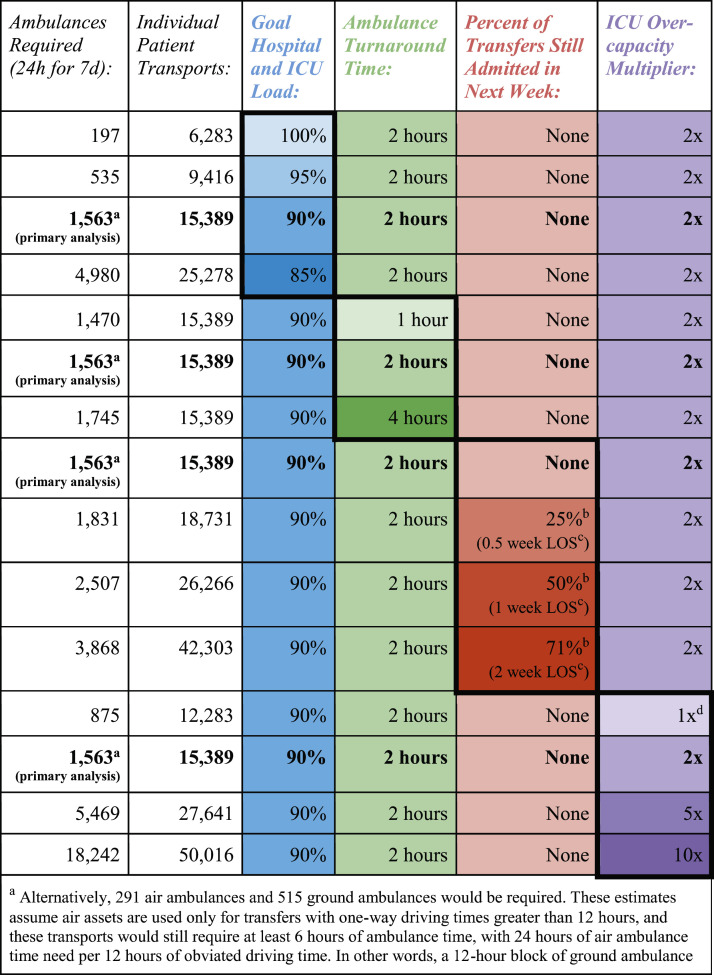
Results: During the peak week, which ended on January 8, 2021, approximately 1,563 ambulances would be needed for 15,389 simulated patient transports, of which 6,530 (42%) transports involved a 1-way driving time of more than 3 hours. Transfer demands were dramatically lower during most other weeks, with the median week requiring only 134 ambulances (interquartile range, 84 to 295) and involving only 116 transports with 1-way driving times above 3 hours (interquartile range, 4 to 548). On average, receiving hospitals were larger and located in more rural areas than sending hospitals.

Conclusion: This simulation demonstrated that for most weeks during the pandemic, ambulance availability and bed capacity were unlikely to have been the main impediments to rebalancing hospital loads. Our metric provided an immediately available and much more complete measure of hospital system strain than counts of hospital admissions alone.


Figures

Figure 1
Figure 1
Weekly simulated national patient transports, stratified by driving time and hospital load. Number of transfers for exemplar weeks, shaded by absolute number (>3,000, >2,000, >1,000, >100), with percentages by row, in addition to any baseline transports external to our simulation.aAnnotated, in italics, with the number of ambulances required to complete simulated transports.
Figure 1
Figure 1
Weekly simulated national patient transports, stratified by driving time and hospital load. Number of transfers for exemplar weeks, shaded by absolute number (>3,000, >2,000, >1,000, >100), with percentages by row, in addition to any baseline transports external to our simulation.aAnnotated, in italics, with the number of ambulances required to complete simulated transports.
Figure 2
Figure 2
Simulated ambulances required and transport time by week, primary analysis. To relieve all overcapacity hospitals nationally within 7 days, simulated using parameters in the primary analysis and illustrating a sharp increase in requirements during the national surge in early 2021, peaking in January 2021, and again increasing in August 2021 and January 2022. A, Ambulances required for all transfers, broken down by the state of the sending hospital. B, Ambulances required per million population for each state. C, Distribution of 1-way driving times.
Figure 3
Figure 3
Geography and length of simulated patient transfers for representative weeks. A, Geography of simulated transfers with a degree of jitter added to show the density of hospital beds in the (gray) background and relative patient flows in short (less than 1 hour 1-way driving time in yellow), long (1 to 3 hours in red), and very long (more than 3 hours in blue) transfers. B, Heatmap of origin hospitals for simulated transfers, weighted by the number of transferred patients, so that each square represents the total number of transferred patients.
Figure 4
Figure 4
Sensitivity analysis of effect of model assumptions transport resources required to relieve overcapacity hospitals in simulation during the peak week (ending January 8, 2021).
Figure E1
Figure E1
Examples of Reported Hospital Bed and Occupancy Data.Week-by-week hospital loads, from July 31, 2020, to March 18, 2022, annotated with the 10% functional mode of bed capacity used in our algorithm, for random hospitals selected from each region and size stratum. Most hospitals show significant variation, in some cases from week to week, or in others in large blocks; correlations with patient load are inconsistent. In most cases, the functional mode (dashed lines) provides a reasonable approximation of capacity.

Comment in

Similar articles

Cited by

References

    1. Rossen L.M., Branum A.M., Ahmad F.B., et al. Notes from the field: update on excess deaths associated with the COViD-19 pandemic - United States, January 26, 2020-February 27, 2021. MMWR Morb Mortal Wkly Rep. 2021;70:570–571. - PMC - PubMed
    1. Kadri S.S., Sun J., Lawandi A., et al. Association between caseload surge and COVID-19 survival in 558 U.S. hospitals, March to August 2020. Ann Intern Med. 2021;174:1240–1251. - PMC - PubMed
    1. Bravata D.M., Perkins A.J., Myers L.J., et al. association of intensive care unit patient load and demand with mortality rates in US Department of Veterans Affairs Hospitals during the COVID-19 pandemic. JAMA Netw Open. 2021;4 - PMC - PubMed
    1. Webb Hooper M., Nápoles A.M., Pérez-Stable E.J. COVID-19 and racial/ethnic disparities. JAMA. 2020;323:2466–2467. - PMC - PubMed
    1. Saffary T., Adegboye O.A., Gayawan E., et al. Analysis of COVID-19 cases’ spatial dependence in US Counties reveals health inequalities. Front Public Health. 2020;8:579190–579191. - PMC - PubMed