. 2022 Aug 8;13(1):4630.
doi: 10.1038/s41467-022-31973-2.

Acetate reprograms gut microbiota during alcohol consumption

Affiliations

Acetate reprograms gut microbiota during alcohol consumption

Cameron Martino et al. Nat Commun. .

Abstract

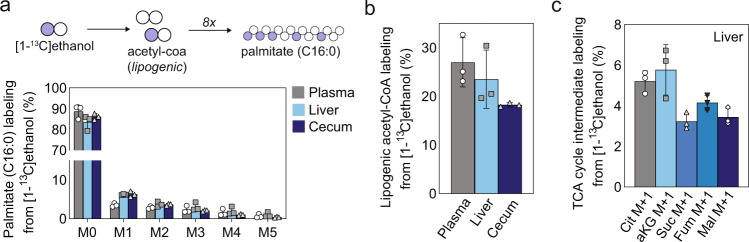
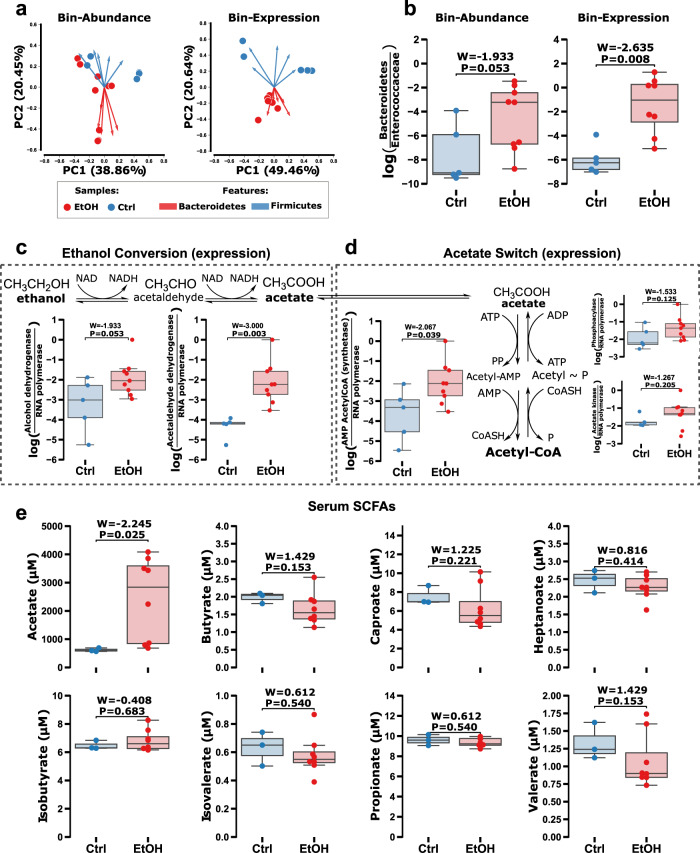
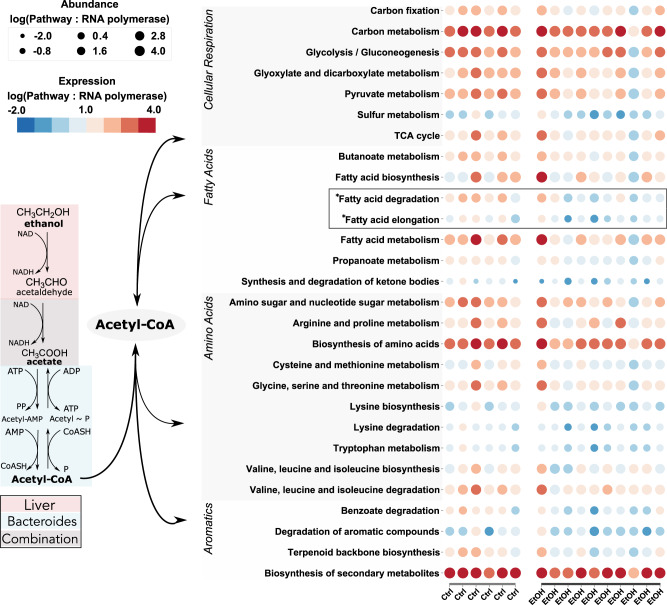
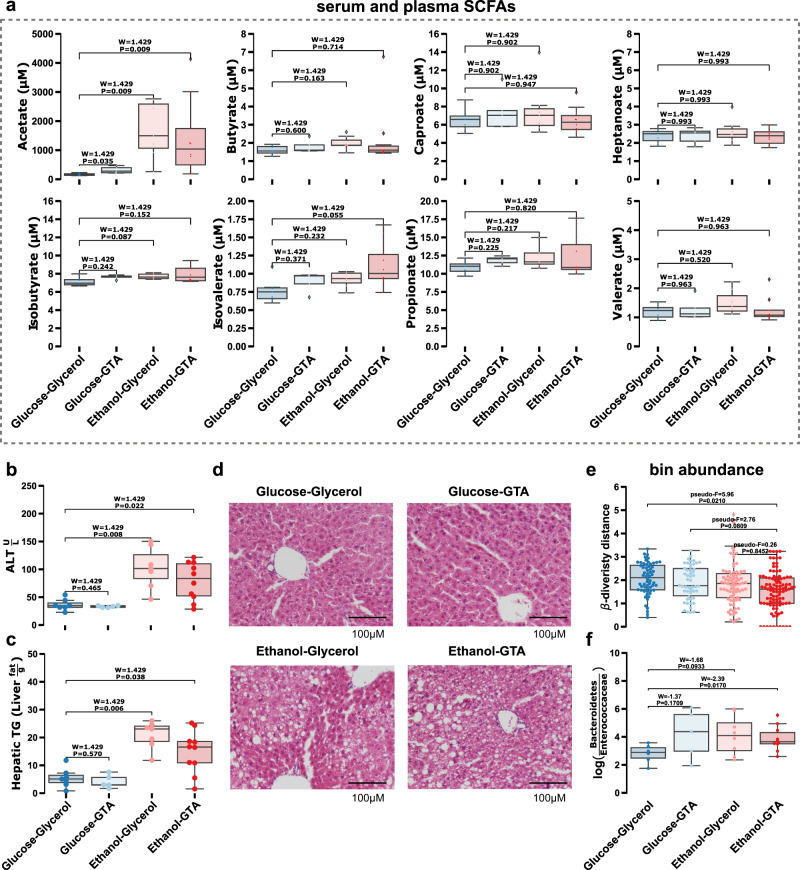
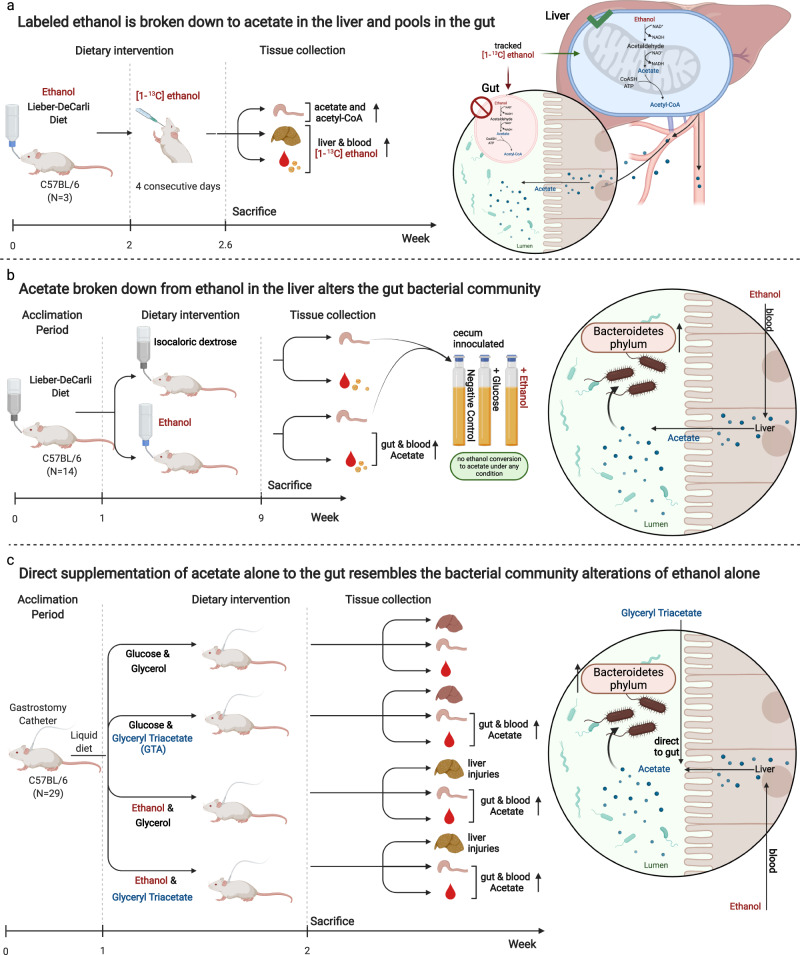
Liver damage due to chronic alcohol use is among the most prevalent liver diseases. Alcohol consumption frequency is a strong factor of microbiota variance. Here we use isotope labeled [1-13C] ethanol, metagenomics, and metatranscriptomics in ethanol-feeding and intragastric mouse models to investigate the metabolic impacts of alcohol consumption on the gut microbiota. First, we show that although stable isotope labeled [1-13C] ethanol contributes to fatty acid pools in the liver, plasma, and cecum contents of mice, there is no evidence of ethanol metabolism by gut microbiota ex vivo under anaerobic conditions. Next, we observe through metatranscriptomics that the gut microbiota responds to ethanol-feeding by activating acetate dissimilation, not by metabolizing ethanol directly. We demonstrate that blood acetate concentrations are elevated during ethanol consumption. Finally, by increasing systemic acetate levels with glyceryl triacetate supplementation, we do not observe any impact on liver disease, but do induce similar gut microbiota alterations as chronic ethanol-feeding in mice. Our results show that ethanol is not directly metabolized by the gut microbiota, and changes in the gut microbiota linked to ethanol are a side effect of elevated acetate levels. De-trending for these acetate effects may be critical for understanding gut microbiota changes that cause alcohol-related liver disease.


Conflict of interest statement

B.S. has been consulting for Ferring Research Institute, Gelesis, HOST Therabiomics, Intercept Pharmaceuticals, Mabwell Therapeutics, Patara Pharmaceuticals and Takeda. B.S.’s institution UC San Diego has received research support from Axial Biotherapeutics, BiomX, CymaBay Therapeutics, NGM Biopharmaceuticals, Prodigy Biotech and Synlogic Operating Company. B.S. is founder of Nterica Bio. UC San Diego has filed several patents with B.S. as an inventor related to this work. The remaining authors declare no competing interests.

Figures

Fig. 1
Fig. 1. Contribution of ethanol to acetate and acetyl CoA pool.
a Palmitate (C16:0) labeling from [1-13C] ethanol (y-axis), Mn represents the nth isotopologue in the mass isotope distribution (MID) for palmitate (C16:0), the most abundant fatty acid (x-axis). b Lipogenic acetyl CoA labeling from [1-13C] ethanol (N = 3). c TCA cycle intermediate labeling from [1-13C] ethanol (N = 3). Cit citrate, αKG α-ketoglutarate, Suc succinate, Fum fumarate, Mal malate. Bar plots represent the mean value and the error bars the standard error. Source data are provided as a Source Data file.
Fig. 2
Fig. 2. Acetate scavenging and Bacteroides strains are upregulated while alcohol dehydrogenation is not changed in alcohol (red) fed mice compared to controls (blue).
a Compositional biplot of Aitchison distances on bin abundance (left) and expression (right) between conditions with arrows colored by Phylum level taxonomy. b The log-ratio of Bacteroidetes and Enterococcaceae strains (y-axes) identified in biplot for bin abundance (left) and expression (right) compared between treatment groups (x-axes). c Microbial alcohol dehydrogenase (left) and acetaldehyde dehydrogenase (right) log-ratios compared between treatments (x-axes). d Conversion in acetate switch for dissimilation (left) or excretion (right) log-ratios (y-axes) compared between treatments (x-axes). Serum short-chain fatty acids (SCFAs) (y-axis) after ethanol-feeding (x-axes) for (e) acetate, (e top left) butyrate, (e bottom left) propionate, (e top right) isovalerate, and (e bottom right) valerate. Box plots represent the minimum, maximum, median, first, and third quartile values (shaded region). Significance was evaluated by a two-sided Wilcoxon rank sum test with Tukey’s HSD post-hoc test adjusted p values of less than 0.05 were shown in the figure (N = 14). Source data are provided as a Source Data file.
Fig. 3
Fig. 3. Acetate and acetaldehyde converted from ethanol in the liver converted to acetyl-CoA by Bacteroides spp. are used in gluconeogenesis.
(left) Pathways of ethanol to acetate (liver; red) and acetate/acetaldehyde conversion to acetyl-CoA (species of the Bacteroidetes phylum; blue). (right) Expression (color bar) and abundance (dot size) for pathways involved in the excretion or dissimilation of acetyl-CoA. The Gluconeogenesis pathway (bold) is upregulated in alcohol treatment compared to controls. Source data are provided as a Source Data file.
Fig. 4
Fig. 4. Treatment of glyceryl triacetate (GTA) with or without alcohol artificially enriches blood acetate and mimics microbial changes observed in ethanol only treatment but does not damage the liver.
a Whole blood Short Chain Fatty Acid (SCFA) measurements, b serum alanine transaminase (ALT), c hepatic triglyceride (TG) liver damage measurements, and d representative sections of the liver after hematoxylin and eosin staining between intragastric feeding model of continuous infusion of ethanol or glucose with or without GTA in mice (N = 4). Scale bar, 100 µM. e Beta-diversity distance from Ethanol-GTA treatment group compared between treatment groups. p value determined by pairwise PERMANOVA between treatment groups. f The log-ratio of Bacteroides and Enterococcaceae (y-axis) compared between treatments (x-axis). Box plots represent the minimum, maximum, median, first, and third quartile values (shaded region). Significance was evaluated by a two-sided Wilcoxon rank sum test with Tukey’s HSD post-hoc test adjusted p values of less than 0.05 were shown in the figure (N = 29). Source data are provided as a Source Data file.
Fig. 5
Fig. 5. Summary of three main experiments.
a Experiment one utilized oral gavage of labeled ethanol, in order to evaluate where it was being metabolized. From this, we found that ethanol is broken down in the liver to acetate which is then released into circulation with an increased pool forming in the gut. b Experiment two consistent of two stages. First, mice were fed a Lieber DeCarli diet for a total of 9 weeks after which the blood short chain fatty acids (SCFA) along with abundance and transcription of cecum microbiota were compared between conditions. Second, the cecum microbiota were collected and grown anaerobically in minimal media with or without ethanol. These experiments showed that anaerobic gut bacteria, in particular species of the phylum Bacteroidetes, do not break down ethanol to acetate but rather utilize acetate produced from the liver for gluconeogenesis. c Experiment three replicated acetate levels found in the gut during oral gavage of ethanol through the intragastric infusion of Glyceryl Triacetate (GTA) which increases gut acetate levels but not blood. For comparison, four conditions were performed being glucose vs. ethanol and glycerol vs. GTA in combination. The gut microbiota abundance, liver damage, blood SCFA, and gut acetate levels were measured. This experiment demonstrated that GTA causes similar alterations in the gut microbiome to that of ethanol, with increases in the phylum Bacteroidetes, but did not cause liver damage. Created with BioRender.com.

References

    1. Rehm J, Samokhvalov AV, Shield KD. Global burden of alcoholic liver diseases. J. Hepatol. 2013;59:160–168. doi: 10.1016/j.jhep.2013.03.007. - DOI - PubMed
    1. Pimpin L, et al. Burden of liver disease in Europe: epidemiology and analysis of risk factors to identify prevention policies. J. Hepatol. 2018;69:718–735. doi: 10.1016/j.jhep.2018.05.011. - DOI - PubMed
    1. Halsted CH, Robles EA, Mezey E. Distribution of ethanol in the human gastrointestinal tract. Am. J. Clin. Nutr. 1973;26:831–834. doi: 10.1093/ajcn/26.8.831. - DOI - PubMed
    1. Mutlu EA, et al. Colonic microbiome is altered in alcoholism. Am. J. Physiol. Gastrointest. Liver Physiol. 2012;302:G966–G978. doi: 10.1152/ajpgi.00380.2011. - DOI - PMC - PubMed
    1. Leclercq S, et al. Intestinal permeability, gut-bacterial dysbiosis, and behavioral markers of alcohol-dependence severity. Proc. Natl Acad. Sci. USA. 2014;111:E4485–E4493. doi: 10.1073/pnas.1415174111. - DOI - PMC - PubMed

Publication types