. 2022 Aug 8;13(1):4613.
doi: 10.1038/s41467-022-32247-7.

A neural circuit for wind-guided olfactory navigation

Affiliations

A neural circuit for wind-guided olfactory navigation

Andrew M M Matheson et al. Nat Commun. .

Abstract

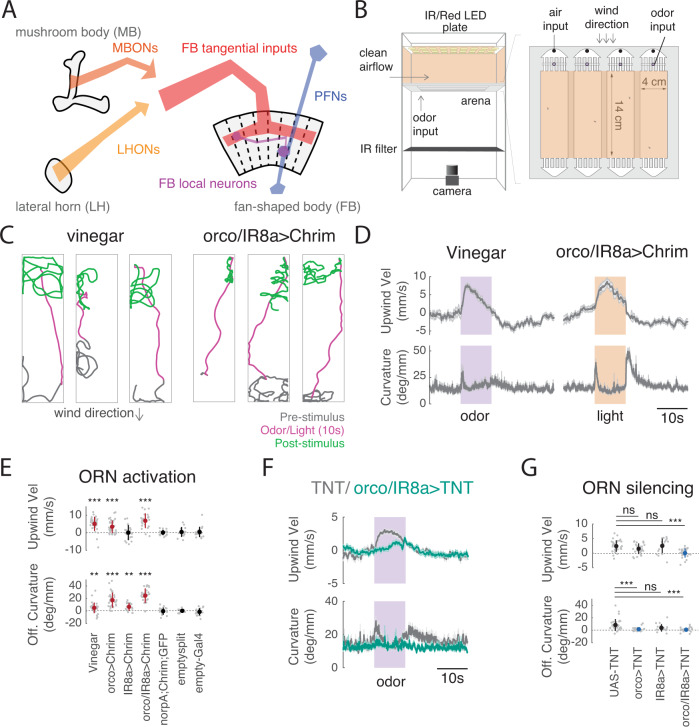
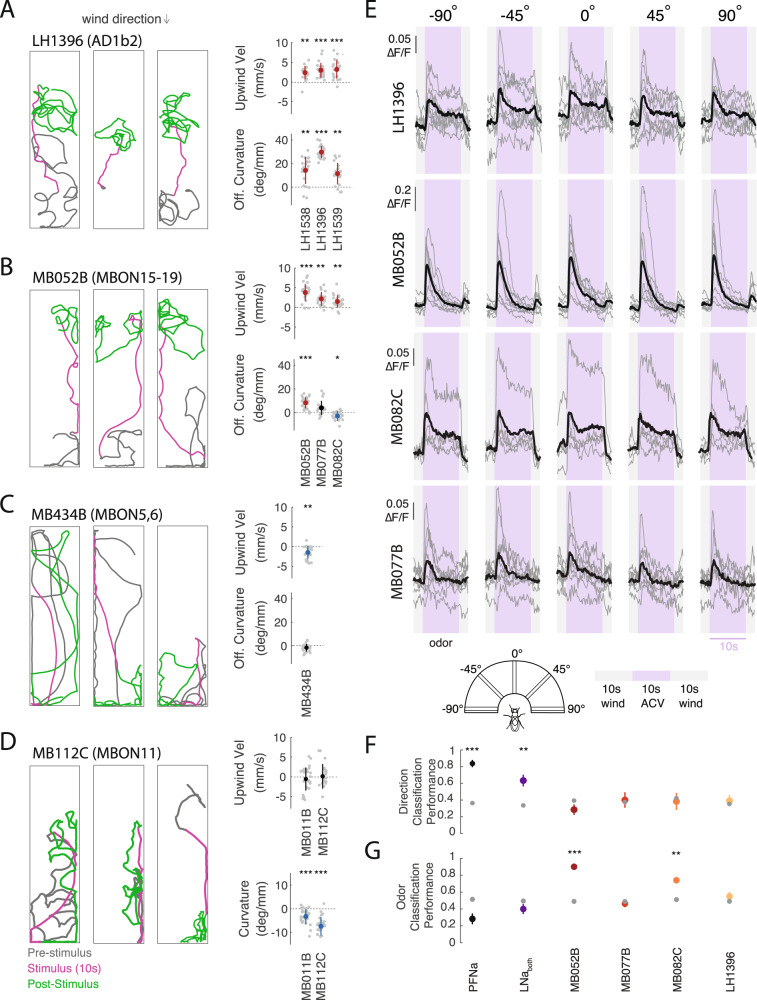
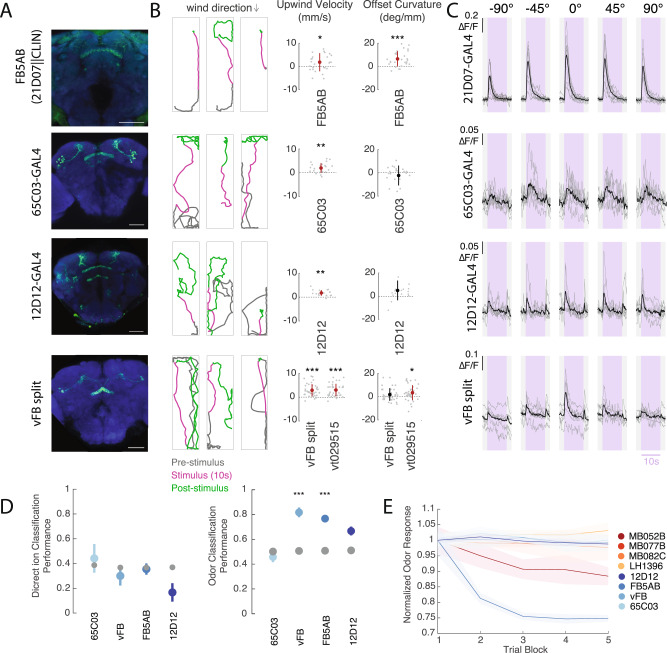
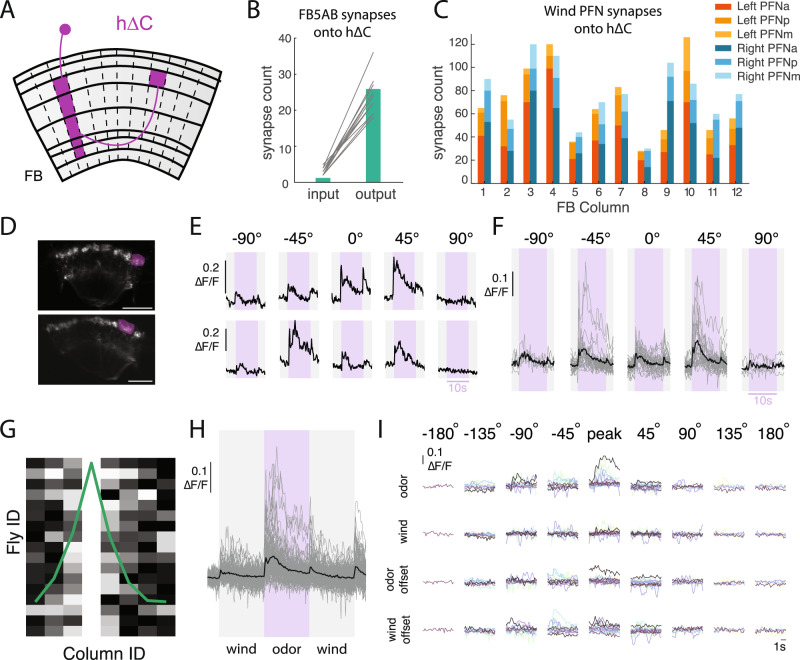
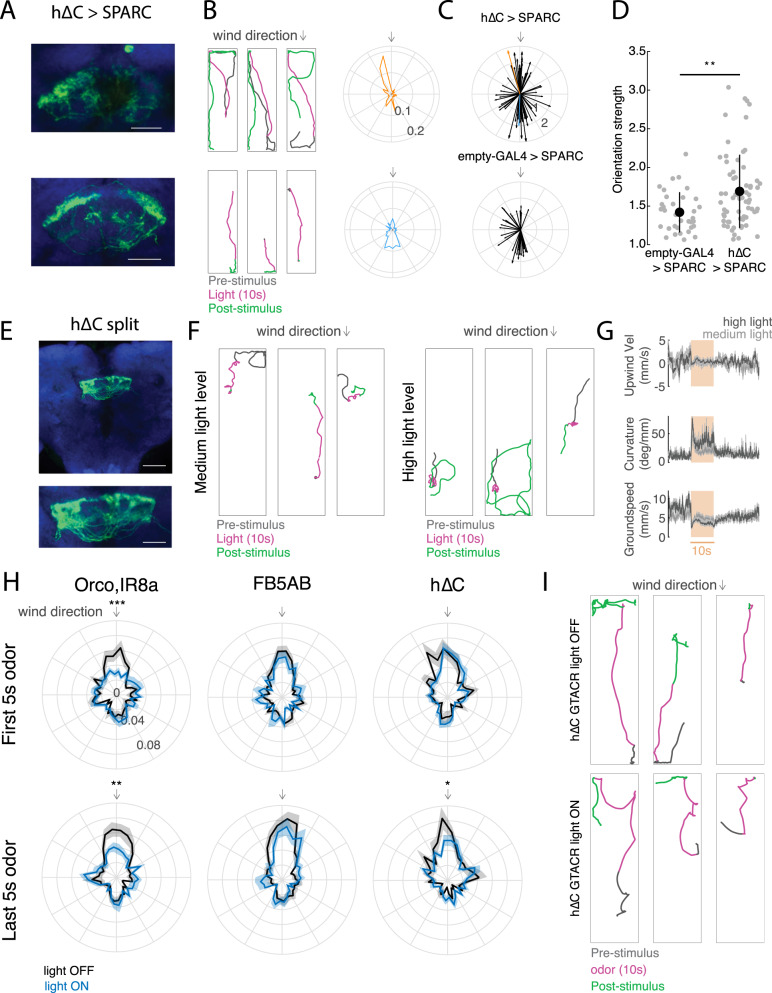
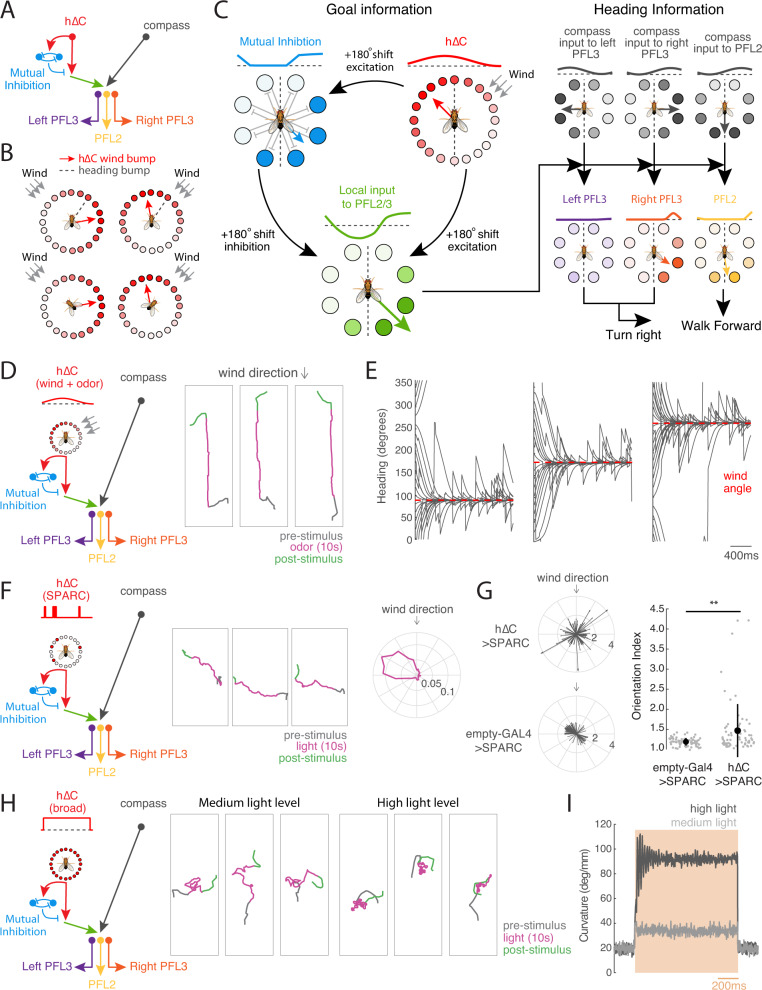
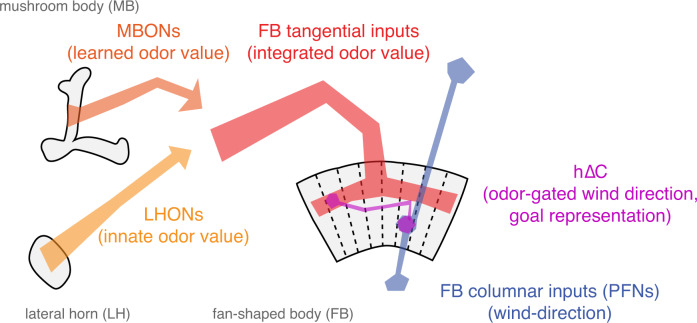
To navigate towards a food source, animals frequently combine odor cues about source identity with wind direction cues about source location. Where and how these two cues are integrated to support navigation is unclear. Here we describe a pathway to the Drosophila fan-shaped body that encodes attractive odor and promotes upwind navigation. We show that neurons throughout this pathway encode odor, but not wind direction. Using connectomics, we identify fan-shaped body local neurons called h∆C that receive input from this odor pathway and a previously described wind pathway. We show that h∆C neurons exhibit odor-gated, wind direction-tuned activity, that sparse activation of h∆C neurons promotes navigation in a reproducible direction, and that h∆C activity is required for persistent upwind orientation during odor. Based on connectome data, we develop a computational model showing how h∆C activity can promote navigation towards a goal such as an upwind odor source. Our results suggest that odor and wind cues are processed by separate pathways and integrated within the fan-shaped body to support goal-directed navigation.


Conflict of interest statement

The authors declare no competing interests.

Figures

Fig. 1
Fig. 1. A behavioral paradigm for investigating odor-evoked wind navigation.
A Brain regions and neuronal classes investigated in this study. The mushroom body (MB) and lateral horn (LH) are higher-order olfactory centers involved in learned and innate olfactory processing, respectively. The fan-shaped body (FB) is part of the fly navigation center called the Central Complex (CX). Output neurons of the MB and LH (MBONs and LHONs) provide input directly or indirectly to FB tangential inputs. Columnar PFNs provide wind direction input to the FB. FB local neurons receive input both from FB tangential inputs and from columnar PFNs. B Schematic of top and side view of the behavioral apparatus showing IR illumination (850 nm), red activation light (626 nm, 26 µW/mm2), imaging camera, behavior chambers, and air and odor inputs. C Navigation behaviors evoked by odor and by optogenetic stimulation of olfactory receptor neurons. Example walking trajectories in response to 1% vinegar (left) and optogenetic activation of orco+ and IR8a+ ORNs (right), before (gray), during (magenta), and after (green) 10 s of odor (left) or light (right). Constant wind at ~12 cm/s. D Time course of upwind velocity and curvature (angular/forward velocity) in response to odor or optogenetic stimulation, averaged across flies (mean ± SEM, vinegar N = 26 flies, ORN activation N =  24 flies). Shaded area: stimulation period, 10 s vinegar (purple) or light (orange). E Upwind velocity and OFF curvature (average change from baseline for single flies) in response to stimulation for each genotype/condition. Mean ± STD overlaid; red indicates a significant increase. Vinegar (N = 31), orco>Chrimson (N = 31), and or/IR8a > Chrimson (N = 24) stimulation all drove significant increases in upwind velocity (0–5 s after stimulus ON, vinegar: p = 1.0997e−05, orco: p = 3.8672e−05, orco,IR8a: 2.6691e−05) and OFF curvature (0–2 s after stimulus OFF, vinegar: p = 1.9619e−04, orco: p = 1.1742e−06, orco,IR8a: p = 2.3518e−05). Light activation of flies carrying only the parental effector (norpA;UAS-Chrimson, N = 16), empty-GAL4 > Chrimson (N = 19), or empty-split GAL4 > Chrimson (N = 14) did not increase upwind velocity (parent: p = 0.7174, empty-split: p = 0.6874, empty-gal4: p = 0.6698) or OFF curvature (parent: p = 0.7960, empty-split: p = 0.3144,empty gal4: p=0.7354). IR8a > Chrimson stimulation did not increase upwind velocity (p = 0.3507) but did increase OFF curvature (p = 4.4934e−04). All statistics used two-sided Wilcoxon signed rank test. F Time course of upwind velocity and curvature in response to odor in flies with ORNs silenced (orco/IR8a > TNT, mean ± SEM, N = 26, teal) versus control (UAS-TNT, N = 31, gray). G Upwind velocity and OFF curvature for silencing experiments, quantified as in E. Mean±STD overlaid. Blue overlay represents significant decrease compared to control (UAS-TNT). (Two-sided Mann–Whitney U test compared to UAS-TNT (N = 31) control, upwind velocity: orco (N = 25): p = 0.10627, ir8a (N = 18): p = 0.40095, orco,ir8a (N = 26): p = 0.00010917, OFF curvature: orco: p = 3.2758e-05, IR8a: p = 0.037135, orco,IR8a: p = 4.2482e−05). All statistics corrected using the Bonferroni method. Source data for panels that show statistical tests for this and all subsequent figures are provided as a Source Data file.
Fig. 2
Fig. 2. LH and MB output neurons promote wind navigation behavior but encode odor independent of wind direction.
A Optogenetic activation of AD1b2 LHONs drives upwind movement and OFF search. Left: Example behavioral trajectories driven by optogenetic activation of AD1b2 neurons labeled by LH1396 (left). Right: Upwind velocity and OFF curvature (as in Fig. 1E) for three lines labeling AD1b2 LHONs: LH1538 (N = 21 flies), LH1539 (N = 22), LH1396 (N = 24). All three lines significantly increase both upwind velocity and OFF curvature (upwind: p =  2.4548e−04, 7.9941e−05, 1.8215e−05; OFF-curvature: p =  3.6712e−04, 1.7699e−04, 1.8215e−05 respectively). B Optogenetic activation of attraction-promoting MBONs drives upwind movement and OFF search. Left: Example behavioral trajectories driven by optogenetic activation of MBONs 15–19 labeled by MB052B (left). Right: Upwind velocity and OFF curvature for three cholinergic MB lines: MB052B (N = 27), MB077B (N = 21), and MB082C (N = 24). Each line labels distinct MBONs. All increase upwind velocity (p = 1.0997e−05, 1.2267e−04, 2.0378e−04) while MB052B increases OFF curvature (p = 6.2811e−06), MB077B does not (p = 0.0046) and MB082C reduced OFF curvature (p = 0.0018). C Activation of aversion-promoting MBONs promotes downwind movement. Left: Example behavioral trajectories in response to optogenetic activation of glutamatergic MBONs 5 and 6, labeled by the line MB434B (left). Right: Upwind velocity and OFF curvature for MB434B (N = 24). MB434B significantly decreases upwind velocity (p = 2.2806e−04) but not OFF curvature (p = 0.0258). D MBONs promoting straighter trajectories. Example behavioral trajectories in response to optogenetic activation of the GABAergic MBON11, labeled by the line MB112C (left). Right: Curvature during stimulus (from 2 to 5 s after stimulus ON) for MB112C (N = 29), and MB011B (N = 28). MB112C and MB011B significantly reduce curvature during the stimulus (MB112C: p = 3.5150e−06, MB011B: p = 3.407e−05). E Upwind-promoting LHONs and MBONs encode odor independent of wind direction. Calcium responses (∆F/F) measured in four lines that all drove upwind movement. Responses were measured in LH dendritic processes of LH1396 (N = 8 flies), in output processes of MB052B (N = 9 flies), MB082C (N = 5), MB077B (N = 8). All responses measured using GCaMP6f in response to odor (10% vinegar, purple) and wind (gray) delivered from five directions (schematic). Gray traces represent individual flies, black traces represent mean across flies. F Performance of a wind direction (left, center, right) tree classifier trained on the first 5 s of the odor period. Gray dots represent a classifier trained with the same data and shuffled labels. PFNa (N = 11) p = 3.5063e−09, LNa (N = 5) p = 5.3035e−04, MB052B (N = 9) p = 0.1044, MB077B (N = 8) p =  0.7911, MB082C(N = 5) p = 0.7116, LH1396 (N = 8) p = 0.6229. G Performance of an odor versus wind classifier trained on the first 5 s of wind or odor. Gray dots represent a classifier trained with the same data and shuffled labels. PFNa (N = 11) p = 0.0657, LNa (N = 5) p = 0.3231, MB052B (N = 9) p =  2.7204e−08, MB077B (N = 8) p = 0.4104, MB082C (N = 5) p =  4.2903e−04, LH1396 (N = 8) p = 0.0909. All statistics in AD used two-sided Wilcoxon signed rank test and show mean ± STD. Classifiers in F, G used two-sided Student’s t-tests and show mean ± SEM. All statistics corrected using the Bonferroni method.
Fig. 3
Fig. 3. A set of FB tangential inputs promote wind navigation behavior.
A Trans-synaptic tracing reveals connections between upwind-promoting MB/LH neurons and FB tangential neurons. Trans-tango signal driven by LH1396-GAL4 (top) and MB052B-GAL4 (bottom). Trans-synaptic signal (magenta) was observed in horizontal layers of the dorsal FB in both cases. Neuropil is shown in blue. The FB is outlined in gray. Scale bar 50 µm. B Optogenetic activation results for FB inputs, including dorsal tangential inputs, ventral tangential inputs, columnar PFNs, and empty-GAL4 and empty-split-GAL4 controls. Two dorsal inputs and two ventral inputs drove significant increases in upwind velocity. Control lines drove no significant change in any measured behavioral parameter (see Methods). C Optogenetic activation results for split GAL4 lines labeling dorsal and ventral tangential FB inputs, and for a line labeling FB5AB (21D07-GAL4||CLIN). One split-GAL4 line labeling ventral FB tangential inputs drove a significant increase in upwind velocity. Legend applies to B and C. D Schematic showing feedforward connectivity onto FB5AB from three upwind-promoting MBONs (MBON 19, MBON 12, MBON 13), one upwind-promoting LHON (AD1b2), and one downwind-promoting MBON (MBON05). Pathways converge onto FB5AB directly or indirectly through LHCENT3 and LHPV5e1. Numbers represent the average synaptic weight between each cell type and the right-sided LHCENT3 (id: 487144598), LHPV5e1 (id: 328611004), or right-sided FB5AB (id: 5813047763). E Number of parallel lateral horn pathways from vinegar-responsive projection neurons (estimated from ORN responses in) to each FB tangential input neuron. Pathways consist of two synapses: projection neuron to lateral horn neuron, and lateral horn neuron to FB tangential input neuron. Blue bar represents the number of pathways converging onto FB5AB. F Upwind displacement responses to optogenetic activation of FB tangential input lines outlast the stimulus while responses to activation of MB/LH lines do not. Timecourses of average relative y-displacement (arena position) across flies, following stimulus OFF for each line. Individual fly’s average positions across trials were set to 0 and relative change in position for 10 s following stimulus OFF was averaged across flies for each genotype. All statistics in B, C used two-sided Wilcoxon signed rank test and corrected using the Bonferroni method. Legend displays equivalent uncorrected alpha level.
Fig. 4
Fig. 4. Multiple FB tangential inputs respond to attractive odor and drive upwind movement.
A Confocal images of lines that showed FB responses to vinegar and drove upwind movement when activated. Each image shows stain for mVenus expressed with UAS-Chrimson in flies of the same genotype used for activation experiments (abbreviated genotypes shown at left). Scale bar 50 µm. B Example behavioral trajectories and quantification of upwind velocity and OFF curvature in each line shown at left. For FB5AB only light intensity was 34 µW/mm2. For all drivers, upwind velocity was quantified over 0–10 s after odor ON. Right: upwind velocity, OFF curvature 21D07||CLIN (N = 27): p = 0.0306, 8.1448e−05, 65C03 (N = 24): p = 4.1850e−04, 0.5841, 12D12 (N = 19): p = 1.8218e−04, 0.0055 vFB split (N = 38): p = 3.4153e−07, 0.1155, VT029515-GAL4 (N = 38): p = 4.3255e−07, 0.0024). C Calcium responses in each line shown at left in response to odor delivered from five different directions (as in Fig. 2E). Shaded purple region indicates odor period. Gray lines represent individual flies and black represents the mean across flies: 21D07 (N = 9), 65C03 (N = 7), 12D12 (N = 6), vFB split (N = 6 flies). D Performance of tree classifiers for wind direction (left) and odor presence (right) for FB tangential inputs. Gray dots represent classifiers trained with the same data and shuffled labels. Left: Performance of wind direction (left, center, right) classifier trained on the first 5 s of odor period. 65C03 p = 0.6450, vFB p = 0.4100, FB5AB p = 0.7882, 12D12 p = 0.0177. Right: Performance of odor versus wind classifier trained on first 5 s of wind and odor ON. 65C03(N = 7) p = 0.0203, vFB (N = 6) p = 1.0934e−06, FB5AB (N = 9) p = 2.8375e−04, 12D12 (N = 6) p = 0.0383. E Decay of fluorescence response to odor over trial blocks. The response to each trial block was calculated as the average odor response to 5 consecutive trials (each from one of the directions), averaged across all flies of a genotype. Response magnitude was normalized by the average response to the first block for each line. Shaded area represents standard error across flies. Statistics in B used two-sided Wilcoxon signed rank test and show mean ± STD. Classifiers in D used two-sided Student’s t-tests and show mean ± SEM. All statistics corrected using the Bonferroni method.
Fig. 5
Fig. 5. h∆C neurons exhibit odor-modulated wind direction tuning.
A Schematic of an individual h∆C neuron (purple). 20 h∆C neurons tile the FB receiving input in layers 2–6 in a single column, and projecting halfway across the FB to output in layer 6. B Number of FB5AB synapses onto the input and output tufts of h∆C for every FB5AB-h∆C pair. C Number of synapses from left and right wind-sensitive PFNs (PFNa, PFNp, and PFNm, tuned to 45° left and right respectively) onto h∆C neurons, summed within columns. D 2-photon image of tdTOM expressed with GCaMP6f under VT062617-GAL4 which labels h∆C neurons. Purple ROI drawn around output tuft of a single column for analysis. Scale bar 25 µm. E Odor responses of two example flies/columns showing directionally tuned odor responses. F Summary of all measured odor responses >2STD above baseline across columns and flies. Gray traces represent individual columns and black traces represent mean across columns. G Directional responses are restricted to nearby columns: maximally responsive direction for each fly, where data are phase shifted so maximum columns align at column 4. Each fly normalized to maximum column response. H Summary of wind and odor responses for all measured responses >2STD above baseline across columns and directions. Responses to odor are stronger than those to wind ON, odor OFF and wind OFF (n = 87 responsive columns from N = 16 Flies). I Summary of wind and odor phase activity of maximally responsive column, aligned to maximally responsive direction. Data are shifted to be aligned to the maximal direction and each row represents different stimulus period. Each color represents a different fly (N = 16).
Fig. 6
Fig. 6. Role of h∆C neurons in navigation behavior.
A Anatomical and behavior data from two representative h∆C > SPARC flies. Left: confocal images of tdTomato expressed with UAS-SPARC2-I-Chrimson. Scale bar 25 µm. B Behavior of two representative h∆C > SPARC flies from A, Left: example behavioral trajectories of flies before, during, and after optogenetic activation. Right: orientation histograms for each fly for the period 2–6 s after light ON. Radial axis represents probability. C Preferred orientations across all flies, where the vector direction corresponds to the preferred direction and the vector strength corresponds to the orientation index (see Methods, Fig. S6A). Top: h∆C > SPARC. Representative flies from A, B) are shown in orange and blue. Bottom: empty-GAL4 > SPARC. D h∆C > SPARC flies (N = 65) show stronger oriented walking than empty-GAL4 > SPARC2 flies (N = 34, see Fig. S6A for Methods, mean ± STD, two-sided ranksum test p = 0.0035). E Confocal image of hΔC split > Chrimson. Scale bar 50 µm (top), and 25 µm (bottom). F Example behavioral trajectories driven by hΔC split activation with 26 µW/mm2 light (left) or 34 µW/mm2 light (right). G Upwind velocity, curvature, and groundspeed (mean ± SEM) across hΔC split > Chrimson flies before, during, and after optogenetic activation using 26 µW/mm2 light (light gray, N = 32) or 34 µW/mm2 light (dark gray, N = 14). H Optogenetic inactivation of h∆C neurons using GtACR disrupts persistent upwind orientation. Each plot shows orientation histograms during light-evoked silencing (blue) compared to no-light control (black) for the first 5 s of odor (top) and last 5 s of odor (bottom). Shaded regions represent SEM. Optogenetic silencing of ORNs (orco,IR8a, N = 24) significantly reduces the probability of orienting upwind (±10°) during both phases (p = 9.2724e−04 early, 0.0090 late), while silencing of FB5AB (N = 32) does not (p = 0.3848 early, p = 0.3259 late). Silencing of h∆C neurons (N = 24) reduces upwind orientation only during the late phase (p = 0.8512 early, p = 0.0475 late). Two-sided t-test without correction for multiple comparisons. I Example behavioral trajectories in h∆C > GtACR flies in response to odor. Top: blue light off (non-silenced). Bottom: blue light on (h∆C neurons silenced).
Fig. 7
Fig. 7. A model of FB circuitry that translates h∆C activity into goal-directed walking.
A Overview of cell types and information flow in an FB circuit model. Odor gates a wind direction signal in hΔC neurons (red), which is processed by a mutual inhibition circuit (blue) as well as fed forward to PFL output neurons (green). PFL neurons (purple, orange, yellow) integrate goal information from h∆C with heading information from compass neurons (black) to control turning (PFL3) and forward velocity (PFL2). B Modeled allocentric wind representation in hΔC neurons, shown as a bump of activity (circles) and as a vector (red arrow). Heading vector in gray. Leftward rotations of the fly cause rightward rotations of the heading vector. Wind and heading vectors align when the fly is pointed upwind (bottom row). Leftward wind leads to a wind vector right of the heading vector, while rightward wind leads to a wind vector to the left (top row). An alternate wind representation is depicted in Fig. S7A. C Model circuit diagram showing transformation of a wind bump in h∆C neurons into upwind movement by PFL3 and PFL2 neurons. Activity patterns across each population are represented as a bump of activity across the FB (lines and circles, dotted line = 0 activity), and as a vector. An odor-gated wind bump in h∆C neurons (red) is fed forward directly to PFL2/3 neurons (green) and indirectly via a mutual inhibition circuit (blue). 180° shifts in the output of each populations transform the wind bump in h∆C into a stable bump in PFL2/3 (green). PFL3 (purple/orange) receive a heading bump from the compass system (black) shifted by 90° ipsilateral, as well as goal input from h∆C (green). Overlapping bumps lead to constructive summation, shown here for right PFL3 (orange) driving right turns. Non-overlapping bumps lead to destructive summation, shown here for left PFL3 driving left turns. Total turning represents the sum of left and right PFL3 activity. PFL2 (yellow) receive a heading bump from the compass system (black) shifted by 180°, together with goal input from h∆C (green). Overlapping bumps lead to constructive summation that promotes faster walking. Model causes the fly to turn until the goal and heading bumps align, and to increase speed when bumps are aligned. D Simulated circuit activity and trajectories when odor gates the expression of an allocentric wind bump as in B during odor. Example trajectories (right) shown for three model flies. E Headings of simulated flies with different initial headings in response to odorized wind arriving from 90° (left), 180° (center), and 270° (right). Heading converges to upwind despite turning noise which drives the fly off course. F Simulated circuit activity and trajectories during sparse optogenetic activation (random 15% of hΔC neurons on during light). Example trajectories (center) are shown for one model fly on three different trials in which the same h∆C neurons were activated. Heading converges to the same reproducible walking direction. Orientation histogram (right) for model flies with different h∆C activation patterns. G Preferred orientations across simulated h∆C > SPARC flies (top) and empty-GAL4 > SPARC flies (bottom). Empty-GAL4 > SPARC (N = 72) flies were simulated by setting h∆C activity to zero. Simulated h∆C > SPARC (N = 72) flies have stronger orientation indices than simulated empty-GAL4 > SPARC flies (mean ± STD, two-sided ranksum test p = 0.0032). H Simulated circuit activity and trajectories during broad optogenetic activation. All hΔC neurons activated equally during light at medium (center) or high level (right). I Average curvature across simulated flies before, during, and after broad optogenetic activation using medium (light gray) or high light (dark gray), showing an intensity-dependent increase.
Fig. 8
Fig. 8. Conceptual model of sensory integration for olfactory navigation in the Drosophila central brain.
Conceptual model of central olfactory navigation circuitry as suggested by this and previous studies. MBONs, LHONs, and FB tangential inputs promote wind navigation and encode odor information but not wind direction information. FB tangential inputs are a likely locus where learned and innate odor information may be integrated to drive behavior. In contrast, FB columnar inputs (PFNs) encode wind direction but not odor presence. h∆C neurons receive input both from directionally tuned PFNs at their dendrites and from odor-tuned FB tangential inputs at their axons. They encode a fly-specific wind direction signal that can be modulated ON by odor. Sparse activation of h∆C neurons can drive movement in a reproducible direction and activity in these neurons is required for sustained upwind orientation during odor. Our data support a model in which columnar and tangential inputs to the FB encode directional and non-directional information respectively, and where tangential input can gate the expression of directional information in local neurons outputs to specify navigational goals.

References

    1. Murlis J, Elkinton JS, Carde RT. Odor plumes and how insects use them. Annu. Rev. Entomol. 1992;37:505–532. doi: 10.1146/annurev.en.37.010192.002445. - DOI
    1. Cardé RT, Willis MA. Navigational strategies used by insects to find distant, wind-borne sources of odor. J. Chem. Ecol. 2008;34:854–866. doi: 10.1007/s10886-008-9484-5. - DOI - PubMed
    1. Crimaldi JP, Koseff JR. High-resolution measurements of the spatial and temporal scalar structure of a turbulent plume. Exp. Fluids. 2001;31:90–102. doi: 10.1007/s003480000263. - DOI
    1. Webster DR, Weissburg MJ. Chemosensory guidance cues in a turbulent chemical odor plume. Limnol. Oceanogr. 2001;46:1034–1047. doi: 10.4319/lo.2001.46.5.1034. - DOI
    1. Celani A, Villermaux E, Vergassola M. Odor landscapes in turbulent environments. Phys. Rev. X. 2014;4:041015.

Publication types

LinkOut - more resources