. 2022 Aug 8;13(8):693.
doi: 10.1038/s41419-022-05138-4.

GSDMD-dependent neutrophil extracellular traps promote macrophage-to-myofibroblast transition and renal fibrosis in obstructive nephropathy

Affiliations

GSDMD-dependent neutrophil extracellular traps promote macrophage-to-myofibroblast transition and renal fibrosis in obstructive nephropathy

Yujia Wang et al. Cell Death Dis. .

Abstract

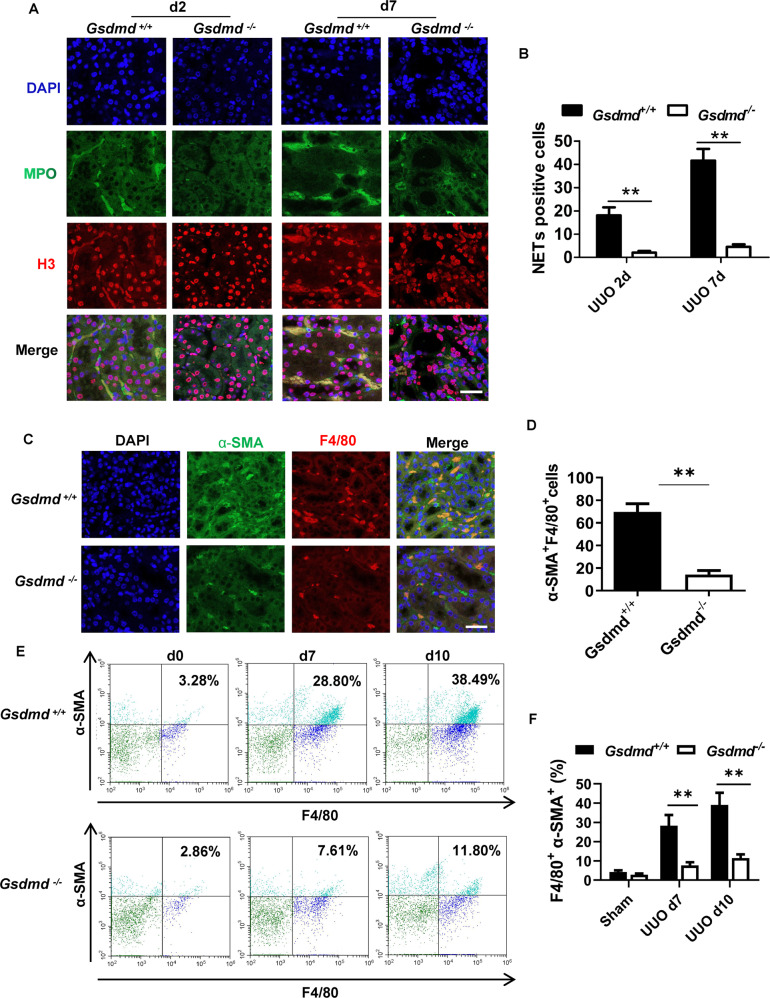
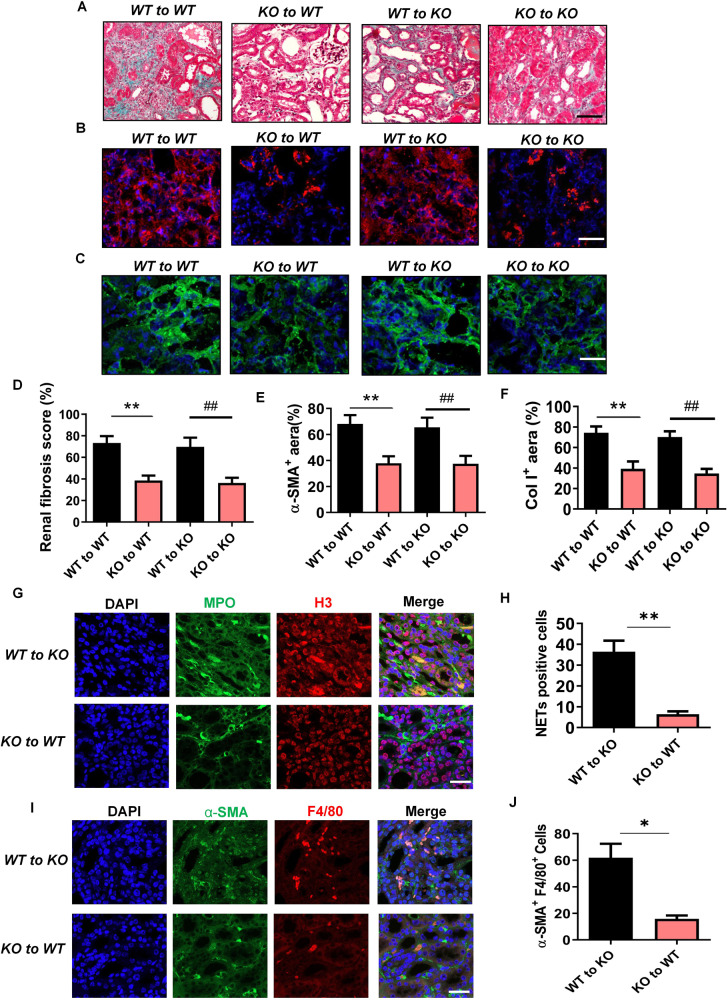
Renal fibrosis is a common consequence of various progressive nephropathies, including obstructive nephropathy, and ultimately leads to kidney failure. Infiltration of inflammatory cells is a prominent feature of renal injury after draining blockages from the kidney, and correlates closely with the development of renal fibrosis. However, the underlying molecular mechanism behind the promotion of renal fibrosis by inflammatory cells remains unclear. Herein, we showed that unilateral ureteral obstruction (UUO) induced Gasdermin D (GSDMD) activation in neutrophils, abundant neutrophil extracellular traps (NETs) formation and macrophage-to-myofibroblast transition (MMT) characterized by α-smooth muscle actin (α-SMA) expression in macrophages. Gsdmd deletion significantly reduced infiltration of inflammatory cells in the kidneys and inhibited NETs formation, MMT and thereby renal fibrosis. Chimera studies confirmed that Gsdmd deletion in bone marrow-derived cells, instead of renal parenchymal cells, provided protection against renal fibrosis. Further, specific deletion of Gsdmd in neutrophils instead of macrophages protected the kidney from undergoing fibrosis after UUO. Single-cell RNA sequencing identified robust crosstalk between neutrophils and macrophages. In vitro, GSDMD-dependent NETs triggered p65 translocation to the nucleus, which boosted the production of inflammatory cytokines and α-SMA expression in macrophages by activating TGF-β1/Smad pathway. In addition, we demonstrated that caspase-11, that could cleave GSDMD, was required for NETs formation and renal fibrosis after UUO. Collectively, our findings demonstrate that caspase-11/GSDMD-dependent NETs promote renal fibrosis by facilitating inflammation and MMT, therefore highlighting the role and mechanisms of NETs in renal fibrosis.


Conflict of interest statement

The authors declare no competing interests.

Figures

Fig. 1
Fig. 1. Mice with Gsdmd deficiency had ameliorated renal fibrosis after UUO.
A Representative images of Masson trichrome staining of kidney sections. Kidneys were isolated from Gsdmd+/+ mice and Gsdmd−/− mice on day 13 after UUO. Scale bar: 100 μm. B Quantification of renal fibrosis scores evaluated by Masson trichrome staining. n = 6. C, E Representative images of immunofluorescence staining of kidney sections, showing the expression of α-smooth muscle actin (α-SMA) C and type-I collagen (Col I) E. DAPI was used for nuclear staining. Scale bar: 100 μm. D, F Quantification of α-SMA D and Col I F expression by immunofluorescence. n = 6. G Western blot analysis for α-SMA and Col I expression of kidney tissue lysates, which were isolated on day 7 and 13 after UUO. GAPDH was used as a loading control. n = 4. H Western blot showing GSDMD cleavage in kidney after UUO. Kidney tissue lysates were isolated on day 0, 7, and 13 after UUO. The knockout efficiency of Gsdmd was also confirmed, and the cleaved GSDMD-N could be observed in WT kidneys. n = 4. **P < 0.01.
Fig. 2
Fig. 2. Ablation of Gsdmd reduced the infiltration of neutrophils and macrophages in the kidneys after UUO.
A, C Flow cytometry was used to evaluate the cellular dynamics of neutrophils (Ly6G+) and macrophages (F4/80+) infiltration in the kidneys of Gsdmd+/+ mice and Gsdmd−/− mice on day 0, 2, 5, and 10 after UUO. Representative images of flow cytometry analysis were shown in A and C. B, D Quantification of the percentage of neutrophils (Ly6G+) and macrophages (F4/80+) infiltration. n = 3. E, G Representative images of immunohistochemistry staining with F4/80+ E and Ly6G+ G. Scale bar: 100 μm. F, H Quantification of the number of F4/80+ and Ly6G+ cells per hpf. n = 5. **P < 0.01.
Fig. 3
Fig. 3. Single-cell sequencing showed macrophage-to-myofibroblast transition, GSDMD upregulation, NETs activation in neutrophils and activated crosstalk between neutrophils and macrophages in the obstructive kidneys.
AC t-distributed stochastic neighbor embedding (tSNE) plot of cell clusters identified on the basis of the expression of highly variable genes in the kidneys from control group (n = 2), obstructive kidney on day 2 (n = 2) and day 10 (n = 2) after UUO. tSNE analysis showed 11 distinct clusters of renal cells in control A and 13 distinct clusters in UUO C mice. The distribution of cell clusters was consistent between obstructive kidney on day 2 and day 10 B. DCTs: distal convoluted tubules; ECs: endothelial cells; Fibro: fibroblast; Macro: macrophage; Myofibro: myofibroblast; Neutro: neutrophil; NK: natural killer cell; Podo: podocyte; PTCs: proximal tubular cells; DC: dentritic cell; TE: transitional epithelia. D, E Unsupervised trajectory of macrophage-to-myofibroblast transition along pseudotime using Monocle. F Heatmap of top 20 genes significantly changed in macrophage-to-myofibroblast transition in pseudotime. Each row represents a gene. The left and right end corresponds to the starting point (macrophage) and the ending point (myofibroblast) respectively. Color scheme represents the z-score distribution from −3.0 to 3.0. G Network visualization of the ligands expressed by macrophage and the other cells expressing the cognate receptors primed to receive the signal. Numbers indicate the quantity of ligand-receptor pairs for each intercellular crosstalk. H, I Violin plots of log-transformed gene expression of GSDMD in each cell population of control kidney H and obstructive kidney on day 2 and 10 after UUO I. J, K Comparison of gene expression of GSDMD in neutrophils J and macrophages K between control kidney and obstructive kidney on day 2 and 10 after UUO. L Network visualization of the ligands expressed by neutrophil and the other cells expressing the cognate receptors primed to receive the signal. Numbers indicate the quantity of ligand-receptor pairs for each intercellular crosstalk. M Heat map showing the difference of NETs-associated genes expression in neutrophils among control kidney and obstructive kidney on day 2 and 10 after UUO. The colors of yellow to blue represented alterations from high expression to low expression. *P < 0.05; ***P < 0.001.
Fig. 4
Fig. 4. Deletion of Gsdmd suppressed NETs formation and α-SMA expression in macrophages in kidney after UUO.
A Representative images of immunofluorescence staining of kidney sections, showing the expression of Histone-H3 and MPO. Kidneys were isolated from Gsdmd+/+ mice and Gsdmd−/− mice on day 2 and 7 after UUO. Scale bar: 100 μm. B Quantification of cells undergoing NETs formation characterized by Histone-H3 and MPO double positive. n = 6. C Representative images of immunofluorescence staining of kidney sections, showing the coexpression of α-SMA and F4/80 in macrophage-to-myofibroblast trasition cells on day 7 after UUO. Scale bar: 100 μm. D Quantification of cells coexpressing α-SMA and F4/80 by immunofluorescence. n = 6. E Flow cytometry was used to evaluate the percentage of macrophages expressing α-SMA on day 0, 7 and 10 after UUO in the kidneys of Gsdmd+/+ mice and Gsdmd−/− mice. F Quantification of the percentage of macrophages expressing α-SMA in the kidneys by flow cytometry analysis. n = 3. **P < 0.01.
Fig. 5
Fig. 5. Gsdmd deficiency in bone marrow-derived cells instead of renal parenchymal cells reduced renal fibrosis progression after UUO.
A Representative images of Masson trichrome staining of kidney sections. Kidneys were isolated from bone marrow chimeric mice (Gsdmd+/+ to Gsdmd+/+, Gsdmd+/+ to Gsdmd−/−, Gsdmd−/− to Gsdmd+/+ and Gsdmd−/− to Gsdmd−/−) on day 13 after UUO. Scale bar: 100 μm. B, C Representative images of immunofluorescence staining of kidney sections from bone marrow chimeric mice, showing the expression of α-SMA B and Col I C. DAPI (blue) was used for nuclear staining. Scale bar: 100 μm. D–F Quantification of renal fibrosis scores evaluated by Masson trichrome staining D, α-SMA E and Col I F expression by immunofluorescence. n = 6. G, H Representative images of immunofluorescence staining of kidney sections from Gsdmd+/+ to Gsdmd-/-, Gsdmd-/- to Gsdmd+/+ mice on day 7 after UUO, showing the expression of Histone-H3 and MPO and quantification of cells undergoing NETs formation characterized by H3 and MPO double positive. n = 6. Scale bar: 100 μm. I, J Representative images of immunofluorescence staining of kidney sections from Gsdmd+/+ to Gsdmd−/−, Gsdmd−/− to Gsdmd+/+ mice, showing the coexpression of α-SMA and F4/80 in macrophage-to-myofibroblast trasition cells on day 7 after UUO and quantification of cells coexpressing α-SMA and F4/80 by immunofluorescence. n = 6. Scale bar: 100 μm. *P < 0.05; **P < 0.01; ##P < 0.01.
Fig. 6
Fig. 6. Specific deletion of Gsdmd in neutrophils instead of macrophages protected the kidney from undergoing fibrosis after UUO.
A Representative images of Masson trichrome staining of kidney sections. Kidneys were collected from Gsdmdfl/fl, Gsdmdwt/wtLyzcre, Gsdmdfl/flLyzcre, Gsdmdwt/wtMpr8cre and Gsdmdfl/flMpr8cre mice on day 13 after UUO. Scale bar: 100 μm. B, C Representative images of immunofluorescence staining of kidney sections, showing the expression of α-SMA B and Col I C. DAPI (blue) was used for nuclear staining. Scale bar: 100 μm. DF Quantification of renal fibrosis scores evaluated by Masson trichrome staining D, α-SMA E, and Col I F expression by immunofluorescence. n = 6. **P < 0.01.
Fig. 7
Fig. 7. In vitro studies revealed that NETs promoted macrophage-to-myofibroblast transition.
A Representative images of immunofluorescence staining of GSDMD (green). The neutrophils were isolated from the bone marrow of wild-type mice. Neutrophils were primed with very low dose of PMA 20 nM for 3 h and then treated with hydrops extracted from the obstructed kidney (treatment group) or urine of healthy mice (control group) for 8 hours. GSDMD translocalization to the cell membranes was induced in the treatment group. Scale bar: 50 μm. n = 4. B, C Representative images of immunofluorescence staining of Cit-H3 and MPO and quantification of neutrophils undergoing NETs formation characterized by Cit-H3 positive. The neutrophils were isolated from the bone marrow of Gsdmd+/+ mice and Gsdmd−/− mice and treated with as A described. n = 6. Scale bar: 50 μm. D Representative images of immunofluorescence staining of the expression of α-SMA. The macrophages were treated with NETs, NETs plus DNase I(10 U/ml), NETs plus NE inhibitor (Alvelestat, 10 μmol/ml) or NETs plus antiTGF-β1 antibody for 96 h. Scale bar: 50 μm. E Western blot analysis for α-SMA and phosphorylated Smad3 expression of macrophages, which was corresponding to the five condition of D. n = 4. F, G Representative images of immunofluorescence staining of p65. Macrophages were treated with NETs, or NETs plus DNase I. Scale bar: 50μm. H, I Macrophages were treated as described in D. TNF-α and TGF-β1 production in macrophages were detected by ELISA. n = 4. J Macrophages were treated with 1 μg/mL LPS and 500 ng/ml HMGB1 for 18 h. IL-1β production in macrophages were detected by ELISA. The macrophages were isolated from the bone marrow of Gsdmd+/+ mice and Gsdmd−/− mice and treated with HMGB1 or not. n = 4. ** P < 0.01.
Fig. 8
Fig. 8. Specific deletion of Casp11 in neutrophils inhibited NETs formation and renal fibrosis after UUO.
A Western blot showing caspase11 activation in the kidneys after UUO. Kidney tissue lysates were isolated on day 0, 2, 5, and 10 after UUO. n = 4. B Representative images of Masson trichrome staining of kidney sections from Casp11wt/wtMrp8cre and Casp11fl/flMrp8cre mice on day 13 after UUO. Scale bar: 100 μm. n = 6. C, D Representative images of immunofluorescence staining of kidney sections from Casp11wt/wtMrp8cre and Casp11fl/flMrp8cre mice, showing the expression of α-SMA C and Col I D. DAPI (blue) was used for nuclear staining. Scale bar: 100 μm. E Representative images of immunofluorescence staining of kidney sections from Casp11wt/wtMrp8cre and Casp11fl/flMrp8cre mice on day 10 after UUO, showing the expression of Histone-H3 and MPO. Scale bar: 100μm. F, G Representative images of immunofluorescence staining of Cit-H3 and MPO and quantification of neutrophils undergoing NETs formation. The neutrophils were isolated from Casp11+/+ and Casp11-/- mice and treated as described in Fig. 7A. n = 6. Scale bar: 50 μm. H Schematic model of GSDMD-dependent NETs promoting MMT and renal fibrosis in obstructive nephropathy.

Similar articles

Cited by

References

    1. Nastase MV, Zeng-Brouwers J, Wygrecka M, Schaefer L. Targeting renal fibrosis: mechanisms and drug delivery systems. Adv Drug Deliv Rev. 2018;129:295–307. doi: 10.1016/j.addr.2017.12.019. - DOI - PubMed
    1. McLeod DJ, Sebastiao YV, Ching CB, Greenberg JH, Furth SL, Becknell B. Longitudinal kidney injury biomarker trajectories in children with obstructive uropathy. Pediatr Nephrol. 2020;35:1907–14. doi: 10.1007/s00467-020-04602-7. - DOI - PMC - PubMed
    1. Chen H, Fang Y, Wu J, Chen H, Zou Z, Zhang X, et al. RIPK3-MLKL-mediated necroinflammation contributes to AKI progression to CKD. Cell Death Dis. 2018;9:878. doi: 10.1038/s41419-018-0936-8. - DOI - PMC - PubMed
    1. Imamura M, Moon JS, Chung KP, Nakahira K, Muthukumar T, Shingarev R, et al. RIPK3 promotes kidney fibrosis via AKT-dependent ATP citrate lyase. JCI Insight. 2018;3:e94979.. doi: 10.1172/jci.insight.94979. - DOI - PMC - PubMed
    1. Belavgeni A, Meyer C, Stumpf J, Hugo C, Linkermann A. Ferroptosis and necroptosis in the kidney. Cell Chem Biol. 2020;27:448–62. doi: 10.1016/j.chembiol.2020.03.016. - DOI - PubMed

Publication types

MeSH terms

Substances