. 2022 Aug 8;13(1):4631.
doi: 10.1038/s41467-022-32324-x.

COVID-19 mRNA booster vaccine induces transient CD8+ T effector cell responses while conserving the memory pool for subsequent reactivation

Affiliations

COVID-19 mRNA booster vaccine induces transient CD8+ T effector cell responses while conserving the memory pool for subsequent reactivation

Matthias Reinscheid et al. Nat Commun. .

Abstract

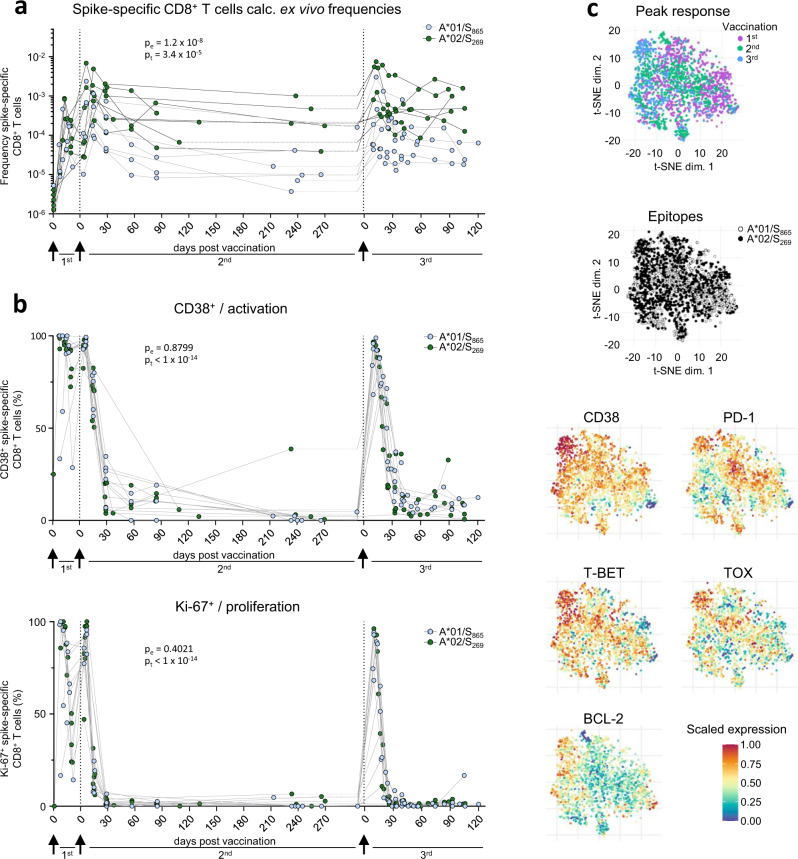
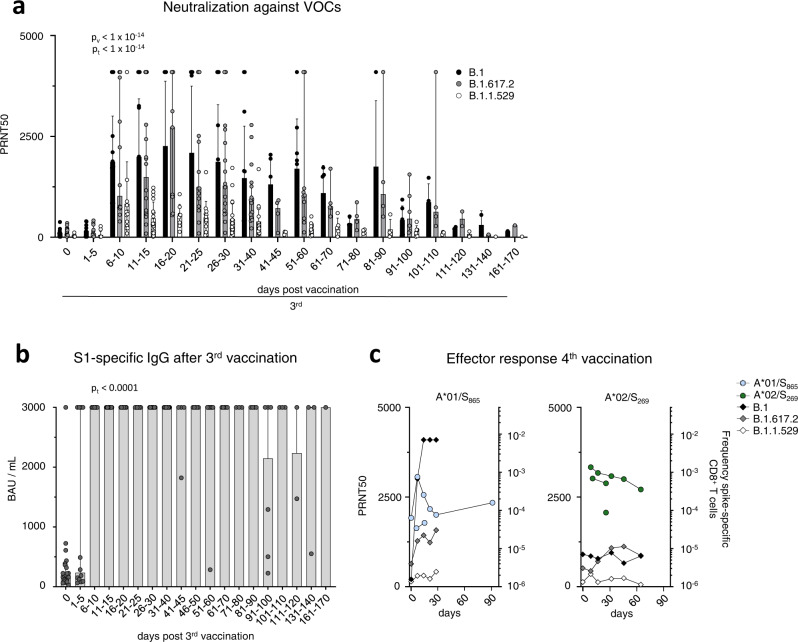
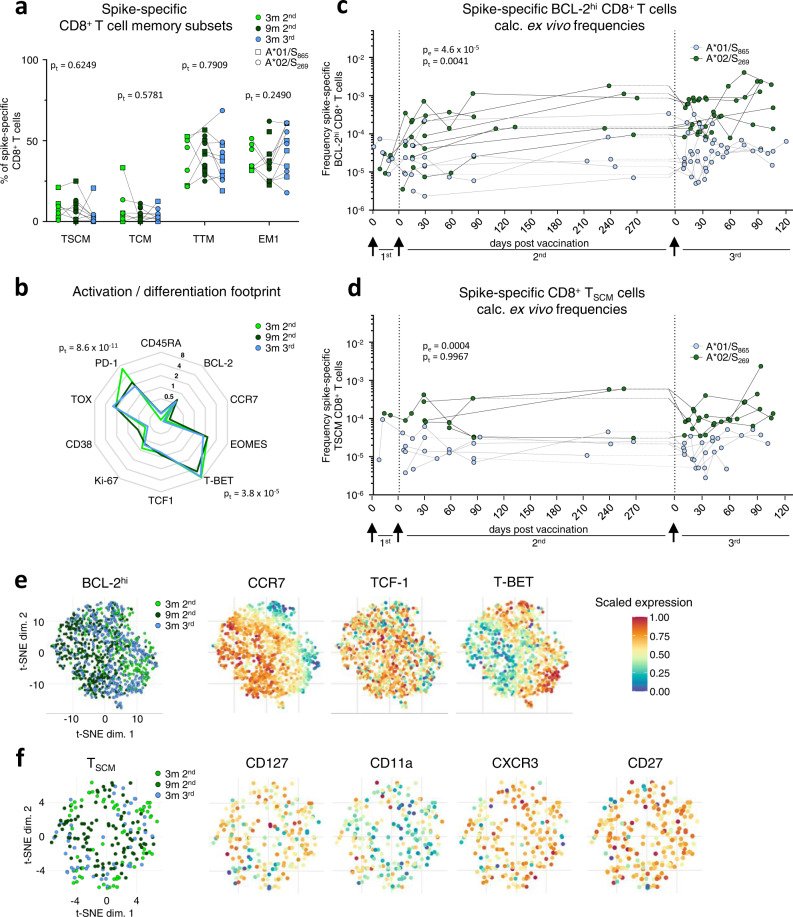
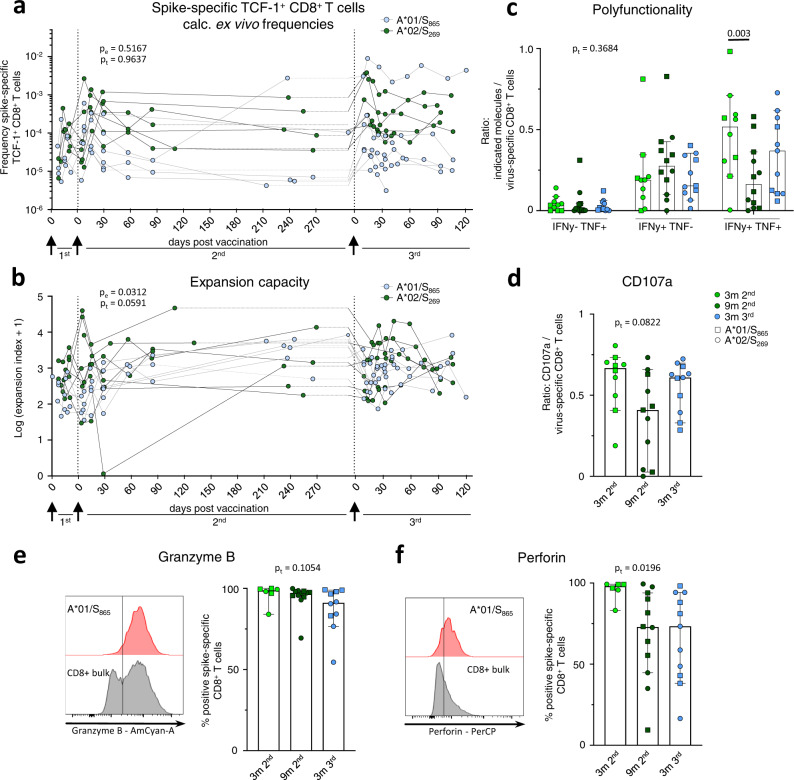
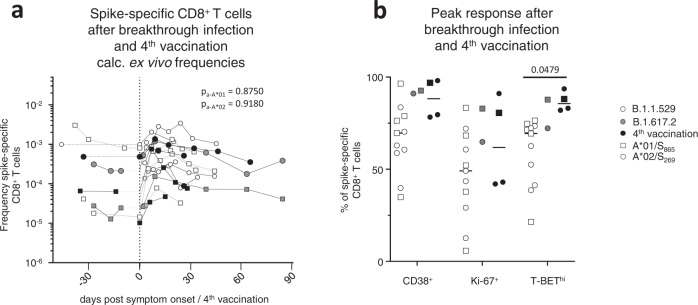
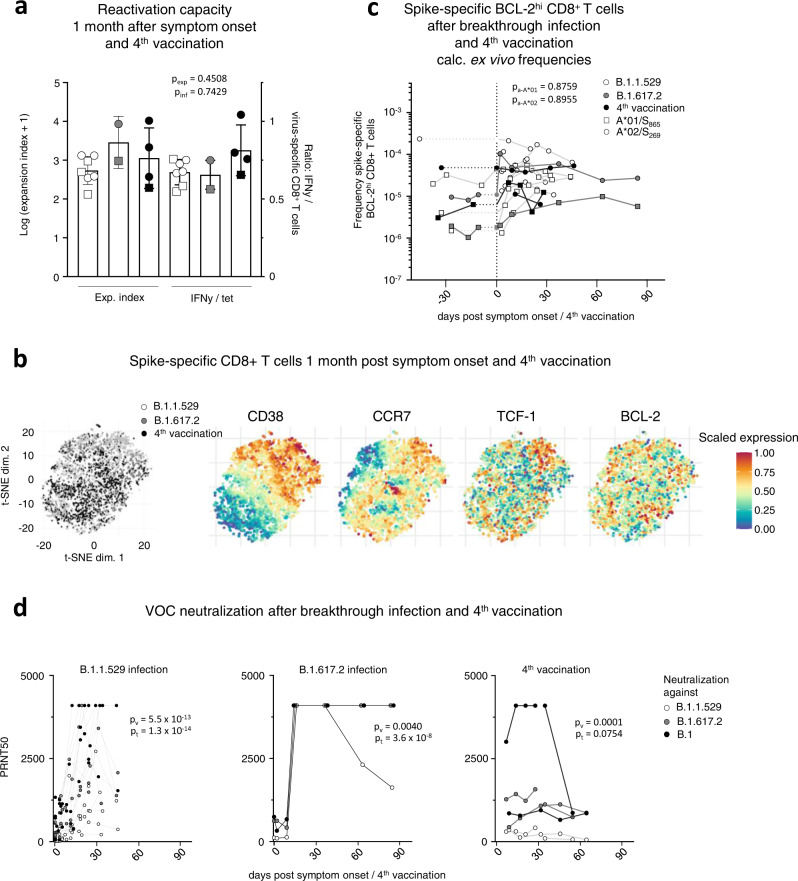
Immunization with two mRNA vaccine doses elicits robust spike-specific CD8+ T cell responses, but reports of waning immunity after COVID-19 vaccination prompt the introduction of booster vaccination campaigns. However, the effect of mRNA booster vaccination on the spike-specific CD8+ T cell response remains unclear. Here we show that spike-specific CD8+ T cells are activated and expanded in all analyzed individuals receiving the 3rd and 4th mRNA vaccine shots. This CD8+ T cell boost response is followed by a contraction phase and lasts only for about 30-60 days. The spike-specific CD8+ T memory stem cell pool is not affected by the 3rd vaccination. Both 4th vaccination and breakthrough infections with Delta and Omicron rapidly reactivate CD8+ T memory cells. In contrast, neutralizing antibody responses display little boost effect towards Omicron. Thus, COVID-19 mRNA booster vaccination elicits a transient T effector cell response while long-term spike-specific CD8+ T cell immunity is conserved to mount robust memory recall targeting emerging variants of concern.


Conflict of interest statement

The authors declare no competing interests.

Figures

Fig. 1
Fig. 1. Cellular and humoral effector response after the 3rd vaccine dose.
Calculated ex vivo frequencies of spike-specific CD8+ T cells throughout 1st, 2nd and 3rd vaccination (a). Ki-67,and CD38 expression within spike-specific non-naïve CD8+ T cells (b). t-SNE representation of flow cytometry data comparing A*01/S865- and A*02/S269-specific CD8+ T cells at peak response after 1st, 2nd and 3rd vaccination. Expression levels of CD38, T-BET, BCL-2, PD-1 and TOX are depicted (c). Statistical significance was determined by two-way ANOVA with main model (a, b) comparing the effects of targeted epitopes (pe) and of the time course (pt). Source data are provided as a Source Data file.
Fig. 2
Fig. 2. Humoral response after the 3rd vaccine dose.
Antibody neutralization activity as 50% plaque reduction neutralization tests (PRNT50) for SARS-CoV-2 variants B.1, B.1.617.2 and B.1.1.529 after 3rd vaccination. Median values are depicted with 95% confidence interval error bars with n = 28 individual tested (a). Quantification of serum anti-SARS-CoV-2 spike IgG levels following 3rd vaccination with n = 26 individuals tested (b). Calculated ex vivo frequencies of A*01/S865- (left) and A*02/S269-specific (right) CD8+ T cells, with antibody neutralization activity after 4th vaccination (c). Median values are depicted with 95% confidence interval error bars. Statistical significance was calculated by Kruskal-Wallis test (a) comparing the effects of time course (pt < 1×10⁻¹⁴). Source data are provided as a Source Data file.
Fig. 3
Fig. 3. Spike-specific CD8+ T memory cells before and after the 3rd vaccine dose.
Composition of spike-specific CD8+ T cell memory subsets at 3 (n = 7) and 9 (n = 11) months after 2nd, and 3 (n = 11) months after 3rd vaccination (a). Molecule expression of spike-specific non-naïve CD8+ T cells at 3 (n = 8) and 9 (n = 12) months after 2nd, and 3 (n = 11) months after 3rd vaccination normalized to bulk naïve CD8+ T cells (b). Calculated ex vivo frequencies of BCL-2hi (c) and TSCM (d) spike-specific CD8+ T cells. t-SNE representation of BCL-2hi (e) and TSCM (f) spike-specific CD8+ T cells at 3 and 9 months after 2nd, and 3 months after 3rd vaccination. Expression levels of CCR7, TCF-1 and T-BET are depicted for BCL-2hi, and CD127, CD11a, CXCR3 and CD27 are depicted for TSCM spike-specific CD8+ T cells. Statistical significance was calculated by two-way ANOVA with full model and Tukey’s test for multiple comparison (a, b) to examine the effect of sampling time points (pt) on memory subsets and marker expression, and two-way ANOVA with main model (c, d) to compare the effects of targeted epitopes (pe) and time course (pt). Source data are provided as a Source Data file.
Fig. 4
Fig. 4. Reactivation capacity of spike-specific CD8+ T cells before and after the 3rd vaccine dose.
Calculated ex vivo frequencies of TCF-1+ non-naive spike-specific CD8+ T cells (a). Expansion capacity of spike-specific CD8+ T cells over 14 days of in vitro expansion throughout 1st, 2nd and 3rd vaccination (b). Percentage of IFNγ and TNF (c), and CD107a (d) producing CD8+ T cells upon peptide stimulation related to the percentage of spike-specific CD8+ T cells from all CD8+ T cells at 3 (n = 10) and 9 (n = 12 for c, n = 11 for d) months post 2nd, and 3 (n = 11) months post 3rd vaccination after in vitro expansion. Median values are depicted with 95% confidence interval error bars. Expression of Granzyme B (e) and Perforin (f) of spike-specific CD8+ T cells at 3 (n = 6) and 9 (n = 12) months post 2nd, and 3 months (n = 10 for e, n = 11 for f) post 3rd vaccination after in vitro expansion with representative histograms. Median values are depicted with 95% confidence interval error bars. Statistical significance was calculated by two-way ANOVA with main model (a, b) to compare the effects of targeted epitopes (pe) and time course (pt), two-way ANOVA with full model and Tukey’s multiple comparison test (c), and Kruskal-Wallis test (d, e, f) to examine the effect of sampling time on functionality (pt). Source data are provided as a Source Data file.
Fig. 5
Fig. 5. CD8+ T effector cell response after breakthrough infection and the 4th vaccine dose.
Calculated ex vivo frequencies of spike-specific CD8+ T cells before and after breakthrough infection and 4th vaccination (a). Proportion of CD38+, Ki-67+ and T-BEThi within non-naive spike-specific CD8+ T cells at peak expansion after breakthrough infection and 4th vaccination with n = 11 for Omicron and n = 2 for Delta breakthrough infections, and n = 4 individuals receiving a 4th vaccination (b). Statistical significance was calculated by two-way ANOVA with main model to compare the effects of antigen triggers (pa) on epitope-specific T cell frequencies (a) and two-way ANOVA with full model and Tukey’s test for multiple comparison (b) to examine the effects of antigen triggers on activation marker expression. Source data are provided as a Source Data file.
Fig. 6
Fig. 6. Characterization of CD8+ T memory cells after breakthrough infection and the 4th vaccine dose.
Reactivation capacity of spike-specific CD8+ T cells 1 month after symptom onset and 4th vaccination. Median values are depicted with 95% confidence interval error bars with n = 6 for Omicron and n = 2 for Delta breakthrough infections, and n = 4 individuals receiving a 4th vaccination (a). t-SNE representation of spike-specific CD8+ T cells 1 month after symptom onset and 4th vaccination. Expression levels of CD38, CCR7, TCF- and BCL-2 are depicted (b). Calculated ex vivo frequencies of BCL-2hi non-naïve spike-specific CD8+ T cells before and after breakthrough infection and 4th vaccination (c). Antibody neutralization activity as 50% plaque reduction neutralization tests (PRNT50) for SARS-CoV-2 variants B.1, B.1.617.2 and B.1.1.529 after breakthrough infection and 4th vaccination with n = 11 for Omicron and n = 1 for Delta breakthrough infection, and n = 2 individuals receiving a 4th vaccination (d). Statistical significance was calculated by Kruskal-Wallis test (a) to compare the effect of the antigen triggers on expansion (pexp) and interferon production (pinf) and two-way ANOVA with main model (c, d) to compare the effects of antigen triggers (pa) on epitope-specific T cell frequencies (c) or the effects of VOCs (pv) and time course (pt). Source data are provided as a Source Data file.

References

    1. Krammer F. SARS-CoV-2 vaccines in development. Nature. 2020;586:516–527. doi: 10.1038/s41586-020-2798-3. - DOI - PubMed
    1. Kalimuddin S, et al. Early T cell and binding antibody responses are associated with COVID-19 RNA vaccine efficacy onset. Med (N. Y) 2021;2:682–688 e684. - PMC - PubMed
    1. Oberhardt V, et al. Rapid and stable mobilization of CD8+ T cells by SARS-CoV-2 mRNA vaccine. Nature. 2021;597:268–273. doi: 10.1038/s41586-021-03841-4. - DOI - PMC - PubMed
    1. Painter MM, et al. Rapid induction of antigen-specific CD4+ T cells is associated with coordinated humoral and cellular immunity to SARS-CoV-2 mRNA vaccination. Immunity. 2021;54:2133–2142 e2133. doi: 10.1016/j.immuni.2021.08.001. - DOI - PMC - PubMed
    1. Sahin U, et al. BNT162b2 vaccine induces neutralizing antibodies and poly-specific T cells in humans. Nature. 2021;595:572–577. doi: 10.1038/s41586-021-03653-6. - DOI - PubMed

Publication types