. 2022 Aug 8;13(1):4615.
doi: 10.1038/s41467-022-32312-1.

Lower vaccine-acquired immunity in the elderly population following two-dose BNT162b2 vaccination is alleviated by a third vaccine dose

Collaborators, Affiliations

Lower vaccine-acquired immunity in the elderly population following two-dose BNT162b2 vaccination is alleviated by a third vaccine dose

Laurent Renia et al. Nat Commun. .

Abstract

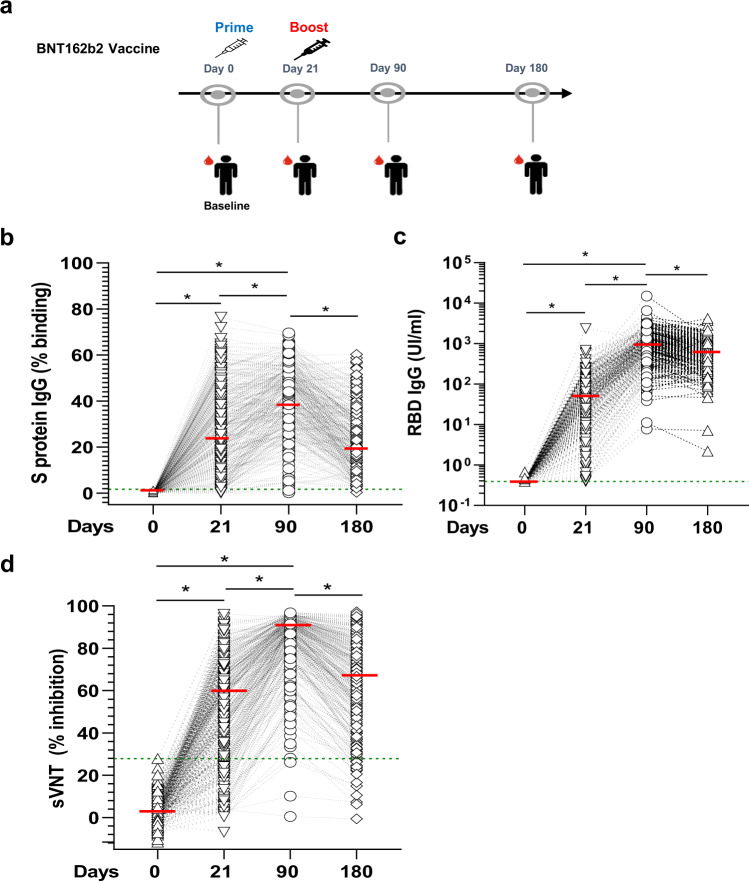
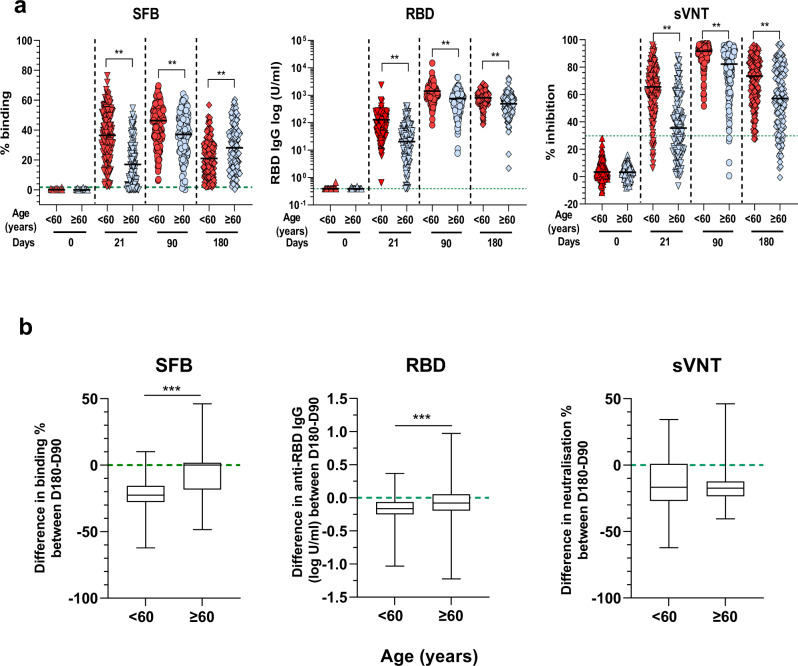
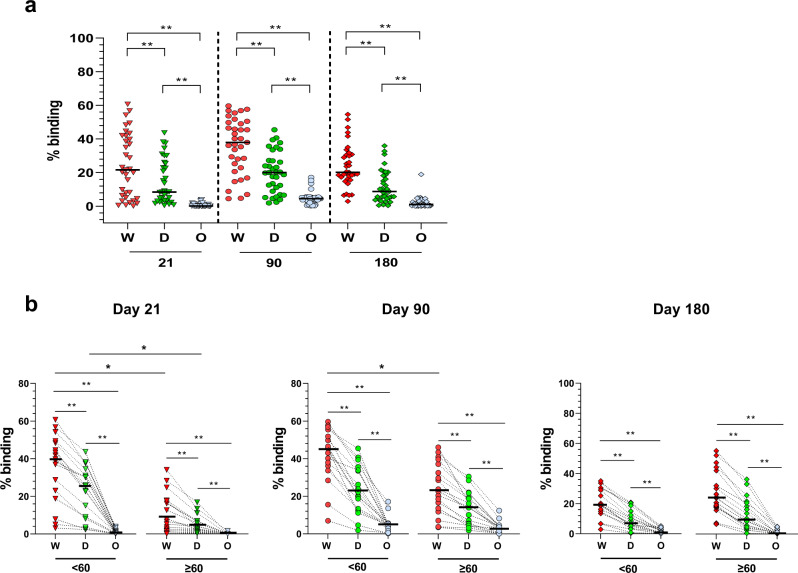
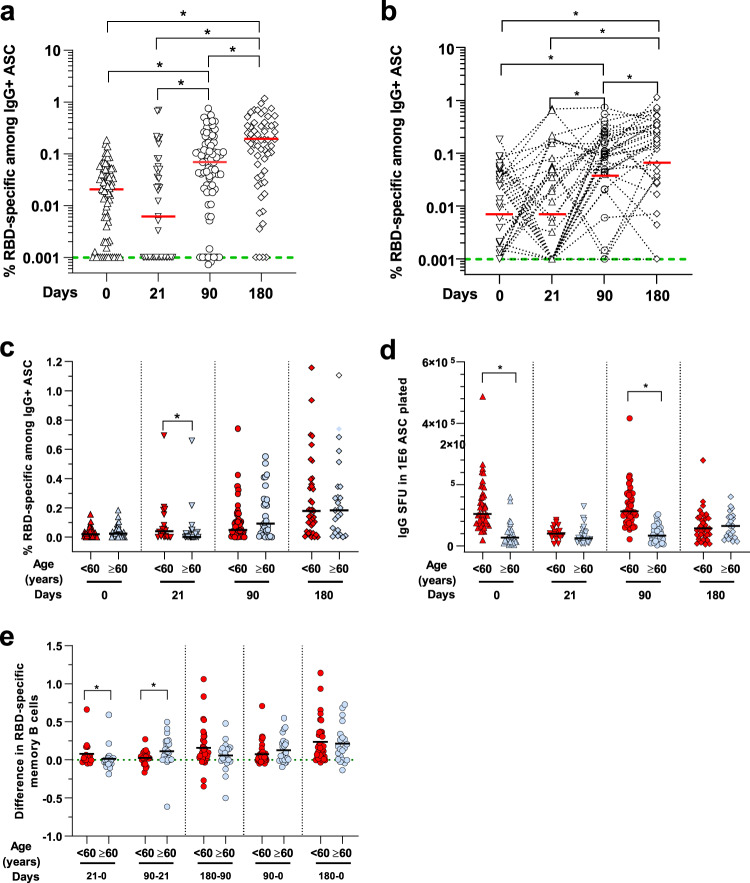
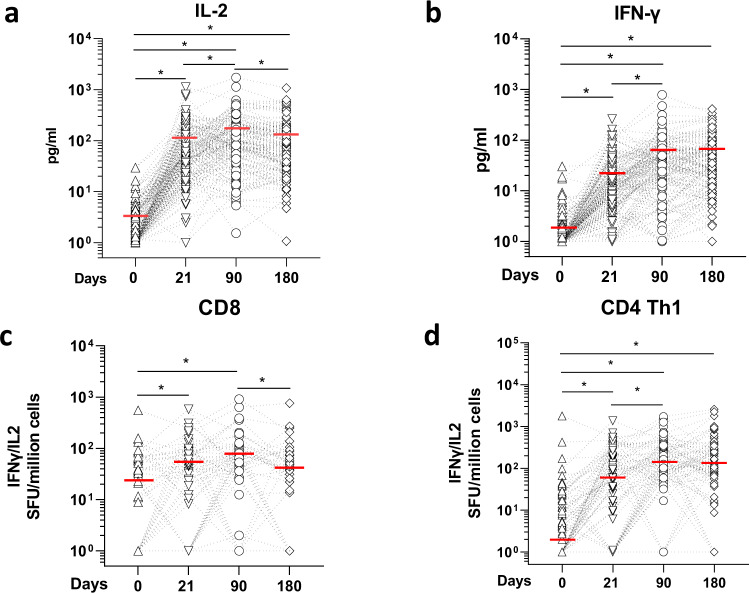
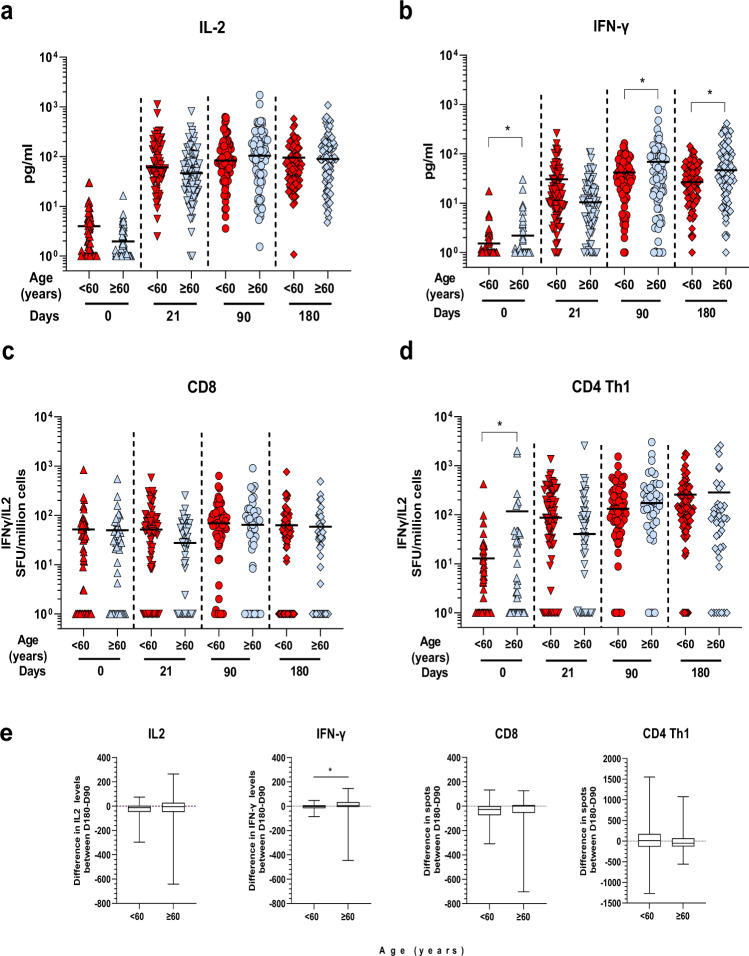
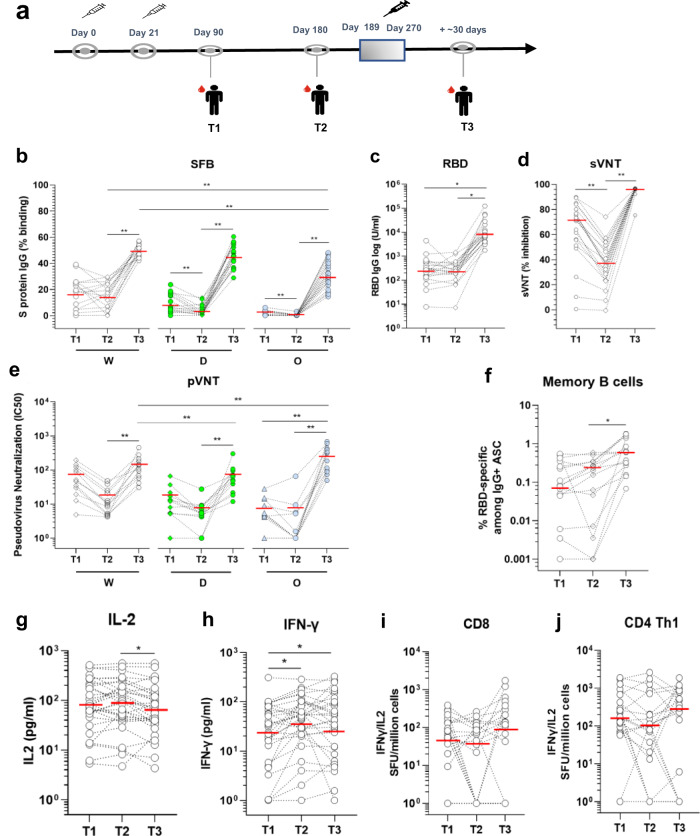
Understanding the impact of age on vaccinations is essential for the design and delivery of vaccines against SARS-CoV-2. Here, we present findings from a comprehensive analysis of multiple compartments of the memory immune response in 312 individuals vaccinated with the BNT162b2 SARS-CoV-2 mRNA vaccine. Two vaccine doses induce high antibody and T cell responses in most individuals. However, antibody recognition of the Spike protein of the Delta and Omicron variants is less efficient than that of the ancestral Wuhan strain. Age-stratified analyses identify a group of low antibody responders where individuals ≥60 years are overrepresented. Waning of the antibody and cellular responses is observed in 30% of the vaccinees after 6 months. However, age does not influence the waning of these responses. Taken together, while individuals ≥60 years old take longer to acquire vaccine-induced immunity, they develop more sustained acquired immunity at 6 months post-vaccination. A third dose strongly boosts the low antibody responses in the older individuals against the ancestral Wuhan strain, Delta and Omicron variants.


Conflict of interest statement

A patent application for the SFB assay has been filed (Singapore patent #10202009679 P: A Method Of Detecting Antibodies And Related Products) (L.R., Y.S.G., and L.F.P.N). The authors declare no other competing interests.

Figures

Fig. 1
Fig. 1. Anti-SARS-CoV-2 spike protein antibody response after vaccination.
a Schematic description of the longitudinal vaccination and blood sampling strategy in a cohort of Singaporean individuals (n = 312). Kinetics of IgG response were analyzed using three serological assays on paired samples. Overall cohort baseline value is defined as the value greater than maximum range of all samples in the cohort. The green dotted line represents the maximum range of the samples in the different assays. The median values of each group are represented by a red line. b A flow cytometry-based assay using the full Spike protein (SFB) assay. Median (range) of values at day 0 was 0.06% (0.002, 1.7). Antibody levels below the maximum range (1.7%) were considered baseline values. Median values was 28.4% at day 21, 42% at day 90 and 23.35%at day 180. *p < 0.001, Friedman test. c The Roche S assay using the RBD protein fragment. Median (range) of values at day 0 was 0.39 U/ml (0.39, 0.67). Antibody levels below the maximum range (1.38 U/ml) were considered baseline values. Median values were 40.55 U/ml at day 21, 806.2 U/ml at day 90 and 603 U/ml at day 180. *p < 0.001, Friedman test. d A surrogate virus neutralization test (sVNT). Median (range) of values at day 0 was 0.39% (−11.54, 27.94). Inhibition below the maximum range (27.94%) were considered baseline values. Median values were 56.4% at day 21, 89.9% at day 90 and 67.4% at day 180 *p < 0.0001, Friedman test.
Fig. 2
Fig. 2. Age stratification of antibody responses.
a Comparison between age groups: <60 (n = 178) and ≥60 (n = 134), at different time points (day 0, 21, 90 and 180) using SFB (left panel); RBD Roche S assay (middle panel); and sVNT assay (right panel). The median value of each age group is represented by the black line. The green dotted lines represent the maximum range of the samples for the whole cohort baseline as defined in Fig. 1. *p < 0.01, two-sided Mann–Whitney test. b Box plots showing difference in antibody response between days 180 and 90 for paired samples between the different age groups (<60 (n = 178) and ≥60 (n = 134)). Data are represented as median (middle line) with 25th, 75th percentile (box) and 5th and 95th (whiskers). Median values are −22.5 for <60 and 0.02 for ≥60 for the SFB assay; −358 for <60 and −72 for ≥60 for the Roche S assay; and −16.75 for <60 and −17.3 for ≥60 for the sVNT assay. ***p < 0.0001, two-sided Mann–Whitney test.
Fig. 3
Fig. 3. Antibody recognition of Wuhan ancestral strain, Delta and Omicron variants.
a Comparison of antibody response of the vaccinees (n = 35) at days 21, 90 and 180 using the SFB assays with cells expressing either the Wuhan ancestral virus (W), the delta (D) or Omicron (O) variants of the Spike protein. Median values of the samples were at day 21, 90 and 180 respectively 39.8%, 37.9% and 20.2 for the Wuhan strain; 8.45%, 20% and 8.8% for Delta;0.13%, 4.5% and 1.1% for Omicron. **p < 0.001, two-sided Mann–Whitney test. b Comparison between age groups: <60 (n = 17) and ≥60 (n = 18), at different time points (days 21, 90 and 180) using SFB with cells expressing either the wild-type Wuhan ancestral virus (W) or the delta (D) or Omicron (O) variants of the Spike protein. The median value of each group is represented by a red line. They were respectively at days 21, 90 and 180: Wuhan ancestral strain, 39,8%, 45,4% and 19.1% (<60) and 9%, 28.7%, and 23.96% (≥60); Delta variant: 25.4%, 22.2% and 7% (<60) and 5%, 17.4%, and 9.5% (≥60); and Omicron variant: 0.8%, 5% and 7% (<60) and 0.06%, 3.8%, and 0.4% (≥60). **p < 0.001, Friedman test when the three strains were compared together, or two-sided Mann–Whitney test when the same strain was compared between the two age groups.
Fig. 4
Fig. 4. Circulating RBD-specific memory B cells after vaccination.
a RBD-specific memory B cells were determined by ELISPOT using a RBD protein. Determination of % RBD-specific memory B cells among IgG+ antibody-secreting cells (ASC) done on PBMC from vaccinated participants at baseline or day 0 (n = 73), at day 21 (n = 43), at day 90 (n = 76) and at day 180 (n = 60). The median value of each group is represented by a red line and were at day 0, 21, 90 and 180, respectively 0,02%, 0.006%, 0.07% and 0.18% of the % RBD-specific memory B cells among IgG+ ASC. *p < 0.01, Dunn’s test after Kruskal–Wallis (p < 0.001) on log-transformed data. Green dotted lines indicate the limit of detection for the assay. b Paired wise comparison of % RBD-specific memory B cells among IgG+ ASC for the analyzed aged group at different days post doses is shown (n = 35). The median value of each group is represented by a red line and is the same as in (a). *p < 0.01, Friedman test on log transformed data. c RBD-specific memory B cells comparison between the analyzed age groups. Samples were from individuals: aged <60: at day 0 (n = 46), day 21 (n = 18), day 90 (n = 46), and day 180 (n = 37); and aged ≥60, at day 0 (n = 27), at day 21 (n = 25), at day 90 (n = 30), and day 180 (n = 23). d Total IgG producing memory B cells comparison between the same analyzed age groups as above in (c). The median value of each group is represented by a black line. *p < 0.01, two-sided Mann–Whitney test. e Difference in RBD-specific memory B cells between paired samples and different time points (n = 35). *p < 0.01, two-sided Mann–Whitney test.
Fig. 5
Fig. 5. Anti-SARS-CoV-2 spike protein T cell responses.
a IL-2 and b IFN-γ secretion profile of whole-blood cultures stimulated with S protein peptide pool compared at different time points of paired samples from vaccinated individuals (n = 160). The limit of detection for each cytokine (IL‐2 = 5.4 pg/ml; IFN‐γ = 1.7 pg/ml). Values below limit of detection levels were plotted as 1. *p < .001, ANOVA on log-transformed data, which follow a normal distribution. The mean values of each group are represented by a red line and were at day 0, 21, 90 and 180: 1.8 pg/ml, 23.8 pg/ml, 55.4 pg/m and 57.2 pg/ml for IL-2; 2.96 pg/ml, 102.6 pg/ml, 154.2 pg/ml and 123.9 pg/ml for IFN‐γ, respectively. Kinetics of Spike-protein-specific CD8 c or d CD4 Th1 cells overtime in vaccinees. T cells were assayed on a subset of vaccinees (n = 80) by IL-2/ IFN-γ ELISPOT using 9 mer or 15 mer pool peptides, respectively. Data are presented are spot forming units (SFU) per million of PBMC from paired samples from vaccinated individuals at four time points. Each data point represents the normalized mean spot count from duplicate wells for one study participant, after subtraction of the medium-only control. The median values of each group are represented by a red line and were at day 0, 21, 90 and 180: 26.4, 46.2, 55.4 and 57.2 SFU for CD8 T cells; and 2, 67.25, 167.4 and 134.5 SFU for CD4 Th1 cells *p < 0.01, Dunn’s test after Kruskal–Wallis (p < 0.001) on log-transformed data.
Fig. 6
Fig. 6. Age stratification of T cell responses.
Comparison of the T cell response between age groups of samples from vaccinated individuals at different time points post immunization. a IL-2 and b IFN-γ production induced by Spike-peptide pool stimulation from individuals aged <60: (n = 82), and ≥60 (n = 75). Mean values are indicated by a dark line. *p < 0.01, two-sided Student t-test on normalized log values. c CD8 T cells comparison between the analyzed age groups. Less than 60 group: day 0 (n = 66), day 21 (n = 66), day 90 (n = 66) and day 180 (n = 85), and ≥60: day 0 (n = 43), day 21 (n = 44) and day 90 (n = 43) and day 180 (n = 41). Median values are indicated by a dark line. *p < 0.01, two-sided Mann–Whitney test on log values. d CD4 Th1 cells comparison between the analyzed age groups. Less than 60 group: day 0 (n = 72), day 21 (n = 72), day 90 (n = 72) and day 180 (n = 83), and ≥60: day 0 (n = 43), day 21 (n = 44) and day 90 (n = 43 and day 180 (n = 41). Median values are indicated by a dark line. *p < 0.01, two-sided Mann–Whitney test. *p < 0.01, Mann–Whitney test on log values. e Box plots showing difference in T cell responses measure in the different assays between days 180 and 90 for paired samples for both age groups [IL-2 and IFN-γ: <60: (n = 82), and ≥60 (n = 75); CD8 T cells: <60: (n = 45), and ≥60 (n = 27)) and CD4 T cells, <60: (n = 51), and ≥60 (n = 28)]. Data are represented as median (middle line) with 25th, 75th percentile (box) and 5th and 95th (whiskers). Median values of difference levels are: −12.8 for <60 and −4 for ≥60 for IL-2; −5.1 for <60 and 10.3 for ≥60 for IFN-γ; −73.8 for <60 and −54.5 for ≥60 for CD8 T cells; and 10.5 for <60 and –53.2 for ≥60 for CD4 Th1 cells; *p = 0.003, two-sided Mann–Whitney test.
Fig. 7
Fig. 7. Anti-SARS-CoV-2 spike protein antibody and T cell response before and after the third booster dose.
a Blood sampling strategy in subsets of the cohort of Singaporean individuals mentioned in Fig. 1. Kinetics of IgG response were analyzed using three serological assays on paired samples taken at time T1 (day 90), T2 (day 180), and T3 (day 189–270) post first injection. b SFB assay using the cells expressing the Wuhan ancestral strain (W, white dots), Delta (D, green dots) or Omicron variant (O, blue dots). Median of group values at T1 (n = 16), T2 (n = 20), and T3 (n = 20) were: 19, 16.45, and 50.2% (W); 6.7, 2.56, and 45,73% (D); and 1, 0.18, and 31.65% (O). p < 0.001, Friedman test; c Anti-RBD antibodies using the Roche S assay. Median of values (n = 20) at T1, T2, and T3 were 277, 246.8 and 7723 U/ml; *p < 0.001, Friedman test. d Surrogate virus neutralization test (sVNT). Median values (n = 20) at T1, T2, and T3 were 71.2, 36,94 and 96.4% of inhibition. *p < 0.0001, Friedman test. e Neutralization assay using pseudoviruses expressing the SARS-CoV-2 Spike of the Wuhan ancestral strain (W), Delta variant (D) or the Omicron variant (O) (n = 12). Median of IC50 values at T1, T2, and T3 are 48.9, 10.2, and 123.2 (W); 12.5, 5.3, and 57.1 (Delta); 5.0, 1.0, and 248.9 (Omicron) respectively. *p < 0.01, Friedman test. f RBD-specific memory B cells. Paired wise comparison of total RBD-specific memory B cells for the analyzed aged group at different days is shown (n = 15). Median of values at T1, T2, and T3 are 0.08%, 0.2 and 0.6 % of total PBMC. **p < 0.001, Friedman test. g IL-2 and h IFN-γ secretion profile of whole-blood cultures stimulated with S protein peptide pool compared at the three time points of paired samples from vaccinated individuals (n = 31). The limit of detection for each cytokine (IL‐2 = 5.4 pg/ml; IFN‐γ = 1.7 pg/ml). Values below limit of detection levels are plotted as 1. Median of values at T1, T2, and T3 are: 81.2, 96.6 and 62.8 pg/ml for IL-2, and 31.2, 52 and 43 pg/ml for IFN-γ and are indicated as red lines. *p < 0.01, two-way ANOVA on log-transformed data, which follow a normal distribution. Kinetics of Spike-protein-specific CD8 (i) or CD4 Th1 cells (j) over time in vaccinees. T cells were assayed on a subset of vaccinees (n = 11) by IL-2/ IFN-γ ELISPOT as in Fig. 5. Data are presented are spot forming units (SFU) per million of PBMC from paired samples from vaccinated individuals at three time points. Each data point represents the normalized mean spot count from duplicate wells for one study participant, after subtraction of the medium-only control. Values below limit of detection levels are plotted as 1. Median of values at T1, T2, and T3 are: 79, 45.3 and 118.9 SFU for CD8 T cells, and 173, 105.1 and 295.9 SFU for CD4 Th1 cells and are indicated as red lines. *p < 0.01, Dunn’s test after Kruskal–Wallis test.

References

    1. Polack FP, et al. Safety and efficacy of the BNT162b2 mRNA covid-19 vaccine. N. Engl. J. Med. 2020;383:2603–2615. doi: 10.1056/NEJMoa2034577. - DOI - PMC - PubMed
    1. Tenforde MW, et al. Association between mRNA vaccination and COVID-19 hospitalization and disease severity. JAMA. 2020;326:2043–2054. doi: 10.1001/jama.2021.19499. - DOI - PMC - PubMed
    1. Haas EJ, et al. Impact and effectiveness of mRNA BNT162b2 vaccine against SARS-CoV-2 infections and COVID-19 cases, hospitalizations, and deaths following a nationwide vaccination campaign in Israel: an observational study using national surveillance data. Lancet. 2021;397:1819–1829. doi: 10.1016/S0140-6736(21)00947-8. - DOI - PMC - PubMed
    1. Dagan N, et al. BNT162b2 mRNA covid-19 vaccine in a nationwide mass vaccination setting. N. Engl. J. Med. 2021;384:1412–1423. doi: 10.1056/NEJMoa2101765. - DOI - PMC - PubMed
    1. Muhsen, K, et al. Effectiveness of BNT162b2 mRNA COVID-19 vaccine against acquisitions of SARS-CoV-2 among health care workers in long-term care facilities: a prospective cohort study. Clin. Infect. Dis. 10.1093/cid/ciab918 (2021). - PMC - PubMed

Publication types

Supplementary concepts