. 2022 Aug 8;13(1):4621.
doi: 10.1038/s41467-022-32425-7.

Adaptation to chronic ER stress enforces pancreatic β-cell plasticity

Affiliations

Adaptation to chronic ER stress enforces pancreatic β-cell plasticity

Chien-Wen Chen et al. Nat Commun. .

Abstract

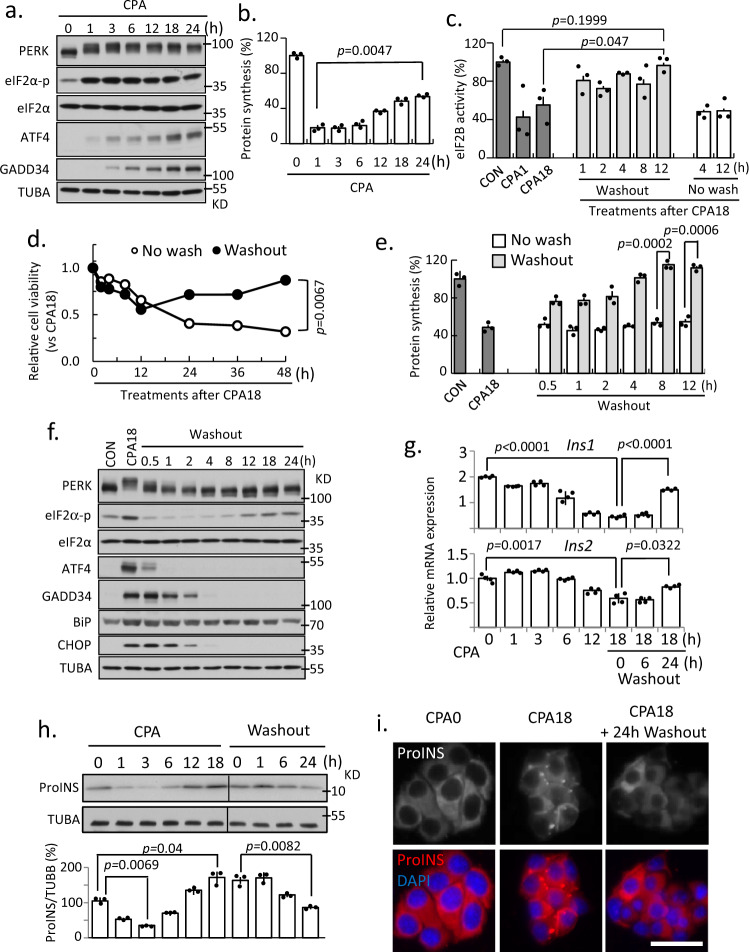
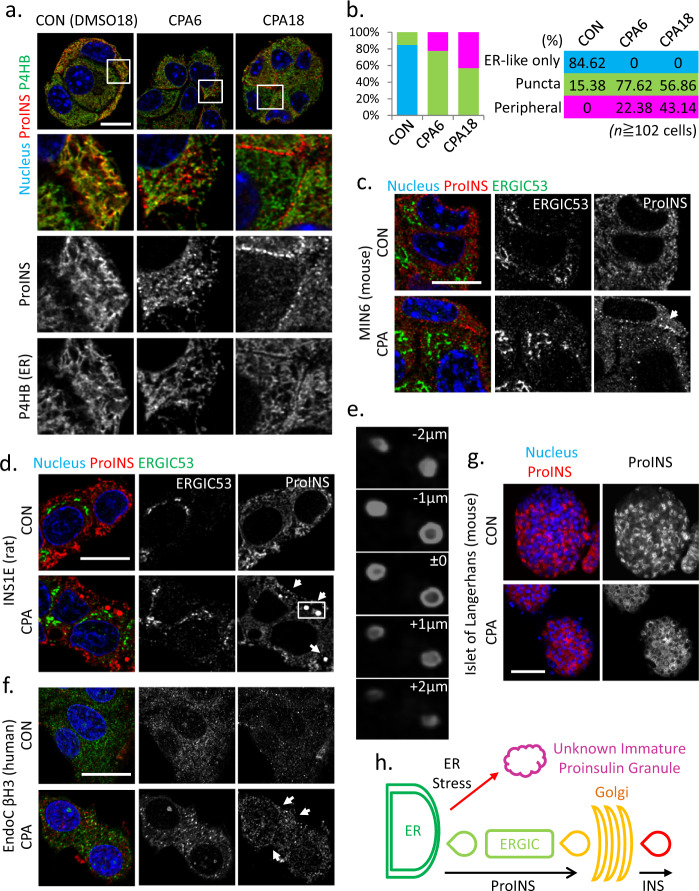
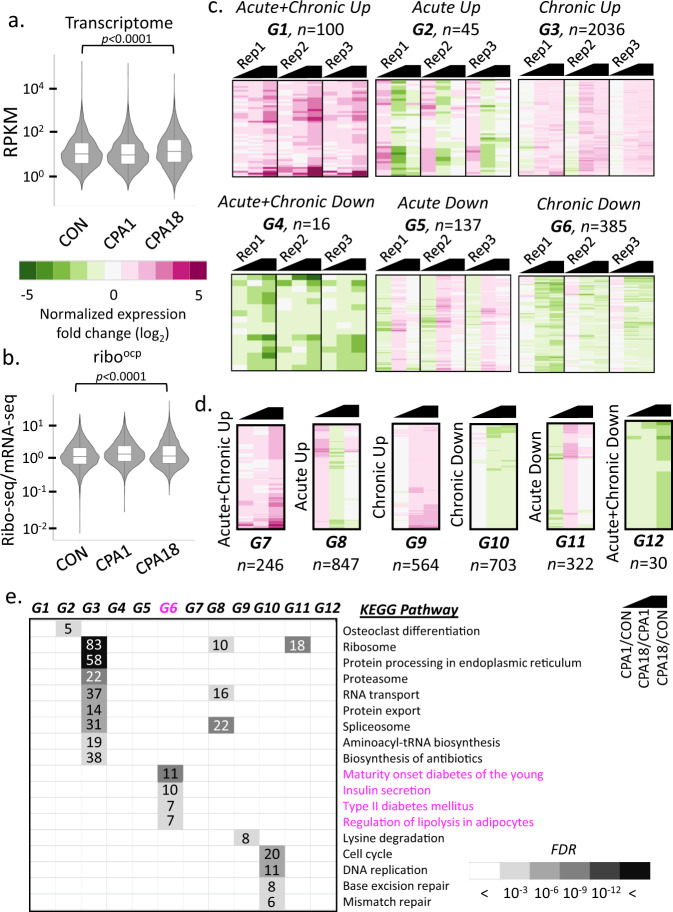
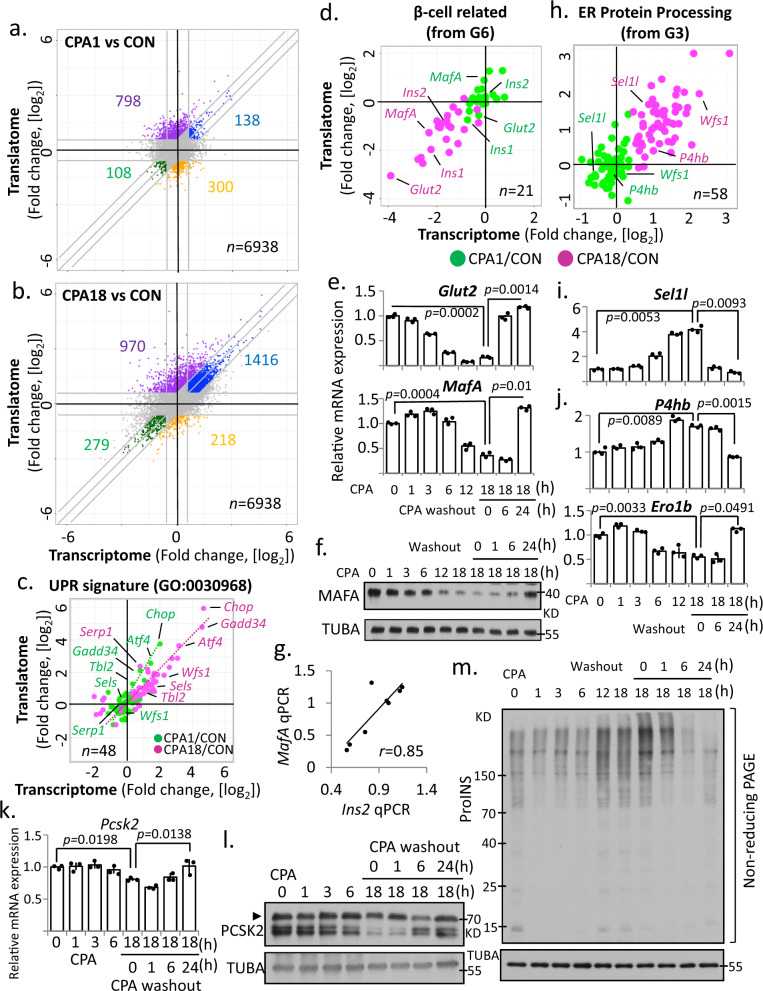
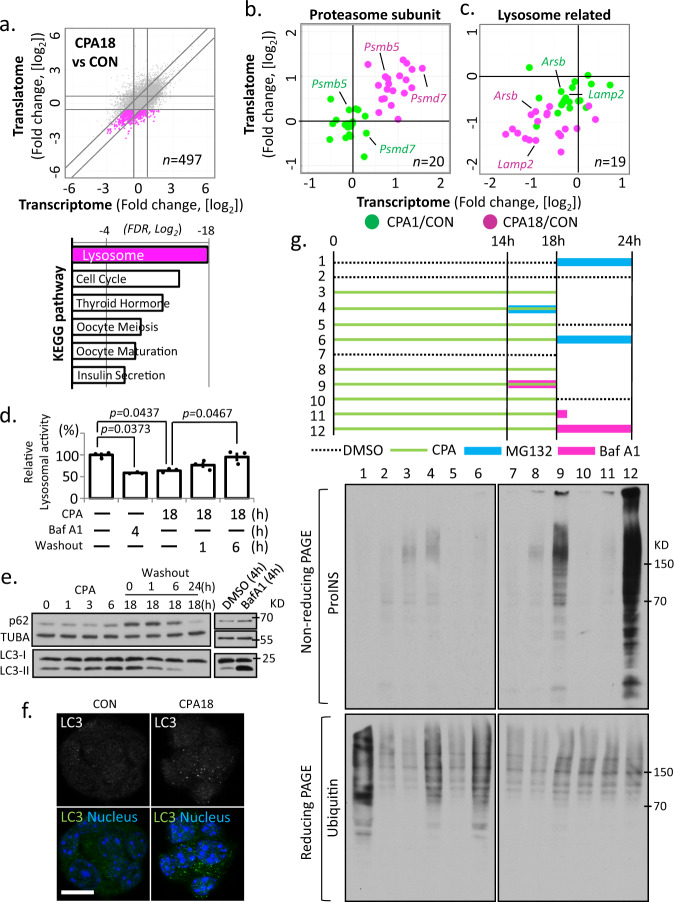
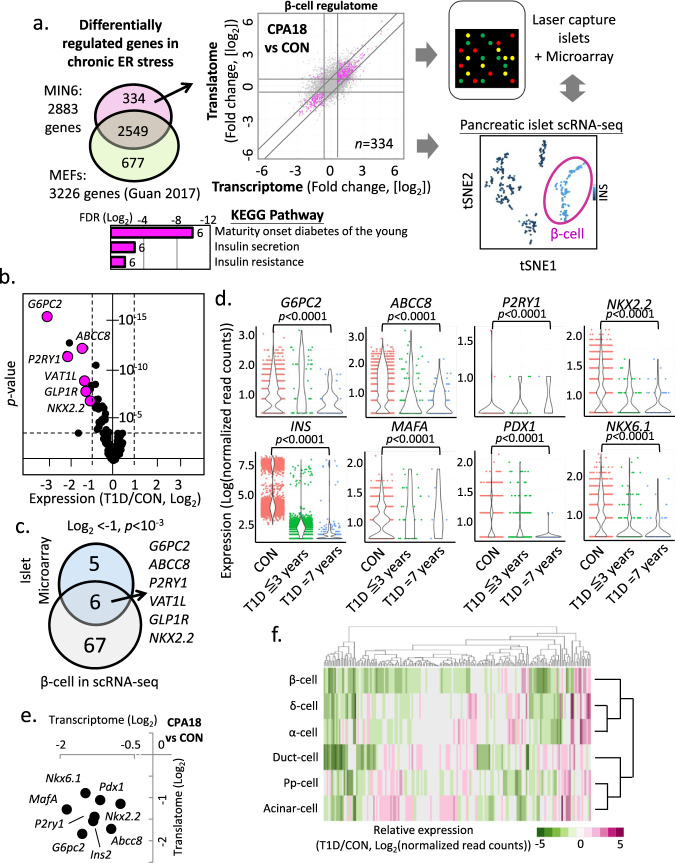
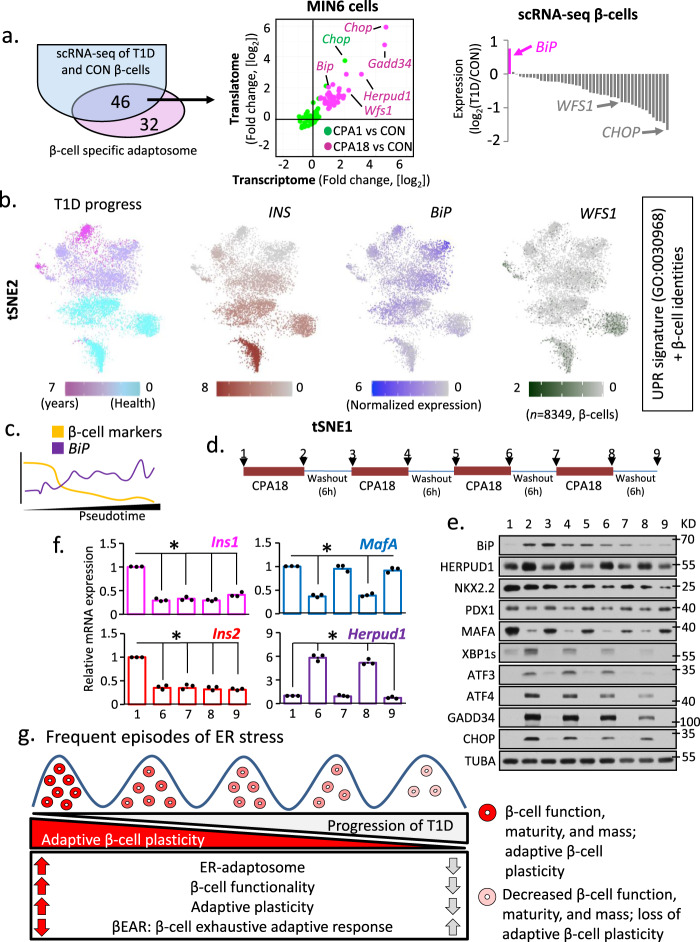
Pancreatic β-cells are prone to endoplasmic reticulum (ER) stress due to their role in insulin secretion. They require sustainable and efficient adaptive stress responses to cope with this stress. Whether episodes of chronic stress directly compromise β-cell identity is unknown. We show here under reversible, chronic stress conditions β-cells undergo transcriptional and translational reprogramming associated with impaired expression of regulators of β-cell function and identity. Upon recovery from stress, β-cells regain their identity and function, indicating a high degree of adaptive plasticity. Remarkably, while β-cells show resilience to episodic ER stress, when episodes exceed a threshold, β-cell identity is gradually lost. Single cell RNA-sequencing analysis of islets from type 1 diabetes patients indicates severe deregulation of the chronic stress-adaptation program and reveals novel biomarkers of diabetes progression. Our results suggest β-cell adaptive exhaustion contributes to diabetes pathogenesis.


Conflict of interest statement

The authors declare no competing interests.

Figures

Fig. 1
Fig. 1. MIN6 cells can simultaneously survive chronic ER stress and alter proinsulin proteostasis.
Western blot analysis (a), protein synthesis, n = 3 (b), and eIF2B GEF activity, n = 3 (c), measured in MIN6 cells treated with CPA as indicated. Cell viability (d), protein synthesis, n = 3 (e), and Western blot analysis (f) measured in MIN6 cells for the indicated treatments. qRT-PCR analysis for Ins1 and Ins2 mRNA levels normalized to GAPDH, n = 3 (g), and Western blot analysis for proinsulin, n = 3 (h), measured in MIN6 cells for the indicated treatments. i Fluorescence immunocytochemistry of proinsulin at 0 and 18 h of CPA treatment and 24 h of washout following CPA treatment. Scale bar represents 50 μm. Two independent experiments; The representative images were shown. Error bars represent S.E.M. p-value represents the statistical test by two-tailed paired Student’s t-test. Representative western blotting images were shown. Dots in all plots represent independent experiments. Source data are provided as a Source Data file.
Fig. 2
Fig. 2. Accumulation of cytoplasmic proinsulin granules in β-cells during chronic ER stress is conserved in rat and human species.
Fluorescence immunocytochemistry of MIN6 (a), INS1E (d), mouse islets (g) and EndoC βH3 (f), cells treated with CPA for 6 h and 18 h (MIN6), 6 h (INS1E) 18 h (mouse islets) and 72 h (EndoC βH3) for the indicated (color-coded) proteins. Boxes indicated the enlarged regions of images below each panel. b Quantitative analysis of the proinsulin puncta subcellular localization in the indicated treatments of MIN6 cells. c Fluorescence immunocytochemistry of MIN6 cells for the indicated proteins and treatments. e Reconstruction of stacking images represented by the box in d. h Schematic representation of the non-canonical exit of proinsulin from the ER. n, indicates number if cells from 3 independent experiments. The % of cells for the indicated phenotype are given in 2b in colored boxes and columns. Scale bar, 10 μm (a), 20 μm (c, d, f), 50 μm (g).
Fig. 3
Fig. 3. Analysis of transcriptomes and translatomes during progression from acute to chronic phase of ER stress in MIN6 cells.
Violin plots representing transcriptomes (a) and translatomes (b), of untreated (CON), 1 h CPA treated (CPA1) and 18 h CPA treated (CPA18) cells. The boxes indicate the 25–75th percentiles, the midline indicates the median, whiskers show the maximum/minimum. p-value represents the statistical test by two-sided Wilcoxon signed-rank test. Heatmaps and the classifications of changes in the expression of transcriptomes (c) and translatomes (d) between CON and CPA1 (CPA1/CON), CPA18 and CPA1 (CPA18/CPA1) and CPA18 and CON (CPA18/CON) datasets. Black symbol indicates the compared datasets. Three independent experiments were used with significance of gene expression. Letter code G1-G12 indicates the gene sets of assigned common regulation and n, indicates the number of genes per group. e KEGG pathway analysis of the classified groups of transcriptomes and translatomes. Boxed numbers indicate the number of genes identified in the individual pathways. FDR, False Discovery Rate.
Fig. 4
Fig. 4. Transcriptional and translational reprogramming in MIN6 cells in response to CPA induced ER stress.
Scatterplots of fold changes in CPA1 vs CON (a) and CPA18 vs CON (b). c, h Scatterplot of fold changes of the UPR signature (GO:0030968) gene expression between acute (CPA1/CON) and chronic (CPA18/CON) ER stress. d Scatterplot of fold changes of genes in groups identified in Fig. 3E (G6 and G3) in acute (CPA1/CON) and chronic (CPA18/CON) ER stress. e, i, j qRT-PCR analysis for the indicated mRNAs normalized to GAPDH mRNA levels, in MIN6 cells treated with CPA for the indicated times, n = 3. f, l Western blot analysis for the indicated proteins in MIN6 cells. g Scatterplot representing an association between Ins2 and MafA mRNA levels measured by qRT-PCR. k qRT-PCR analysis of Pcsk2 mRNA levels normalized to GAPDH mRNA levels, in MIN6 cells under the indicated treatments, n = 3. m Western blot analysis of proinsulin in non-reducing SDS-PAGE electrophoresis. Error bars represent S.E.M. p-value represents the statistical test by two-tailed paired Student’s t-test. Representative western blotting images were shown. Dots in all plots represent independent experiments. Source data are provided as a Source Data file.
Fig. 5
Fig. 5. Impairment of lysosome activity correlates with misfolded proinsulin accumulation during chronic ER stress.
a Scatterplot of fold changes in CPA18 vs CON MIN6 cells, with the repressed gene expression indicated in pink, and the KEGG pathway analysis of the highlighted group, below a. Scatterplots of fold change in acute (CPA1/CON) and chronic (CPA18/CON) ER stress for genes related to the proteasome (b) and the lysosome (c). d lysosome enzymatic activity measured in MIN6 cells treated with Baf A1 or CPA. n = 3 independent experiments. Error bars represent S.E.M. p-value represents the statistical test by two-tailed paired Student’s t-test. Source data are provided as a Source Data file. e Western blot analysis of the indicated proteins in MIN6 cells. f Fluorescence immunocytochemistry for LC3, in MIN6 cells treated with CPA for 18 h. Nuclei are indicated with staining in blue. Scale bar is 20 μm. g upper, schematic representation of 12 different MIN6 treatments with CPA, MG132 or Baf A1. Green lines indicate CPA treatment. CPA was washed out between 18–24 h; lower, Western blot analysis for proinsulin by non-reducing PAGE electrophoresis in extracts prepared from the 12 MIN6 treatments. Western blot analysis for ubiquitin by reducing PAGE electrophoresis.
Fig. 6
Fig. 6. Altered expression of the β-cell ER stress-induced gene set (regulome) in T1D islets reveals biomarkers of T1D progression.
a Schematic representation of the β-cell ER stress gene set (334 genes) in MIN6 cells and determination of its expression in T1D islets or scRNA-seq datasets. Scatterplot indicates in color the expression patterns of the 334 gene set during chronic ER stress in MIN6 cells. The KEEG pathway of the 334 gene set is shown below a. b The 334 gene set expression profile in T1D islet microarray datasets, shown by a volcano plot. p-value represents the statistical test between CON and T1D by two-sided Wilcoxon–Mann–Whitney test. c Venn-diagram showing the common repressed genes of the 334 gene set in T1D, between islet microarray and β-cells scRNA-seq datasets. p-value represents the statistical test between CON and T1D by two-sided Wilcoxon–Mann–Whitney test. d Expression of genes in β-cells scRNA-seq datasets of healthy donors (CON), early T1D (T1D ≦3 years) and prolonged T1D (T1D = 7 years) patients. p-value represents the statistical test by two-sided Wilcoxon–Mann–Whitney test. e Scatterplot of fold change in MIN6 cells during chronic ER stress (CPA18 vs CON). f Heatmap of gene expression profiles of the 334 gene set in different cell types of T1D scRNA-seq datasets, compared to healthy donors.
Fig. 7
Fig. 7. Progression of T1D pathogenesis correlates with ER-stress-induced adaptive exhaustion and suppression of β-cell maturity markers.
a Schematic representation of the common genes between the β-cell specific adaptome in MIN6 cells (78 genes) and the β-cells scRNA-seq datasets. Plots show the regulation of the 46 genes in MIN6 cells during acute and chronic ER stress (middle) and β-cells scRNA-seq from healthy and T1D patients (right). b Relevant distance in gene expression between two data sets: (tSNE1) scRNA-seq dataset from all human β-cells (healthy and T1D, 8349) and (tSNE2) the expression of a group of genes consisting of both, the UPR signature genes (GO:0030968), and 6 β-cell-specific gene markers (INS, PAX6, NKX2.2, NKX6.1, MAFA and PDX1). Colored from left to right, T1D progression, INS, BiP and WFS1. Darker color indicates higher expression of the respective genes. Raw data were normalized as described in Materials and Methods. c pseudotime analaysis of tSNE data from b, showing decrease in β-cell markers and increase in BiP. d Schematic of stress/recovery cycles and Western blot analysis of UPR and β-cell identity genes. e Western blot analysis of the indicated proteins in MIN6 cell extracts isolated from the time points indicated in d. f qRT-PCR analysis of RNA levels normalized to GAPDH mRNA, for Ins1, Ins2, MafA and Herpud1 mRNAs in the last 2 stress/recovery cycles. n = 3 independent experiments. Error bars represent S.E.M. All comparisons were to sample 1. p-value represents the statistical test by two-tailed paired Student’s t-test. Dots in all plots represent independent experiments. Individual p-values (*) and source data are provided as a Source Data file. g Working hypothesis model of βEAR in T1D pathogenesis.

References

    1. Scheuner D, Kaufman RJ. The unfolded protein response: a pathway that links insulin demand with beta-cell failure and diabetes. Endocr. Rev. 2008;29:317–333. doi: 10.1210/er.2007-0039. - DOI - PMC - PubMed
    1. Eizirik DL, Cnop M. ER stress in pancreatic beta cells: the thin red line between adaptation and failure. Sci. Signal. 2010;3:pe7. doi: 10.1126/scisignal.3110pe7. - DOI - PubMed
    1. Fonseca SG, Gromada J, Urano F. Endoplasmic reticulum stress and pancreatic beta-cell death. Trends Endocrinol. Metab.: TEM. 2011;22:266–274. - PMC - PubMed
    1. Ron D, Walter P. Signal integration in the endoplasmic reticulum unfolded protein response. Nat. Rev. Mol. cell Biol. 2007;8:519–529. doi: 10.1038/nrm2199. - DOI - PubMed
    1. Krokowski D, et al. A self-defeating anabolic program leads to beta-cell apoptosis in endoplasmic reticulum stress-induced diabetes via regulation of amino acid flux. J. Biol. Chem. 2013;288:17202–17213. doi: 10.1074/jbc.M113.466920. - DOI - PMC - PubMed

Publication types

MeSH terms