. 2022 Aug 8;13(1):4637.
doi: 10.1038/s41467-022-32150-1.

Quantum-assisted distortion-free audio signal sensing

Affiliations

Quantum-assisted distortion-free audio signal sensing

Chen Zhang et al. Nat Commun. .

Abstract

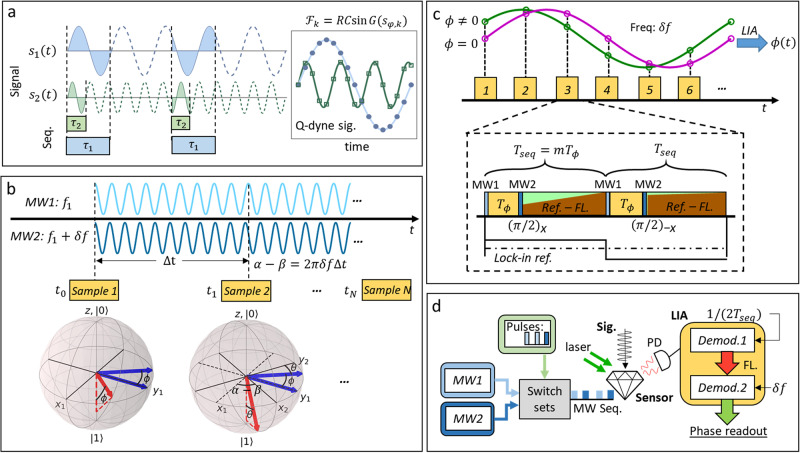
Quantum sensors are known for their high sensitivity in sensing applications. However, this sensitivity often comes with severe restrictions on other parameters which are also important. Examples are that in measurements of arbitrary signals, limitation in linear dynamic range could introduce distortions in magnitude and phase of the signal. High frequency resolution is another important feature for reconstructing unknown signals. Here, we demonstrate a distortion-free quantum sensing protocol that combines a quantum phase-sensitive detection with heterodyne readout. We present theoretical and experimental investigations using nitrogen-vacancy centers in diamond, showing the capability of reconstructing audio frequency signals with an extended linear dynamic range and high frequency resolution. Melody and speech based signals are used for demonstrating the features. The methods could broaden the horizon for quantum sensors towards applications, e.g. telecommunication in challenging environment, where low-distortion measurements are required at multiple frequency bands within a limited volume.


Conflict of interest statement

The authors declare no competing interests.

Figures

Fig. 1
Fig. 1. Phase-sensitive NV magnetometry.
a Continuous sampling induced phase reviving signals, known as the quantum heterodyne (Q-dyne) detection. Field interaction time should be set in measurement sequences as τ1 or τ2 for different frequencies of the signals s1 or s2. Fk is the fluorescence signal, where k denotes the number of the output series number, R is the photon rate and C is the contrast. G(sϕ, k) is the sequence response to the field s, which should be small to ensure the linearity. b Rotating frame modulation induced by the evolving phase difference of the two driving MW fields. The MWs acquire a phase difference as α − β = 2πδfΔt after a sampling time interval Δt due to the frequency offset δf. The picture of Bloch spheres shows the process of rotating frame modulation, in which x1y1z is the rotating frame defined by MW1, and x2y2z is the rotating frame defined by MW2. ϕ is the accumulated quantum phase during the sensing interval. The acquired quantum phase is θ = 2πδfΔt − ϕ at sample 2. Both the red vectors are the final states of the two samples, and the projections are acquired as the curves in c, where we present the measurements when ϕ = 0 and ϕ ≠ 0. The phase factor ϕ can be extracted by a lock-in amplifier. Measurement sequence is shown in the dashed box. Tϕ is the field interaction time, during which pulses are applied using MW1 The light and dark blue blocks are the π/2 pulses used for the interferometry and the dark blue pulses use MW2. The green and red represent the acquisition windows, in which the green is the laser reference and the red is the fluoresces. Tseq is the length of each sequence part and m ≥ 2 is an integer. d Schematic of the experiment. NV centers ensemble in diamond is used to perform the QPSD readout.
Fig. 2
Fig. 2. Sensing performance of the QPSD.
a Spectra and linearity comparison of the fluorescence readout and QPSD readout in Ramsey measurements. The measured results of the two readout schemes are both plotted under the spectra, while the dashed line shows the amplitudes of applied fields. b Spectra and linearity comparison of the fluorescence readout and QPSD readout in Hahn-echo measurements. c Calibration of test coils and the sensor readouts. Calibr. 1 corresponds to the QPSD readout and Calibr. 2 corresponds to the fluorescence readout. The test coil is moved between the two measurements for verification. d The noise power spectra of the QPSD readout with/without a calibration signal. The inset is a 1 Hz excerpt of the fluorescence detected magnetic field noise spectrum. e Robustness of the QPSD scheme. Normalized signal responses of the two schemes with different sampling frequencies are plotted, and the QPSD readout is expected to be 1 as the dashed line shows. f Measurement bandwidth is limited by time constant of the LIA. Ramsey and Hahn-echo sequences are applied to measure test fields at different frequencies with the same magnitude.
Fig. 3
Fig. 3. Frequency offset heterodyne readout.
a Principle of the readout scheme. fϕ is the reference frequency defined by the sequence, and f1, f2 are the frequencies of the signals. The colored regions mark where the quantum phase is accumulated in the Hahn-echo sequence, while phase accumulations at the other areas are canceled in the spin evolution. The figure shows identical heterodyne signals due to fϕ − f1 = f2 − fϕ. b Frequency responses of the Hahn-echo sequence and CPMG-2 sequence. The applied ac fields have an 5 Hz offset to the denoted signal frequencies so that they are detected as a 5 Hz heterodyne readout. Both theoretical and experimental results are plotted after normalization. c Signal frequency response of Hahn-echo measurements with 1/Tseq = 10 kHz. The dash line indicates the filter introduced by the lock-in amplifier. d Heterodyne frequency dependency to sequences and signal. The reference signal is the result of detecting 20.005 kHz signal with sequence that uses Tϕ = 50 μs and Tseq = 20Tϕ. In meas. 1, Tϕ is changed by ±4 ns. In meas. 2, we keep Tϕ unchanged, and offset Tseq with ±4 ns. In meas. 3, the applied field is changed to 16.005 kHz while the other parameters are the same as meas. 2.
Fig. 4
Fig. 4. Detection of arbitrary audio signals.
a Phase response of the QPSD measurement. The bars show the phases dynamics of the applied magnetic field. Stars mark the QPSD readout of the sensor, and the curve is the simulated readout. b QPSD readout of an ac field around 10 kHz with the frequency, amplitude and phase switched every 100 ms. The waveform of the applied field is plotted in light blue, and the red curve is the QPSD heterodyne readout. c Spectral comparison of the applied signal and the detected magnetic field in a 400 Hz bandwidth. The blue remarks denote the applied signals mathematically. d A signal with wide bandwidth between 10 to 15 kHz is applied and detected by varying the sequence. The red dash line shows the spectrum of the output of the AWG. The solid black line is the spectrum of the QPSD readout. The magnitude of the AWG spectrum is scaled to the same level of QPSD readout for eye guidance.

References

    1. Gustavson TL, Bouyer P, Kasevich MA. Precision rotation measurements with an atom interferometer gyroscope. Phys. Rev. Lett. 1997;78:2046–2049. doi: 10.1103/PhysRevLett.78.2046. - DOI
    1. Allred JC, Lyman RN, Kornack TW, Romalis MV. High-sensitivity atomic magnetometer unaffected by spin-exchange relaxation. Phys. Rev. Lett. 2002;89:130801. doi: 10.1103/PhysRevLett.89.130801. - DOI - PubMed
    1. Hinkley N, et al. An atomic clock with 10–18 instability. Science. 2013;341:1215–1218. doi: 10.1126/science.1240420. - DOI - PubMed
    1. Kominis IK, Kornack TW, Allred JC, Romalis MV. A subfemtotesla multichannel atomic magnetometer. Nature. 2003;422:596–599. doi: 10.1038/nature01484. - DOI - PubMed
    1. Kornack TW, Ghosh RK, Romalis MV. Nuclear spin gyroscope based on an atomic comagnetometer. Phys. Rev. Lett. 2005;95:230801. doi: 10.1103/PhysRevLett.95.230801. - DOI - PubMed

LinkOut - more resources