. 2022 Nov;16(11):2561-2573.
doi: 10.1038/s41396-022-01300-0. Epub 2022 Aug 8.

Nitrogen cycling and microbial cooperation in the terrestrial subsurface

Affiliations

Nitrogen cycling and microbial cooperation in the terrestrial subsurface

Olivia E Mosley et al. ISME J. 2022 Nov.

Abstract

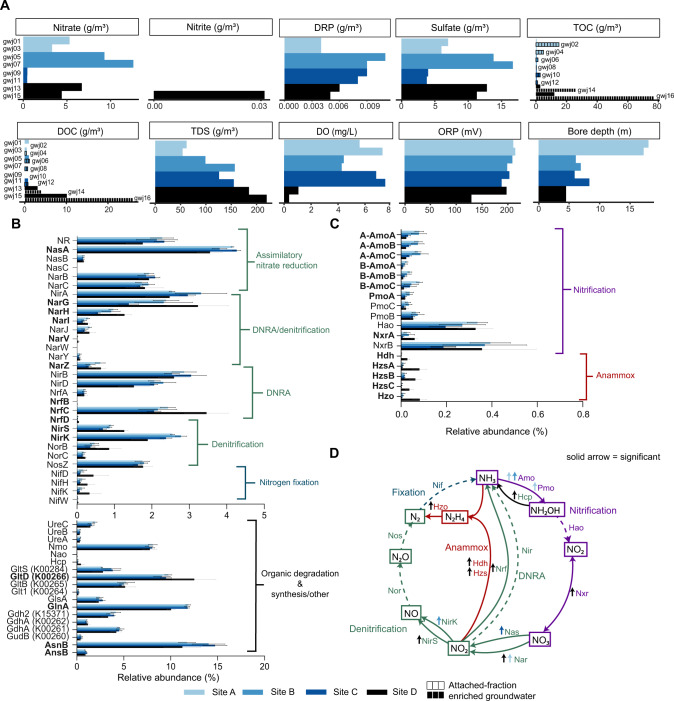
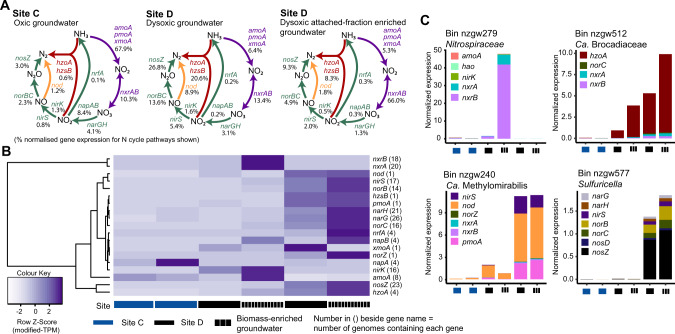
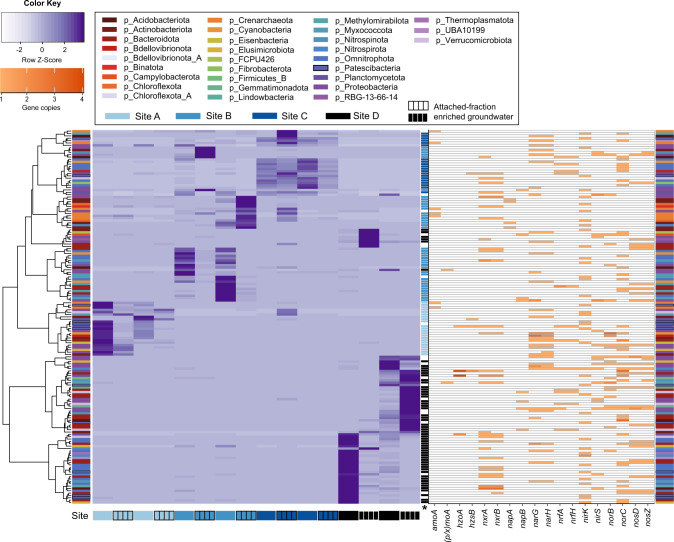
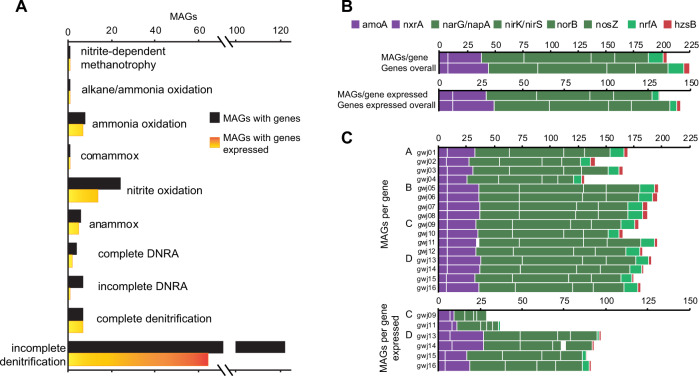
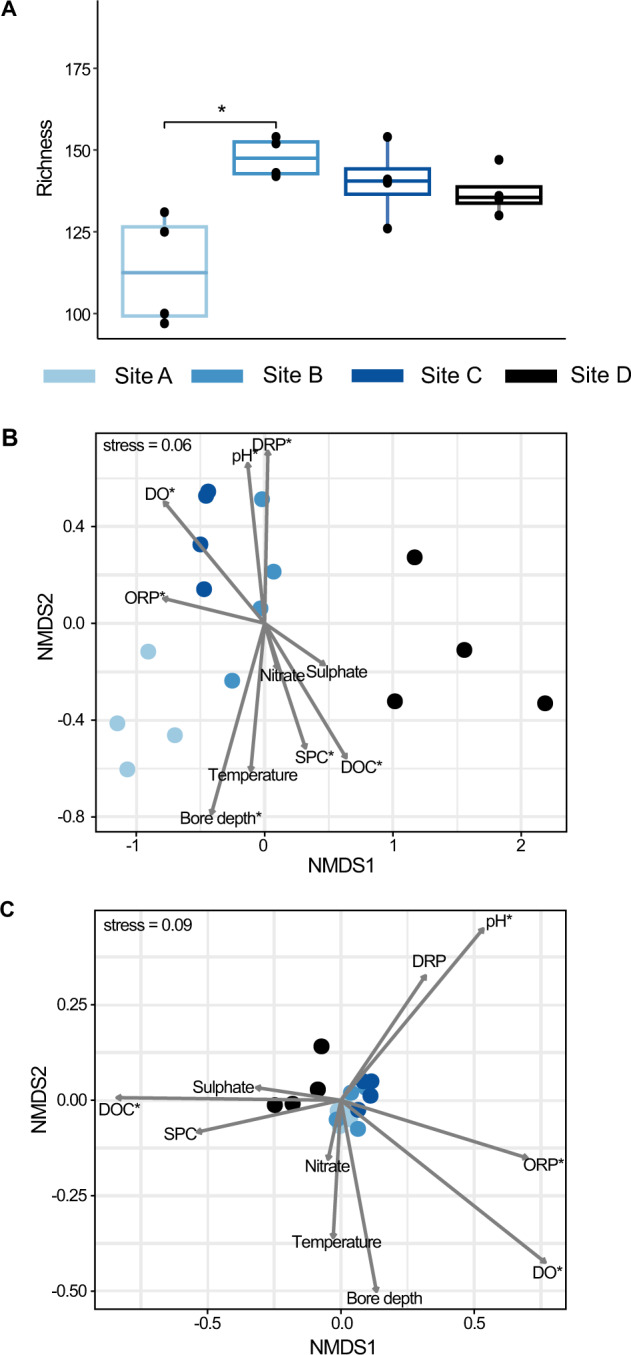
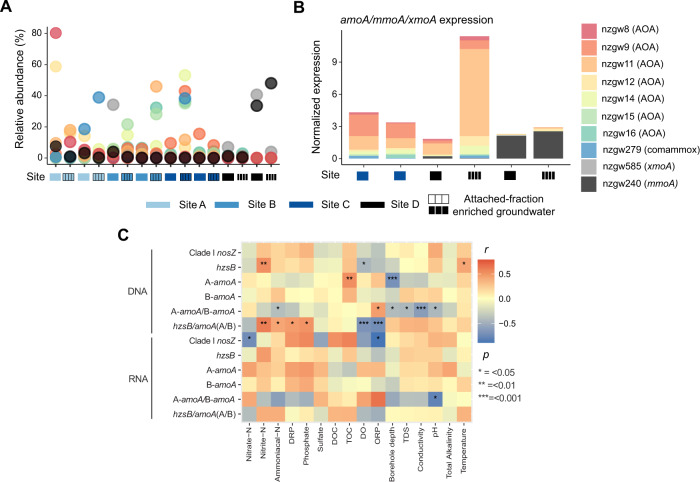
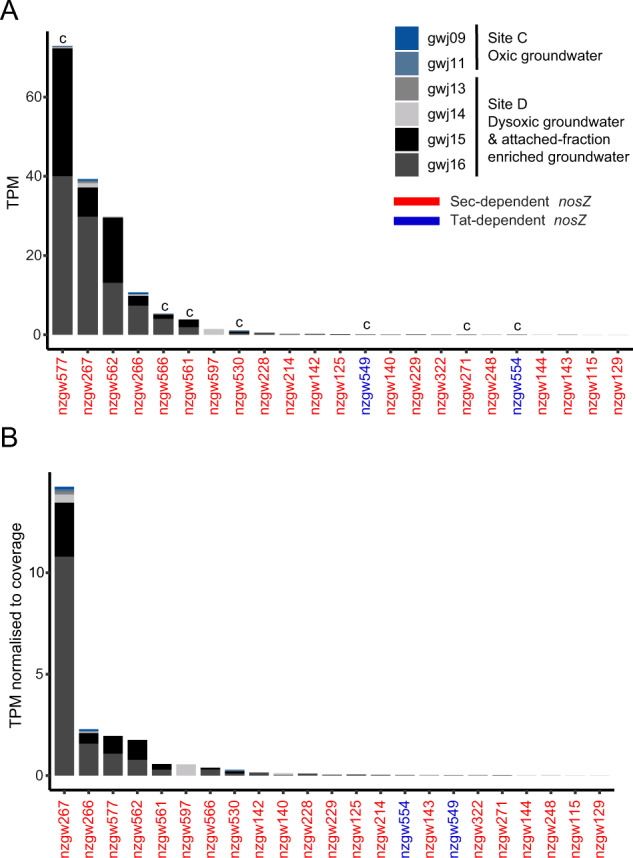
The nitrogen cycle plays a major role in aquatic nitrogen transformations, including in the terrestrial subsurface. However, the variety of transformations remains understudied. To determine how nitrogen cycling microorganisms respond to different aquifer chemistries, we sampled groundwater with varying nutrient and oxygen contents. Genes and transcripts involved in major nitrogen-cycling pathways were quantified from 55 and 26 sites, respectively, and metagenomes and metatranscriptomes were analyzed from a subset of oxic and dysoxic sites (0.3-1.1 mg/L bulk dissolved oxygen). Nitrogen-cycling mechanisms (e.g. ammonia oxidation, denitrification, dissimilatory nitrate reduction to ammonium) were prevalent and highly redundant, regardless of site-specific physicochemistry or nitrate availability, and present in 40% of reconstructed genomes, suggesting that nitrogen cycling is a core function of aquifer communities. Transcriptional activity for nitrification, denitrification, nitrite-dependent anaerobic methane oxidation and anaerobic ammonia oxidation (anammox) occurred simultaneously in oxic and dysoxic groundwater, indicating the availability of oxic-anoxic interfaces. Concurrent activity by these microorganisms indicates potential synergisms through metabolite exchange across these interfaces (e.g. nitrite and oxygen). Fragmented denitrification pathway encoding and transcription was widespread among groundwater bacteria, although a considerable proportion of associated transcriptional activity was driven by complete denitrifiers, especially under dysoxic conditions. Despite large differences in transcription, the capacity for the final steps of denitrification was largely invariant to aquifer conditions, and most genes and transcripts encoding N2O reductases were the atypical Sec-dependant type, suggesting energy-efficiency prioritization. Results provide insights into the capacity for cooperative relationships in groundwater communities, and the richness and complexity of metabolic mechanisms leading to the loss of fixed nitrogen.


Conflict of interest statement

The authors declare no competing interests.

Figures

Fig. 1
Fig. 1. Geochemistry and protein-coding sequences (based on reads) involved in nitrogen cycling that are significantly different among sites used for metagenomics.
A Bar plots showing geochemical data from groundwater samples, coloured according to site. Solid bar colour = groundwater samples. Grid lines = attached-fraction enriched groundwater. All samples from site D were characterized as dysoxic, although gwj15-16 contained 0.37 mg/L DO, which are near suboxic levels (i.e. <0.3 mg/L). For all samples shown, ammoniacal-N values were below detection. B, C Bar plots showing the abundance (average of four wells per site and standard deviation) of sequence reads encoding dissimilatory and assimilatory nitrogen-cycling proteins relative to all nitrogen-cycling processes. Predicted proteins that were statistically different between sites are bolded (y-axis). D Schematic of the nitrogen cycle displaying statistically significant differences between sites (LEfSe, Kruskal–Wallis test, p < 0.05). Solid lines depict pathways that were significantly more abundant across the sites, whereas dashed lines indicate no significant difference. Arrows indicate the site with significantly more genes. Abbreviations: A-Amo Archaeal Amo, B-Amo Bacterial Amo, Amo ammonia monooxygenase, Pmo Particulate methane monooxygenase, Hao hydroxylamine oxidoreductase, Nxr nitrite oxidoreductase, Nar nitrate reductase (dissimilatory), Nas nitrate reductase (assimilatory), NirK copper-containing nitrite reductase, NirS cytochrome cd1-containing nitrite reductase, Nor nitric oxide reductase, Nos nitrous oxide reductase, Nif nitrogenase (various), Hcp hydroxylamine reductase, Nir NADPH-nitrite reductase, Nrf nitrate reductase (associated with Nap), Hdh hydrazine hydrogenase, Hzs hydrazine synthase, Hzo hydrazine oxidoreductase.
Fig. 2
Fig. 2. Nitrogen-cycling gene transcription at site C groundwater and site D groundwater and attached-fraction enriched groundwater.
A Nitrogen cycle schematics display the average abundance of nitrogen-cycling transcripts (based on modified-TPM values) per site and sample type (relative to nitrogen-cycling pathways overall (as shown). The percentage of gene transcripts associated with each pathway component is shown in black font. Coloured arrows represent pathways (purple = nitrification, green = denitrification and red = anammox). Only NrfA and not NirBD are shown for the DNRA pathway. B Heatmap shows nitrogen-cycling modified transcripts per million (modified-TPM) at each site (ordered gwj9, gwj11, gwj13-gwj16), scaled by row (Z-Score). Solid coloured blocks represent groundwater, black grid blocks represent the attached-fraction (or biomass) enriched groundwater. C Stacked bar plots display four active nitrogen-cycling genomes and the relative abundance (modified-TPM normalized to genome coverage) of their nitrogen-cycling gene transcripts across each site. Abbreviations: amo ammonia monooxygenase, pmo particulate methane monooxygenase, xmo copper-containing membrane monooxygenase, nod nitric oxide dismutase, nxr nitrite oxidoreductase, nar nitrate reductase (dissimilatory), nap periplasmic nitrate reductase, nirK copper-containing nitrite reductase, nirS cytochrome cd1-containing nitrite reductase, nor nitric oxide reductase, nos nitrous oxide reductase, nrf nitrate reductase, hzo hydrazine oxidoreductase, hao hydroxylamine oxidoreductase.
Fig. 3
Fig. 3. Heatmap showing 159 MAGs, coloured according to phylum, that contain nitrogen-cycling genes involved in non-assimilatory reduction and oxidation of N species in groundwater.
Purple gradient (right) represents genome coverage scaled by row (Z-Score) across sites A–D (ordered gwj01-16). Rows = MAGs; columns = samples per site (groundwater and attached-fraction enriched groundwater). Orange gradient (right) represents number of nitrogen-cycling gene copies per genome. Microorganisms are ordered based on hierarchical clustering of abundance based Bray-Curtis dissimilarity matrix with ward.D2 clustering method. Final column (labelled with asterisk) indicates genomes that were significantly more abundant at a particular site (coloured rectangle) based on LEfSe analysis.
Fig. 4
Fig. 4. Plots showing the distribution of N cycling mechanisms across MAGs, including DNRA and denitrification pathway fragmentation.
A Number of MAGs with genes or genes expressed per pathway, with indicative genes required for each step from nitrate to ammonia or N2 to denote complete DNRA or denitrification potential, respectively. B Number of MAGs with marker genes and marker genes overall for key N cycling processes: two steps for nitrification (purple), four steps for denitrification (dark green), DNRA (light green), and anammox (red). C Number of MAGs with at least one copy of each marker gene or marker gene expressed across groundwater samples and sites (A–D).
Fig. 5
Fig. 5. Diversity of community fractions with N cycling capacity.
A Boxplots showing the median and interquartile range of richness of MAGs capable of nitrogen-cycling. Black solid circles show actual sample richness. Sites with significantly different richness are indicated by an overlying line and asterisk (Wilcoxon test, p < 0.05). B Non-metric Multi-dimensional Scaling plot showing groundwater community relatedness based on a Bray–Curtis dissimilarity matrix constructed using the relative abundance of MAGs with nitrogen-cycling genes. C Non-metric Multi-dimensional Scaling plot based on a Bray–Curtis dissimilarity matrix constructed using the relative abundance of protein-coding sequences in metagenomic reads. For ordinations environmental variables (Table S1) were fitted using envfit, and significant variables are indicated with an asterisk = p < 0.05. Ammoniacal-N and nitrite are not shown as >50% of values were below the detection limit and >50% of TKN values are missing.
Fig. 6
Fig. 6. Composition and transcriptional activity of ammonia-oxidizers, and relationship between ammonia-oxidizers, denitrifiers and anammox bacteria to geochemical and physical parameters.
A Relative abundance of each MAG capable of aerobic ammonia oxidation across the sites. B Stacked barplot showing modified transcripts per million, normalized to genome coverage, of amoA, pmoA and xmoA across sites (wells SR1, SR2, E1, N3). The 7 AOA are associated with 5 genera: Nitrosotenuis (nzgw11), UBA8516 (nzgw12–14), Nitrososphaera (nzgw16), Nitrosoarchaeum (nzgw8-9) and an unclassified genus in Nitrososphaeraceae (nzgw15). The xmoA is part of a gene cluster in MAG nzgw585, recovered from the dysoxic site and classified as Gammaproteobacteria genus Nevskia, which encodes a copper-containing membrane monooxygenase (CuMMO/xmoCAB). The alpha subunit had best hits to Polycyclovorans sp. SAT60 and gammaproteobacterial isolate MMS_B.mb.28 (85.71% amino acid identity, NCBI NR database). CuMMO catalyzes the oxidation of short-chain alkanes, ammonia or methane [103]. C Spearman’s rank correlations between the abundance (copies/L) of nitrogen-cycling genes (DNA, samples = 64) and transcripts (RNA, samples = 26 above detection limit) determined via ddPCR and geochemical parameters (Table S11). Significant correlations are indicated by * are based on Bonferroni adjusted p values (p).
Fig. 7
Fig. 7. Nitrous-oxide reductase (nosZ) gene transcripts in sites C and D groundwater and attached-fraction enriched groundwater.
A Stacked barplot shows modified-TPM of Sec- and Tat- dependent nosZ genes at each site. B Stacked barplot shows modified-TPM normalized to genome coverage of Sec- and Tat-dependent nosZ genes at each site. While complete denitrifier, Sulfuricella MAG nzgw577, contributed the most transcripts, after normalizing to MAG relative abundance, nosZ genes from two novel Nitrospinota MAGs (nzgw266-267, class UBA7883 [104]) were transcriptionally most active. c = MAGs which contain genes for the complete denitrification pathway (nzgw numbers: 271, 530, 549, 554, 561, 566, and 577).

References

    1. Taylor RG, Scanlon B, Döll P, Rodell M, Van Beek R, Wada Y, et al. Groundwater and climate change. Nat Clim Chang. 2013;3:322–9. doi: 10.1038/nclimate1744. - DOI
    1. Aeschbach-Hertig W, Gleeson T. Regional strategies for the accelerating global problem of groundwater depletion. Nat Geosci. 2012;5:853–61. doi: 10.1038/ngeo1617. - DOI
    1. Alley WM, Healy RW, LaBaugh JW, Reilly TE. Flow and storage in groundwater systems. Science. 2002;296:1985–90. doi: 10.1126/science.1067123. - DOI - PubMed
    1. Morgenstern U, Daughney CJ. Groundwater age for identification of baseline groundwater quality and impacts of land-use intensification - The National Groundwater Monitoring Programme of New Zealand. J Hydrol. 2012;456–457:79–93. doi: 10.1016/j.jhydrol.2012.06.010. - DOI
    1. Rivett MO, Buss SR, Morgan P, Smith JWN, Bemment CD. Nitrate attenuation in groundwater: a review of biogeochemical controlling processes. Water Res. 2008;42:4215–32. doi: 10.1016/j.watres.2008.07.020. - DOI - PubMed

Publication types