. 2022 Aug 8;5(1):797.
doi: 10.1038/s42003-022-03704-2.

Chromatin compaction precedes apoptosis in developing neurons

Affiliations

Chromatin compaction precedes apoptosis in developing neurons

Renata Rose et al. Commun Biol. .

Abstract

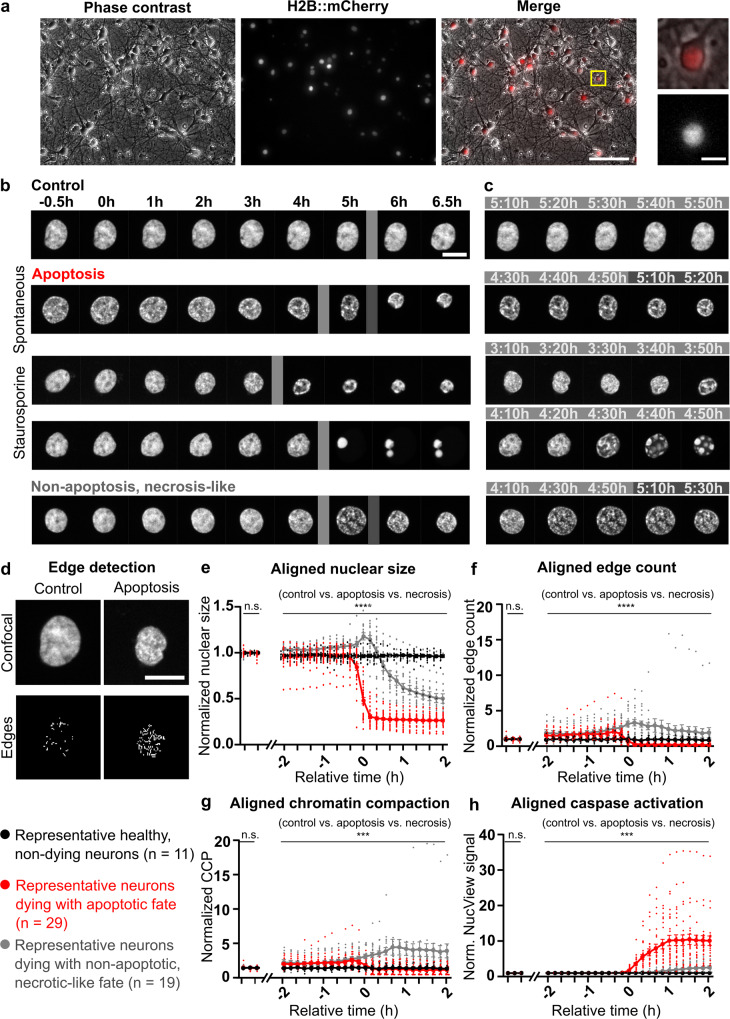
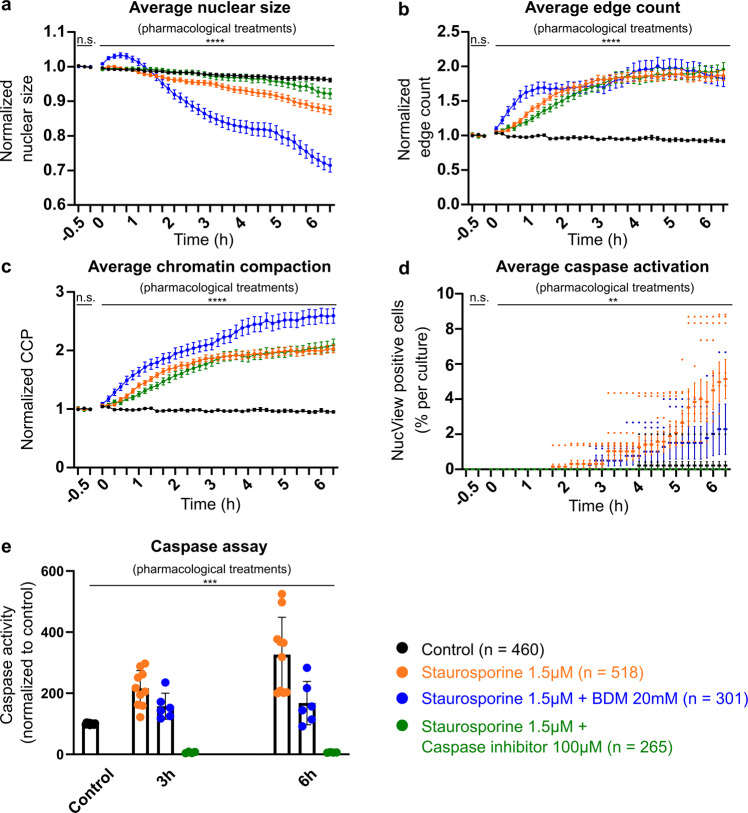
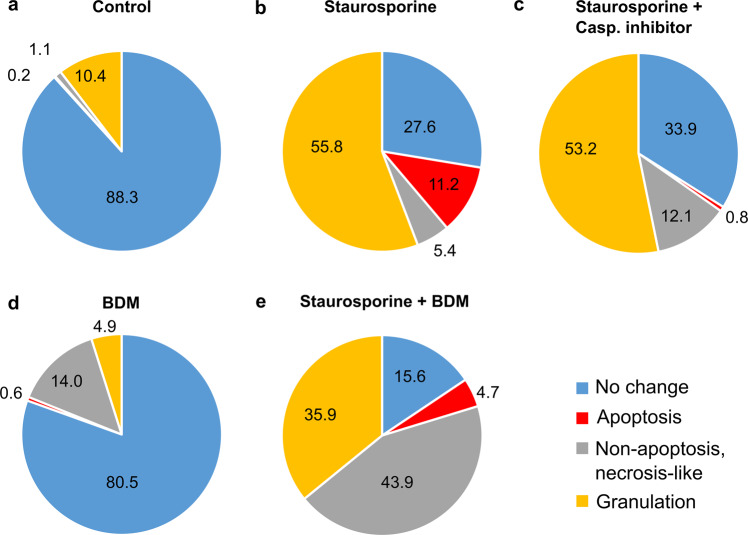
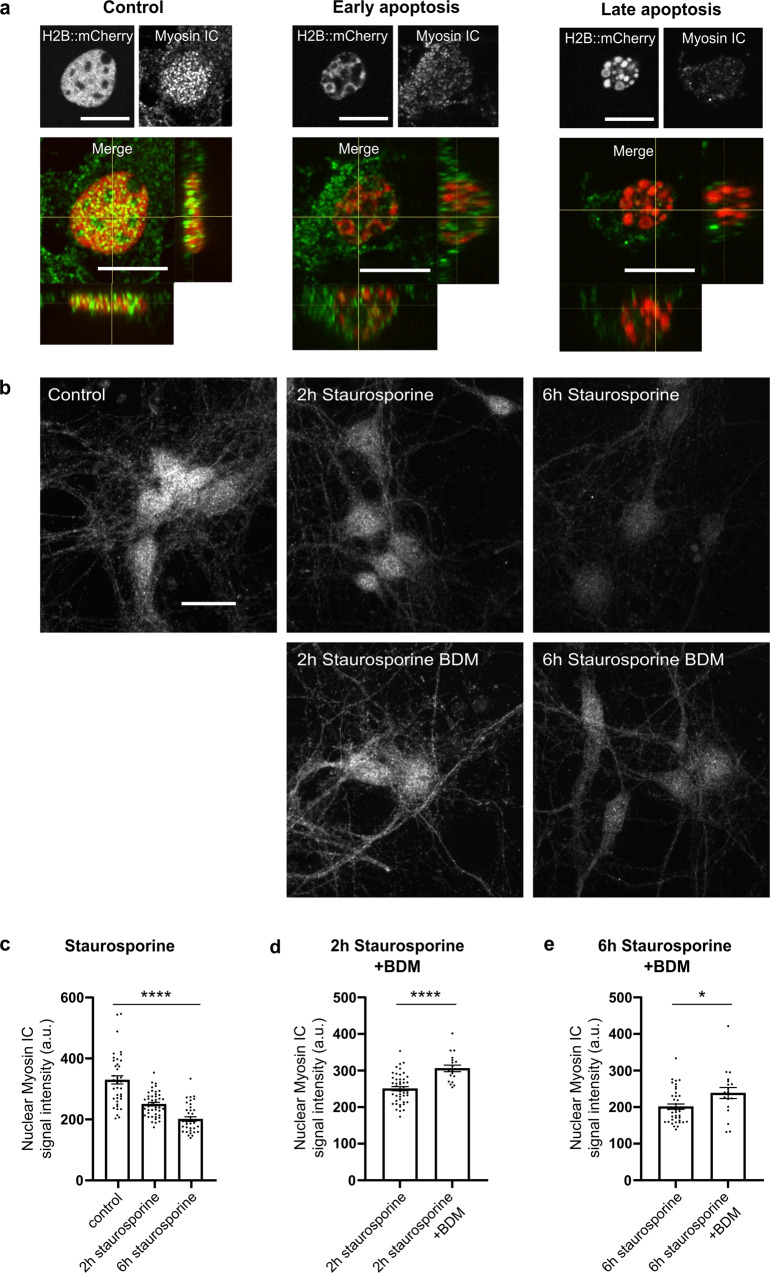
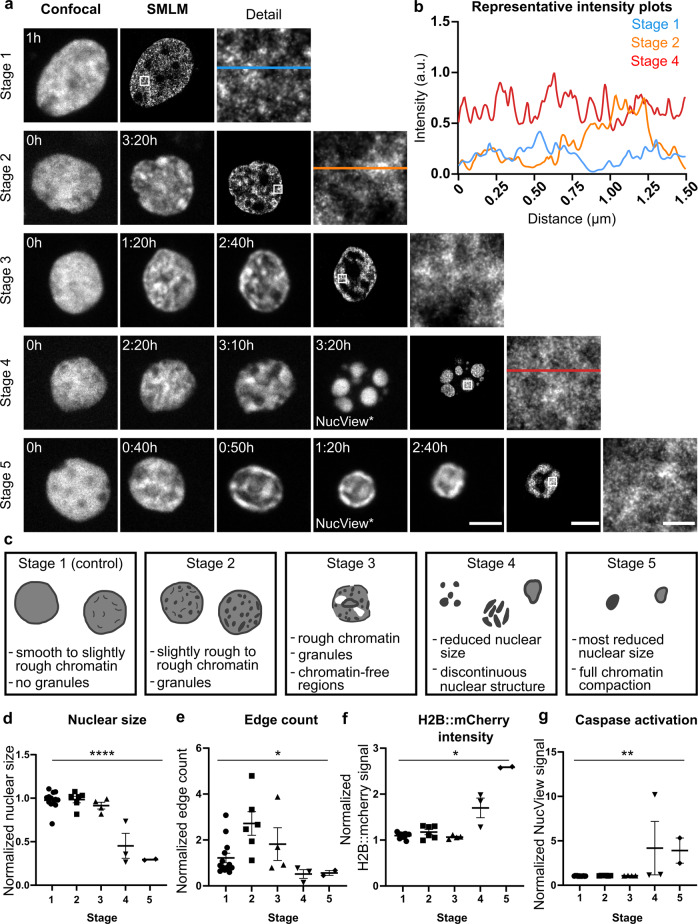
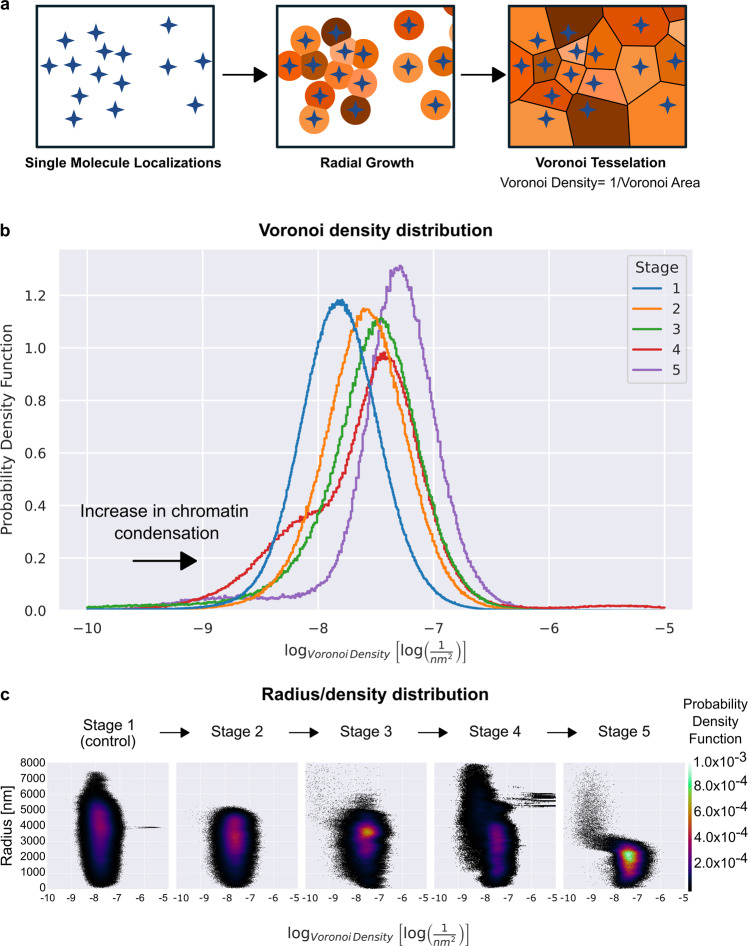
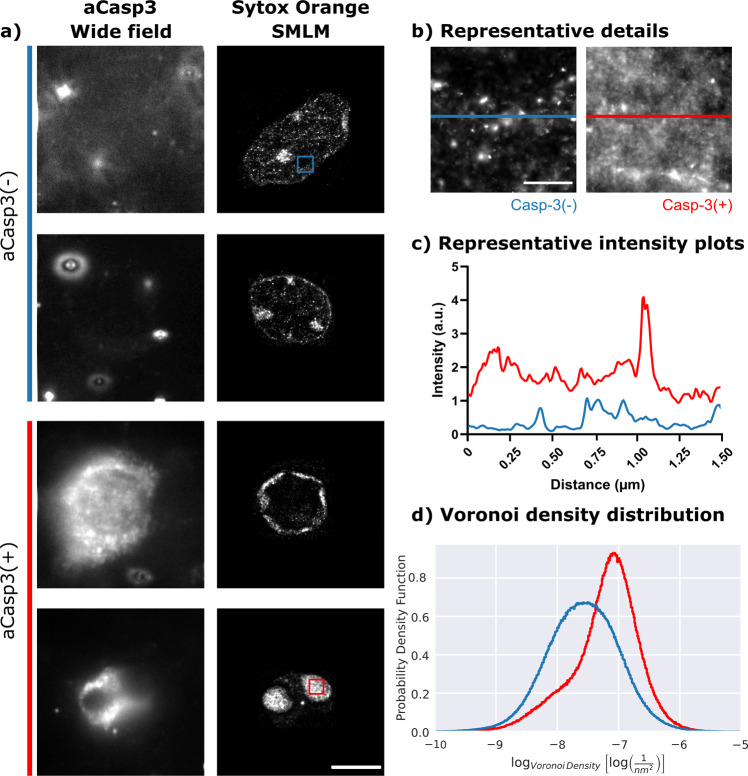
While major changes in cellular morphology during apoptosis have been well described, the subcellular changes in nuclear architecture involved in this process remain poorly understood. Imaging of nucleosomes in cortical neurons in vitro before and during apoptosis revealed that chromatin compaction precedes the activation of caspase-3 and nucleus shrinkage. While this early chromatin compaction remained unaffected by pharmacological blockade of the final execution of apoptosis through caspase-3 inhibition, interfering with the chromatin dynamics by modulation of actomyosin activity prevented apoptosis, but resulted in necrotic-like cell death instead. With super-resolution imaging at different phases of apoptosis in vitro and in vivo, we demonstrate that chromatin compaction occurs progressively and can be classified into five stages. In conclusion, we show that compaction of chromatin in the neuronal nucleus precedes apoptosis execution. These early changes in chromatin structure critically affect apoptotic cell death and are not part of the final execution of the apoptotic process in developing cortical neurons.


Conflict of interest statement

The authors declare no competing interests.

Figures

Fig. 1
Fig. 1. Nuclear structure and chromatin dynamics during apoptotic and non-apoptotic, necrotic-like cell death in primary cortical neurons.
a Representative primary cortical culture at DIV 8 transduced with recombinant adeno-associated virus (AAV) to express the chromatin marker H2B::mCherry under the human synapsin promotor; left: phase contrast, middle: H2B::mCherry, right: merge; scale 100 µm. Detail on the far right: top: merged, bottom: H2B::mCherry; scale 10 µm. b Hourly captures of representative cells during a 7 h time lapse acquisition, before and after start of apoptotic or non-apoptotic processes, scale 10 µm. Gray vertical lines indicate which time points are depicted in c, see SuppMov.1-5. c Depiction of chromatin dynamics during the most striking nuclear changes for typical types of cell death between time points indicated with the gray vertical lines in b. d Typical examples for raw confocal signal (top) and Sobel-filter-based edge detection (bottom) under control conditions (left) and apoptotic neurons (right), scale 10 µm. eh Aligned and normalized average nuclear size, edge count, chromatin compaction parameter (CCP), and caspase activity normalized to baseline for representative neurons surviving under control conditions (black, n = 11), classified as apoptotic (red, n = 29) and classified as non-apoptotic, necrotic-like (gray, n = 19). Corresponding signals were aligned according to the occurrence of a change in nuclear size (t = 0 h is time of shrinkage for apoptosis and swelling for non-apoptosis, necrosis-like cell death). Imaging was performed every 10 min and the first 3 time points correspond to baseline. Data are represented as mean ± SEM. For eh mixed-effects analyses for differences between cells with apoptotic vs necrotic cell fate vs. control conditions were applied during baseline: nuclear size F(2, 168) = 1.51e−15, p > 0.9999; edge count F(2, 168) = 5.48e−16, p > 0.9999; CCP F(2, 168) = 3.53e−16, p > 0.9999; caspase activity F(2, 168) = 1.01e−11, p > 0.9999, and for the aligned time period of −2 to +2 h: nuclear size F(2, 56) = 107.7, p < 0.0001; edge count F(2, 56) = 10.82, p = 0.0001; CCP F(2, 56) = 8.87, p = 0.001; caspase activity F(2, 56) = 23.33, p < 0.0001.
Fig. 2
Fig. 2. Pharmacological inhibition of caspase-3 blocked apoptosis but not preceding compaction, whereas blockade of myosin activity induced non-apoptosis, necrosis-like cell death.
Live cell confocal images were acquired every 10 min for 3 time points before the application of the pharmacological treatments (baseline), and for an additional 39 time points (i.e., 6.5 h) after application of indicated pharmacological treatments. ac Normalized nuclear size, edge count and CCP for all neurons under control (black, n = 460 cells), staurosporine (1.5 µM; orange, n = 518 cells), BDM (20 mM) with staurosporine (blue, n = 301 cells), and caspase-3 inhibitor Z-DEVD-FMK (100 µM) with staurosporine (green, n = 265 cells) conditions. Note, that while the combined application of caspase-3 inhibitor with staurosporine blocked average caspase activation and reduced the nuclear size change, no significant differences in time course and extent of early chromatin compaction were found between caspase-3 inhibitor with staurosporine and staurosporine-only treated neurons. d Mean percentage of NucView-positive cells (caspase activation) per culture (control n = 9 cultures, staurosporine n = 9 cultures, caspase-3 inhibitor Z-DEVD-FMK with staurosporine n = 5 cultures, BDM with staurosporine n = 5 cultures) identified throughout the acquisition. e Caspase activity measured by luminescent caspase assay at DIV8 under baseline conditions, as well as 3 h and 6 h after start of pharmacological treatments. Data are represented as mean ± SEM. For ad two-way ANOVA was applied to detect differences across pharmacological treatments during baseline: nuclear size F(3, 4620) = 0, p > 0.9999; edge count F(3, 4620) = 3.45e−13, p > 0.9999; CCP F(3, 4620) = 0.0, p > 0.9999; mean percentage of NucView-positive cells F(3, 24) = 0.000, and during the time period after application of pharmacological treatments: nuclear size F(3, 60060) = 906.2, p < 0.0001; edge count F(3, 60060) = 1526, p < 0.0001; CCP F(3, 60060) = 2344, p < 0.0001; mean percentage of NucView-positive cells F(3, 24) = 4.82, p = 0.0092. For e a Kruskal-Wallis test was applied: H(7) = 39.56, p < 0.001.
Fig. 3
Fig. 3. Relative proportion of cell fates following different pharmacological treatments.
Relative percentage of neurons that display no change, clear apoptotic, non-apoptotic necrotic-like cell fate, or high chromatin compaction defined as granulation upon different pharmacological treatments (control n = 460 cells from 9 experiments; staurosporine n = 518 cells from 9 experiments; staurosporine with caspase-3 inhibitor n = 265 cells from 5 experiments; BDM n = 164 cells from 3 experiments; staurosporine with BDM n = 301 cells from 5 experiments). a For most neurons under control condition, no change in nuclear appearance was observable with no significant caspase activation (measured by the intensity of the NucView signal) and no chromatin compaction until the end of 6.5 h live cell experiment (blue). b In staurosporine-treated cultures, many nuclei presented either a strong caspase activation and a decrease in nuclear size (apoptosis in red) or nuclei did not present a decrease in nuclear size but presented an increase in CCP, thus classified as “granulated” (yellow). c Whereas, if staurosporine treatment was combined with the application of the caspase-3 inhibitor Z-DEVD-FMK, only few nuclei presented an increase in caspase activation, but more neurons showed a decrease in nuclear size and a high CCP and edge count at the end of the experiment and were thus classified as necrotic (gray). d Under BDM treatment, an increase in the relative proportion of neuronal nuclei that presented an increase in caspase activation, a decrease in nuclear size and a high CCP and edge count at the end of the experiment, thus classified as necrotic (gray), was observed. e If staurosporine treatment was combined with the application of BDM, the number of neuronal nuclei classified as necrotic (gray) increased, as well as the number of granulated nuclei.
Fig. 4
Fig. 4. Expression of the unconventional myosin IC in nuclei of primary cortical neurons decreases with the onset of apoptosis, and concomitant application of the actomyosin inhibitor BDM attenuates this decrease induced by staurosporine treatment.
a Representative confocal images of immunostainings against myosin IC, respective H2B::mCherry signals and merged images with horizontal z-stack projections confirm the expression of myosin IC in the nucleus of cortical neurons with a mostly complementary expression of myosin IC and H2B::mCherry under control conditions. In the early and late phase of apoptosis nuclear myosin IC signal decreased continuously (scales 10 µm). b Representative average z-stack projections of myosin IC signals under untreated control conditions, 2 h and 6 h after staurosporine application and upon additional treatment with the actomyosin inhibitor BDM (scale 20 µm). c Nuclear myosin IC signal intensity significantly decreased upon application of staurosporine for 2 h and 6 h (n = 33/48/33 cells). d, e The concomitant application of the actomyosin inhibitor BDM significantly attenuated the staurosporine-induced decrease in nuclear myosin IC intensity, both after 2 h (n = 48/19 cells) and after 6 h (n = 33/19 cells). Data are represented as boxplots, whiskers MIN to MAX. One-way ANOVA was applied for comparison of differences between control and staurosporine 2 h and 6 h F(2, 123) = 46.73, p < 0.0001 and t-test for comparison of nuclear myosin IC signal intensity upon application of staurosporine only with staurosporine plus BDM after 2 h (p < 0.0001) and 6 h (p < 0.05), respectively.
Fig. 5
Fig. 5. Classification of five progressive stages of apoptosis based on chromatin structure.
a Live confocal images (left, time-stamped images) followed by SMLM (images with typical details highlighted by white boxes) after fixation of the same nucleus from a cultured primary cortical neuron expressing H2B::mCherry; scale: 5 µm in both. Time stamps on the confocal images refer to time elapsed since the beginning of the acquisition. Note, in cells identified to be at stages 4 and 5, a transient caspase-3 activation (indicated by NucView*) was detectable during the confocal acquisition. Representative details highlighted in super resolution images (white boxes, scale 0.5 µm) show the compaction of chromatin increasing from stage 1 to stage 5. b Intensity plots of lines in representative detail views for stages 1, 2, and 4 show a stepwise increase in signal intensity, which indicates an increase in the compaction of chromatin clusters in neuronal nuclei. c Theoretical model describing chromatin appearance during the five identified stages of apoptosis based on the observed morphological changes presented by neuronal nuclei before and during the apoptotic process. dg Quantitative comparison of average nuclear size, edge count, H2B::mCherry and NucView signal intensities of neuronal nuclei categorized into stages 1–5 (n = 13/6/4/3/2 cells). Data are represented as mean ± SEM. One-way ANOVA was applied for comparison of nuclear size F(4, 23)=27.02 p < 0.0001 and edge count F(4, 23) = 4.11 p = 0.0118, Kruskal-Wallis test for comparison of H2B::mCherry signal intensity H(5) = 12.49, p = 0.0141, and caspase activation H(5) = 16.75, p = 0.002 across nuclei at different stages.
Fig. 6
Fig. 6. Voronoi analysis of H2B::mCherry signal localizations of super resolution data confirms a progressive compaction of chromatin before and during the apoptotic process.
a Schematic illustration of Voronoi tessellation used for calculation of Voronoi densities based on single molecule localizations. b Distribution of the log-normalized Voronoi densities representing the density of H2B::mCherry molecules within nuclei, grouped by apoptotic stage. To account for different number of localizations and cells for each stage, the area under the curve is normalized to 1 and the probability density function is plotted; a right-shift of the peak represents an increase in density of individual H2B::mCherry localizations, thus chromatin compaction. Stage 1: blue (n = 13 cells), stage 2: orange (n = 6 cells), stage 3: green (n = 4 cells), stage 4: red (n = 3 cells), stage 5: purple (n = 2 cells). b For the calculation of radius by density distribution, signal positions were transformed from a cartesian to a polar coordinate system for each nucleus. Respective radii from the center of mass of the nuclei were calculated for individual localizations (in nm) and related to the Voronoi density. The values of the normalized (area under curve = 1) probability density function are represented by colors (see color bar on the right).
Fig. 7
Fig. 7. Super resolution SMLM imaging of apoptotic and non-apoptotic neurons in mouse cortical cryosections confirms high chromatin compaction during apoptosis in vivo.
a Widefield imaging of aCasp3 immunosignal (left) allowed the identification of apoptotic and non-apoptotic neurons, and SMLM reconstruction of DNA molecules stained with Sytox Orange (right) are shown for four representative cells imaged in cortical tissue samples from a P6 mouse. Scale: 5 µm. b Representative detailed views on inserts highlighted in a revealed that compaction of chromatin into clusters is higher in nuclei of neurons with aCasp3 signal (red) as compared to nuclei without caspase 3 activation (blue). Scale 0.5 µm. c Intensity plots of representative lines from details in b confirmed the higher compaction of chromatin in nuclei of neurons with the aCasp3 signal. d Distribution of the log-normalized Voronoi densities of aCasp3-positive (red, n = 6 cells) and -negative neurons (blue, n = 7 cells). To account for different number of localizations and cells under each condition, the area under the curve is normalized to 1 and the probability density function is plotted.

References

    1. Fuchs Y, Steller H. Programmed cell death in animal development and disease. Cell. 2011;147:742–758. doi: 10.1016/j.cell.2011.10.033. - DOI - PMC - PubMed
    1. Oppenheim RW. Cell death during development of the nervous system. Annu. Rev. Neurosci. 1991;14:453–501. doi: 10.1146/annurev.ne.14.030191.002321. - DOI - PubMed
    1. Kerr JFR, Wyllie AH, Currie AR. Apoptosis: a basic biological phenomenon with wide-ranging implications in tissue kinetics. Br. J. Cancer. 1972;26:239–257. doi: 10.1038/bjc.1972.33. - DOI - PMC - PubMed
    1. Fink SL, Cookson BT. Apoptosis, pyroptosis, and necrosis: mechanistic description of dead and dying eukaryotic cells. Infect. Immun. 2005;73:1907–1916. doi: 10.1128/IAI.73.4.1907-1916.2005. - DOI - PMC - PubMed
    1. Zhang Y, Chen X, Gueydan C, Han J. Plasma membrane changes during programmed cell deaths. Cell Res. 2017;28:9–21. doi: 10.1038/cr.2017.133. - DOI - PMC - PubMed

Publication types