. 2022 Aug 8;7(1):47.
doi: 10.1038/s41525-022-00319-8.

Synaptosome microRNAs regulate synapse functions in Alzheimer's disease

Affiliations

Synaptosome microRNAs regulate synapse functions in Alzheimer's disease

Subodh Kumar et al. NPJ Genom Med. .

Abstract

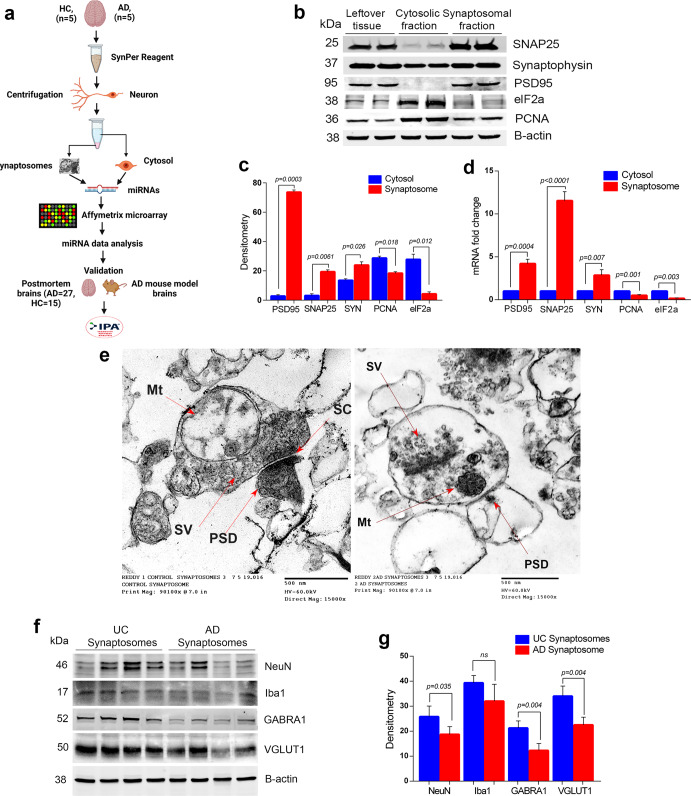
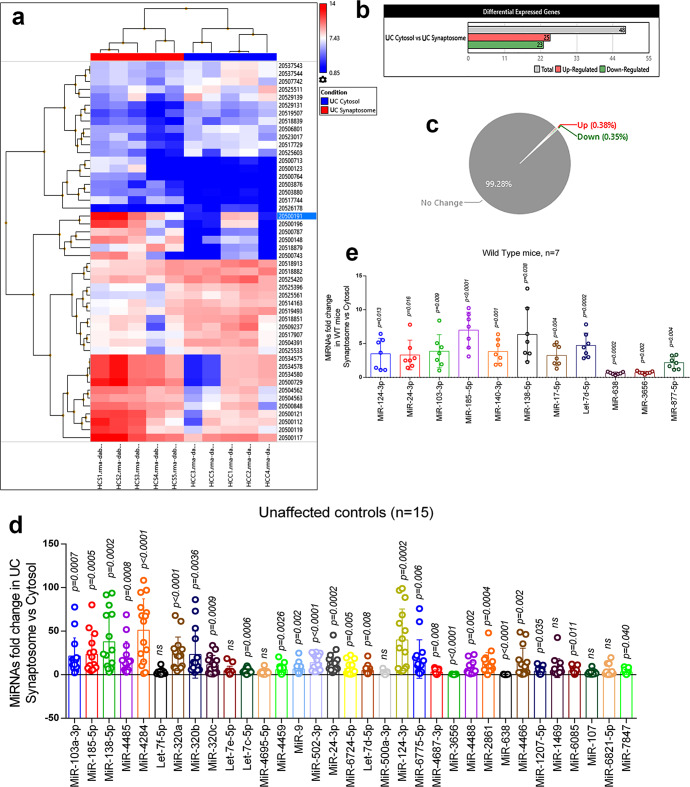
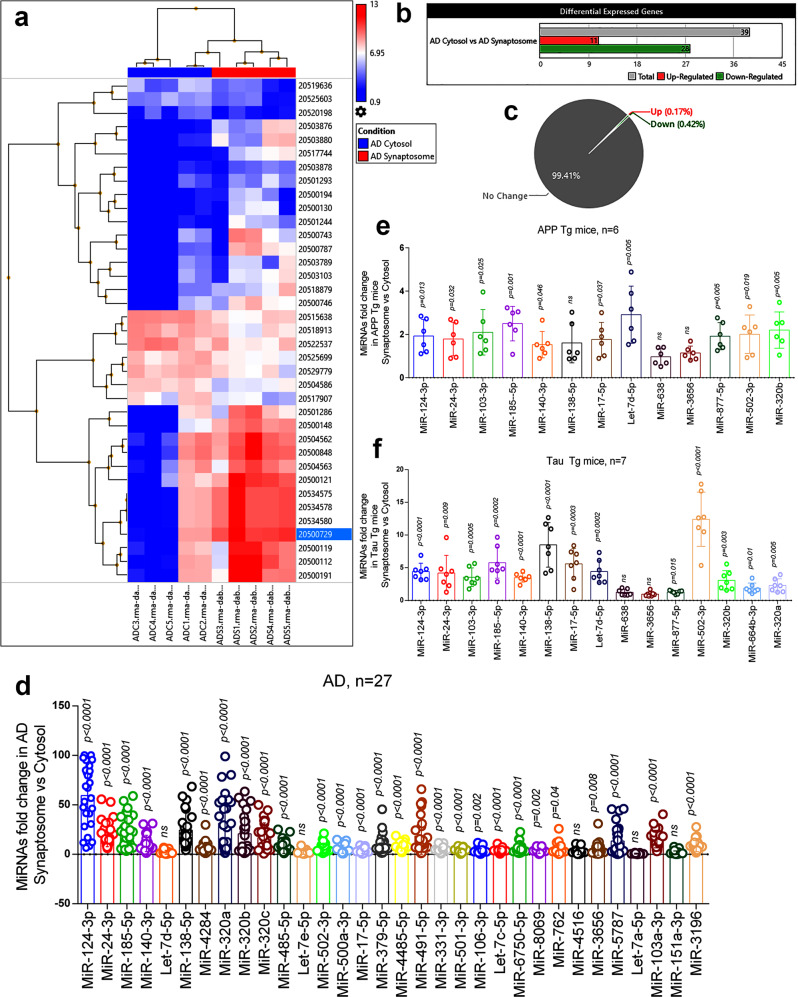
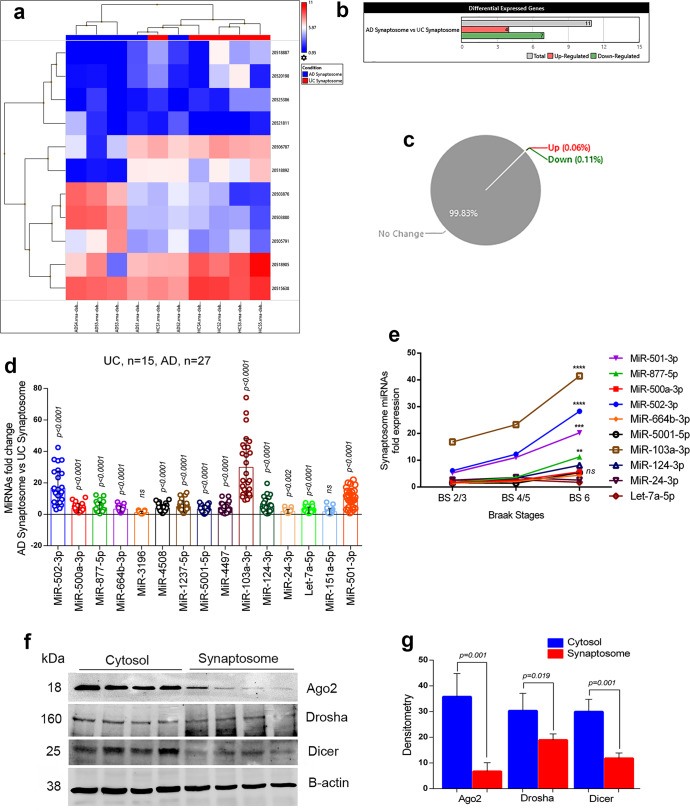
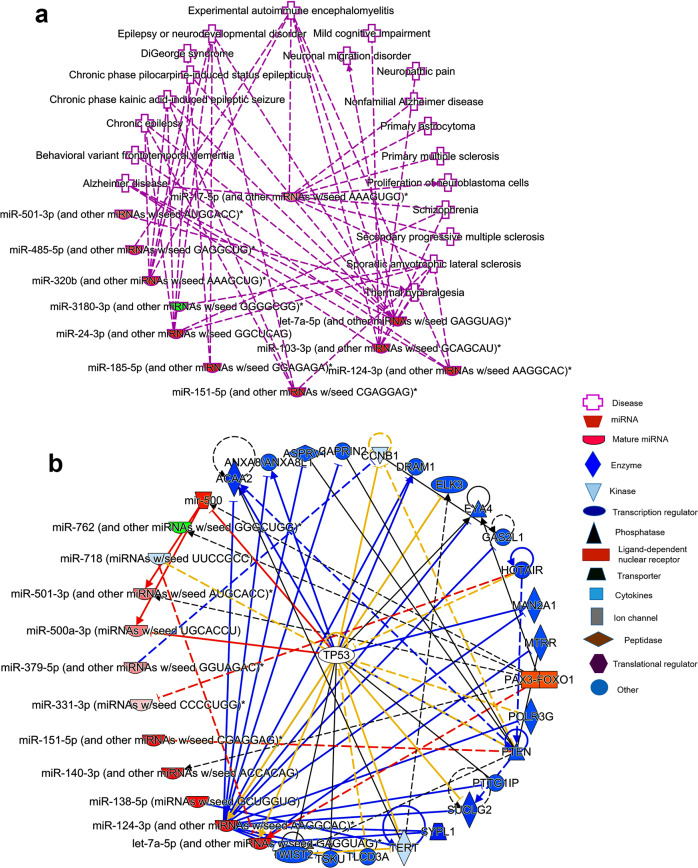
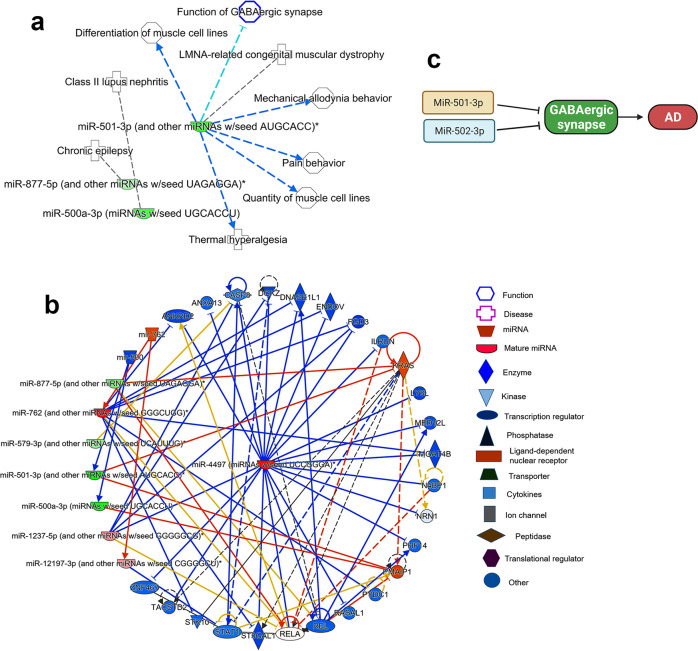
MicroRNAs (miRNAs) are found in nerve terminals, synaptic vesicles, and synaptosomes, but it is unclear whether synaptic and cytosolic miRNA populations differ in Alzheimer's disease (AD) or if synaptosomal miRNAs affect AD synapse activity. To address these questions, we generated synaptosomes and cytosolic fractions from postmortem brains of AD and unaffected control (UC) samples and analyzed them using a global Affymetrix miRNAs microarray platform. A group of miRNAs significantly differed (P < 0.0001) with high fold changes variance (+/- >200-fold) in their expressions in different comparisons: (1) UC synaptosome vs UC cytosol, (2) AD synaptosomes vs AD cytosol, (3) AD cytosol vs UC cytosol, and (4) AD synaptosomes vs UC synaptosomes. MiRNAs data analysis revealed that some potential miRNAs were consistently different across sample groups. These differentially expressed miRNAs were further validated using AD postmortem brains, brains of APP transgenic (Tg2576), Tau transgenic (P301L), and wild-type mice. The miR-501-3p, miR-502-3p, and miR-877-5p were identified as potential synaptosomal miRNAs upregulated with disease progression based on AD Braak stages. Gene Ontology Enrichment and Ingenuity Pathway Analysis of synaptosomal miRNAs showed the involvement of miRNAs in nervous system development, cell junction organization, synapse assembly formation, and function of GABAergic synapse. This is the first description of synaptic versus cytosolic miRNAs in AD and their significance in synapse function.


Conflict of interest statement

The authors would like to inform that the authors filed a patent on “Synaptosomal miRNAs and Synapse Functions in Alzheimer’s Disease” TTU Ref. No. 2022-016, U.S. Provisional Pat. App. No. 63/332,866 on April 20, 2022 related to the contents of this manuscript.

Figures

Fig. 1
Fig. 1. Extraction and characterization of synaptosomes.
a Brief workflow of the current study. b Immunoblotting analysis of synaptic (SNAP25, synaptophysin and PSD95) and cytosolic (elF1a and PCNA) proteins in cytosolic fraction, synaptosomal fraction and leftover tissue debris of unaffected control postmortem brain tissues. c Densitometry analysis of synaptic and cytosolic proteins. Synaptic proteins levels (PSD95; P = 0.003), (SNAP25; P = 0.0061), (Synaptophysin; P = 0.026) were significantly higher in synaptosomes and cytosolic proteins (elF1a; P = 0.012) and (PCNA; P = 0.018) levels were significantly lower in synaptosomes relative to cytosol. d qRT-PCR analysis for mRNA fold change analysis of synaptic and cytosolic genes in cytosolic and synaptosomal fractions (n = 5). e TEM analysis of synapse assembly in synaptosomal fraction from unaffected control and AD patients’ postmortem brains (scale bar 500 nm magnification). Electron micrograph shows synapse components: Mt mitochondria, SV synaptic vesicles, PSD postsynaptic density, SC synaptic cleft. f Immunoblotting analysis of brain cells markers (Neuron-NeuN; Microglia-Iba1), excitatory synapse marker (VGLUT1) and inhibitory synapse marker (GABARA1) proteins in unaffected controls (n = 4) and AD (n = 4) synaptosomes. g Densitometry analysis of NeuN, Iba1, VGLUT1, and GABARA1 proteins in unaffected controls and AD synaptosomes. All blots are driven from the same experiment and were proceed parallelly (b, f). Values in the bar diagrams are mean ± SEM and error bars are equivalent throughout the figure (c, d, g).
Fig. 2
Fig. 2. MiRNAs expression in synaptosome and cytosol in a healthy state.
a Hierarchical clustering and heatmap of significantly deregulated miRNAs in the synaptosome and cytosol of unaffected controls. (red color intensity showed the miRNAs upregulation and blue color intensity showed the miRNAs downregulation). b Total number of miRNAs deregulated in cytosol vs synaptosome in unaffected controls. (grayscale bar—total number of miRNAs; red scale bar—upregulated miRNAs; green scale bar—downregulated miRNAs). c Pi diagram showed the total miRNAs pool distribution and percentage of miRNAs population changed in cytosol and synaptosome in unaffected controls. d qRT-PCR-based validation analysis of significantly deregulated miRNAs in unaffected controls (n = 15). MiRNAs expression was quantified in terms of fold changes in unaffected controls synaptosomes compared to the cytosol. Each circle dot represents one sample. e Validation analysis of significantly deregulated mmu-miRNAs in WT mice (n = 7). MiRNAs expression was quantified in synaptosome relative to the cytosol. Each circle dot represents one animal. Values in the bar diagrams are mean ± SEM and error bars are equivalent throughout the figure (e, d).
Fig. 3
Fig. 3. MiRNAs expression in synaptosome and cytosol in AD.
a Hierarchical clustering and heatmap of significantly deregulated miRNAs in cytosol and synaptosome in AD samples. (red color intensity showed the miRNAs upregulation and blue color intensity showed the miRNAs downregulation) b Total numbers of miRNAs deregulated in cytosol and synaptosome in AD. (grayscale bar—total number of miRNAs; red scale bar—upregulated miRNAs; green scale bar—downregulated miRNAs). c Pi diagram showed the total miRNAs pool distribution and percentage of miRNA populations changed in cytosol and synaptosome. d qRT-PCR-based validation analysis of significantly deregulated miRNAs in AD samples (n = 27). MiRNAs expression was quantified in terms of fold changes in AD synaptosome compared to AD cytosol. Each circle dot represents one sample. e Validation analysis of significantly deregulated mmu-miRNAs in APP-Tg (n = 6) mice. MiRNAs expression was quantified in synaptosome relative to the cytosol. Each circle dot represents one animal. f Validation analysis of significantly deregulated mmu-miRNAs in Tau-Tg (n = 7) mice. MiRNAs expression was quantified in synaptosome relative to the cytosol. Values in the bar diagrams are mean ± SEM and error bars are equivalent throughout the figure (df).
Fig. 4
Fig. 4. MiRNAs expression in synaptosome in AD and healthy state.
a Hierarchical clustering and heatmap of significantly deregulated miRNAs in synaptosome in AD and unaffected controls. (red color intensity showed the miRNAs upregulation and blue color intensity showed the miRNAs downregulation) b Total numbers of miRNAs deregulated in AD synaptosome vs UC synaptosome. (grayscale bar—total number of miRNAs; red scale bar—upregulated miRNAs; green scale bar—downregulated miRNAs). c Pi diagram showed the total miRNAs pool distribution and percentage of miRNAs population changed in AD synaptosome vs UC synaptosome. d qRT-PCR-based validation analysis of significantly deregulated miRNAs in AD (n = 27) and UC (n = 15) synaptosome. MiRNAs expression was quantified in terms of fold changes in AD synaptosome relative to UC synaptosome. Each circle dot represents one sample. e Multiple comparison analysis of synaptosomal miRNAs fold changes with Braak stages 2/3, Braak stages 4/5 and Braak stages 6 of AD samples. (**P < 0.01, ***P < 0.001, ****P < 0.0001). f Immunoblotting analysis of miRNAs biogenesis proteins (Ago2, Drosha, and Dicer) in the cytosol and synaptosomal of UC samples (n = 4). g Densitometry analysis of Ago2, Drosha and Dicer in cytosol relative to synaptosomes of UC samples. All blots are driven from the same experiment and were proceeded parallelly (f). Values in the bar diagrams are mean ± SEM and error bars are equivalent throughout the figure (d, g).
Fig. 5
Fig. 5. Ingenuity pathway analysis of cytosolic and synaptosomal miRNAs in AD.
a In AD state, cytosolic and synaptosomal miRNAs expression network in various human diseases. Red nodes represent increased expression and green nodes represent a decreased expression of miRNAs. b MiRNAs target and seed sequences network of cytosolic and synaptosomal miRNAs in the AD state.
Fig. 6
Fig. 6. Ingenuity pathway analysis of synaptosomal miRNAs in AD.
a Synaptosomal miRNAs expression network in various human diseases. b MiRNAs target and seed sequences network of synaptosomal miRNAs in the AD and healthy state. Red nodes represent increased expression and green nodes represent a decreased expression of miRNAs. c Possible molecular mechanism of miR-501-3 and miR-502-3p in AD progression via negative modulation of GABAergic synapse. Inhibition of GABARA1 expression by the overexpression of these miRNAs could inhibits the GABAergic synapse function in AD.

References

    1. Alzheimer’s disease facts and figures. Alzheimers Dement. 17, 327–406 (2021). - PubMed
    1. Forner S, Baglietto-Vargas D, Martini AC, Trujillo-Estrada L, LaFerla FM. Synaptic impairment in Alzheimer’s disease: a dysregulated symphony. Trends Neurosci. 2017;40:347–357. doi: 10.1016/j.tins.2017.04.002. - DOI - PubMed
    1. Marsh J, Alifragis P. Synaptic dysfunction in Alzheimer’s disease: the effects of amyloid beta on synaptic vesicle dynamics as a novel target for therapeutic intervention. Neural Regen. Res. 2018;13:616–623. doi: 10.4103/1673-5374.230276. - DOI - PMC - PubMed
    1. Kashyap G, et al. Synapse loss and progress of Alzheimer’s disease—a network model. Sci. Rep. 2019;9:6555. doi: 10.1038/s41598-019-43076-y. - DOI - PMC - PubMed
    1. Selkoe DJ. Alzheimer’s disease is a synaptic failure. Science. 2002;298:789–791. doi: 10.1126/science.1074069. - DOI - PubMed