. 2022 Oct;3(10):1260-1270.
doi: 10.1038/s43018-022-00415-9. Epub 2022 Aug 8.

cfDNA methylome profiling for detection and subtyping of small cell lung cancers

Affiliations

cfDNA methylome profiling for detection and subtyping of small cell lung cancers

Francesca Chemi et al. Nat Cancer. 2022 Oct.

Abstract

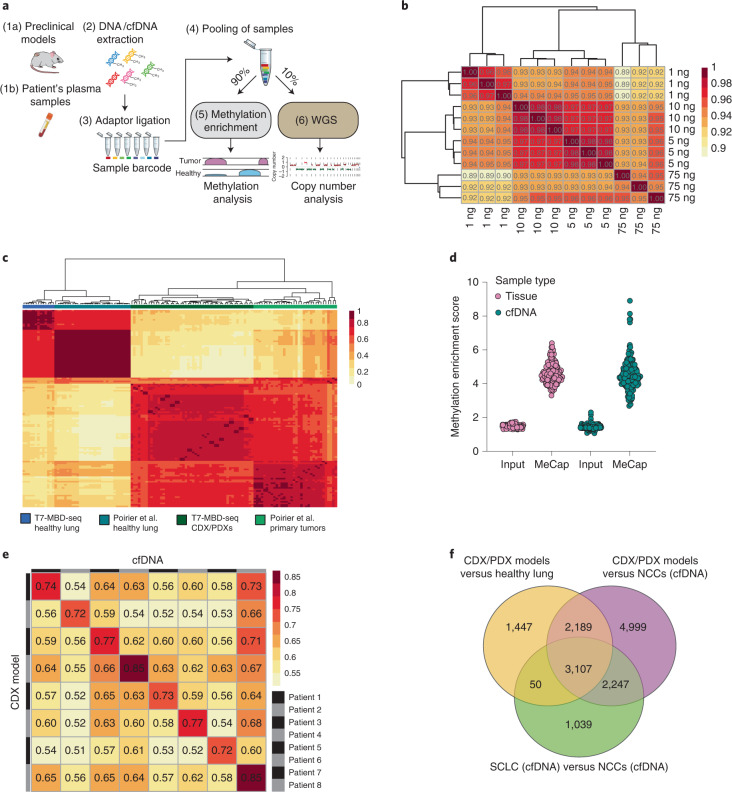
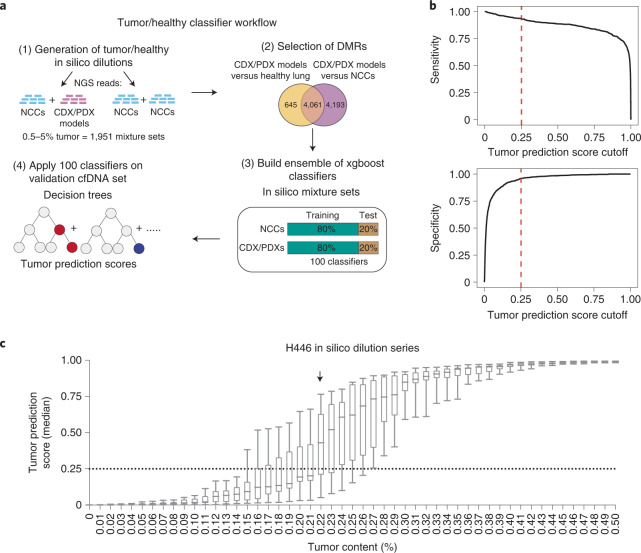
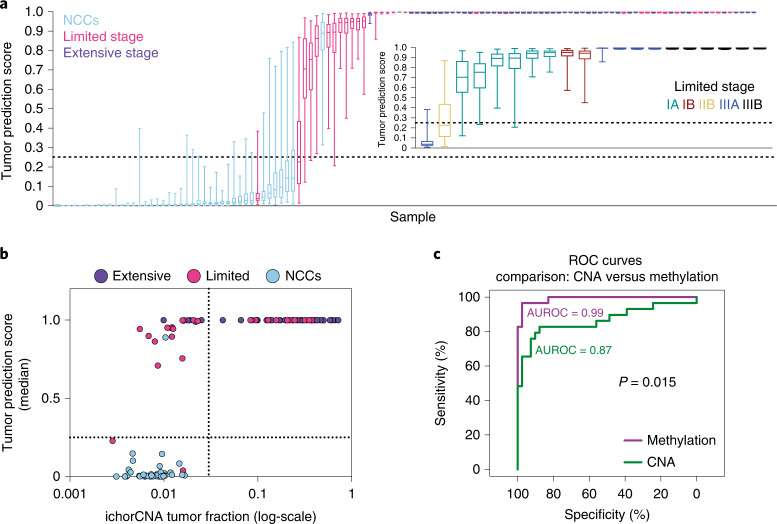
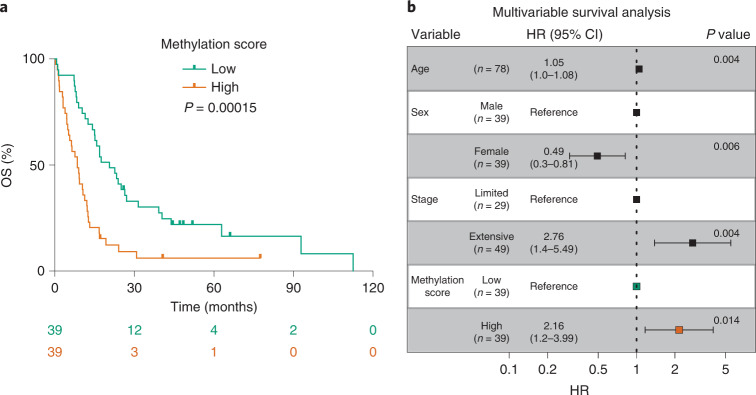
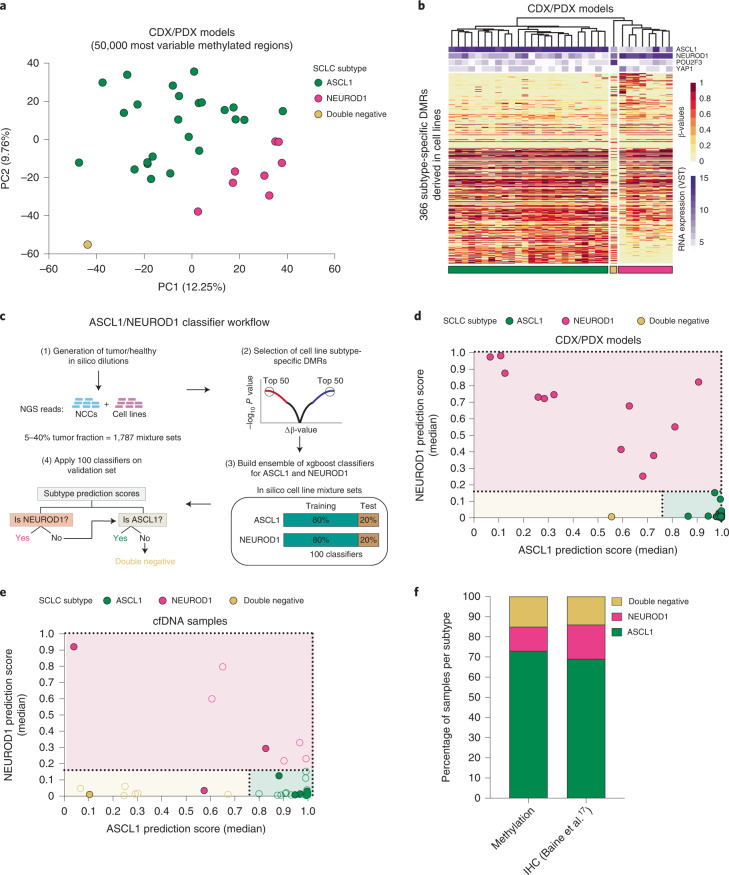
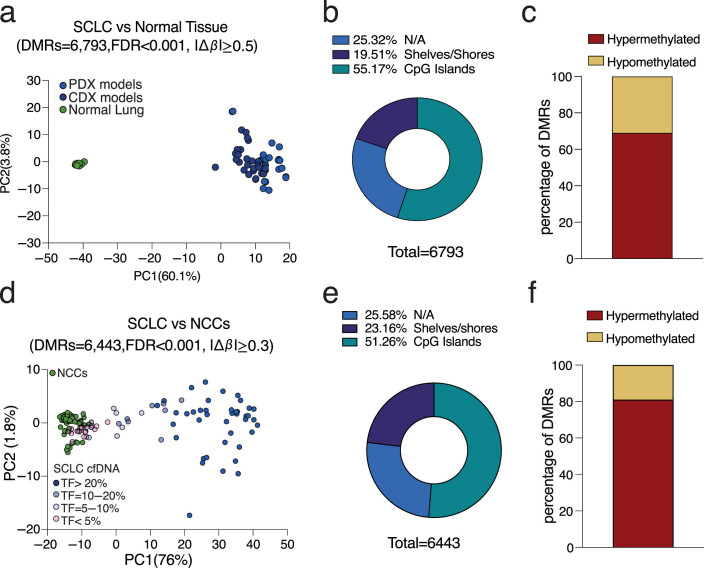
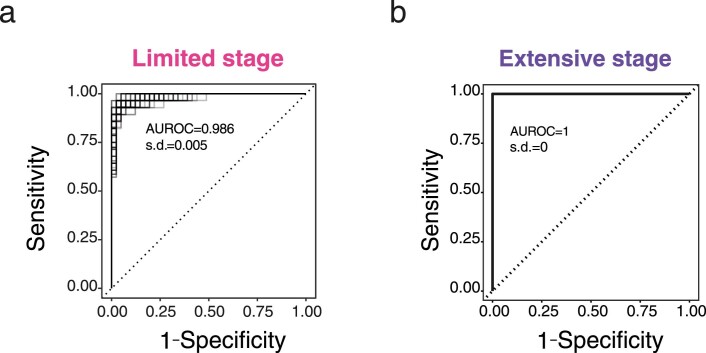
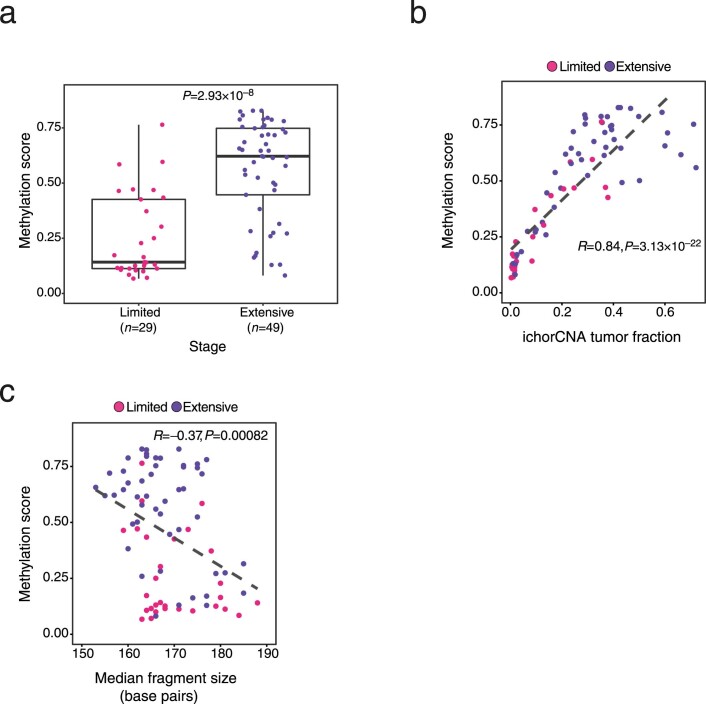
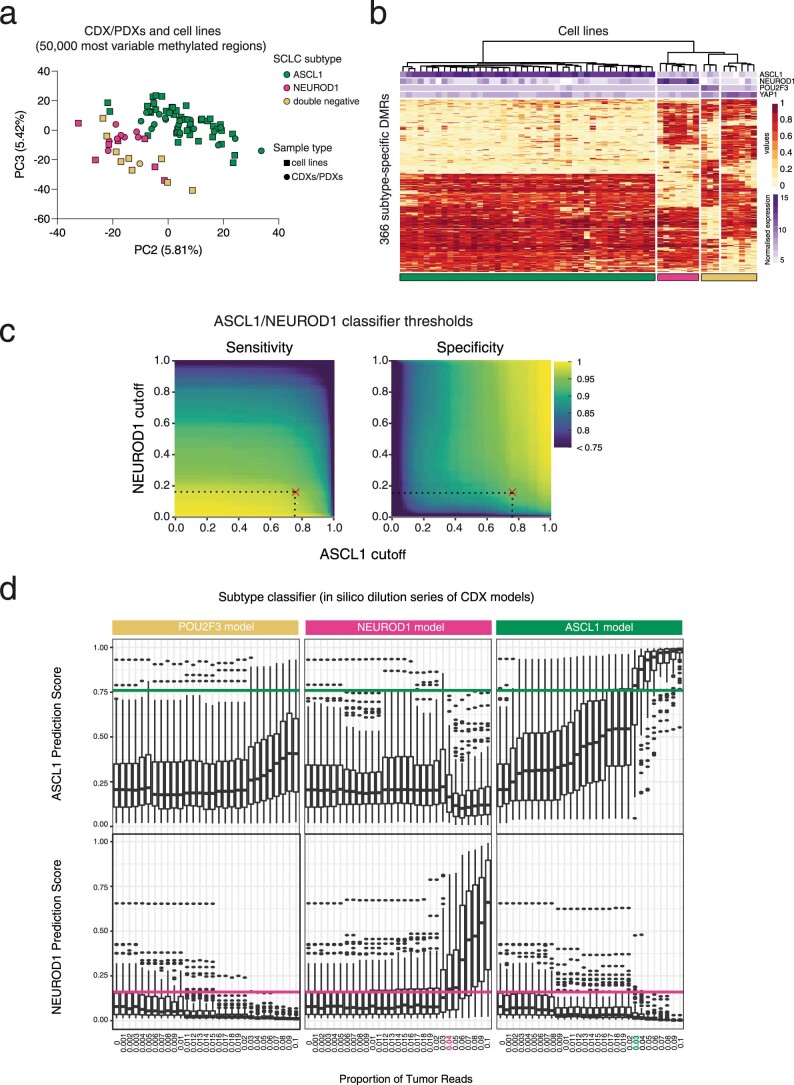
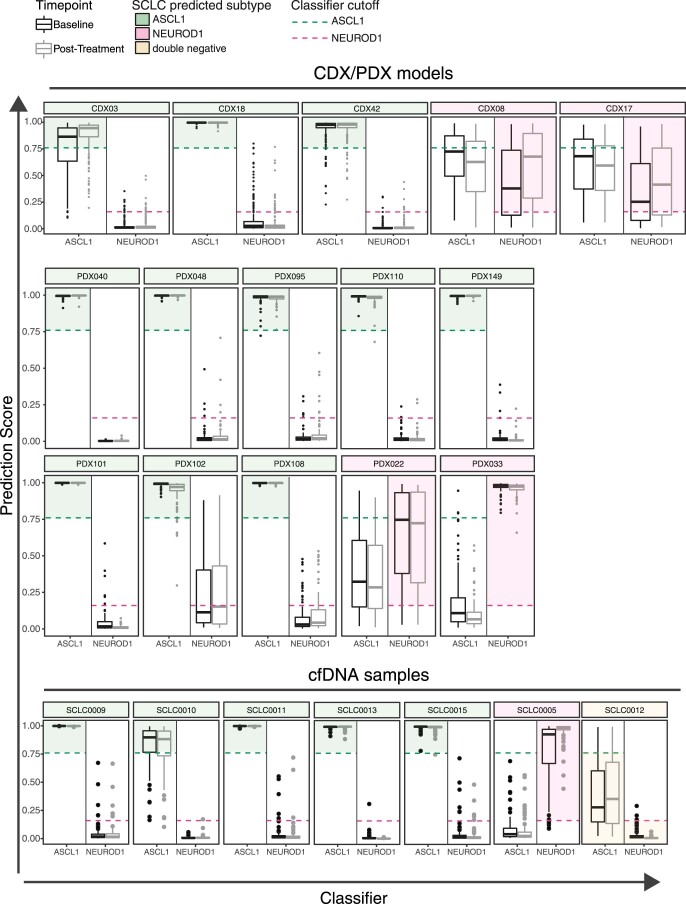
Small cell lung cancer (SCLC) is characterized by morphologic, epigenetic and transcriptomic heterogeneity. Subtypes based upon predominant transcription factor expression have been defined that, in mouse models and cell lines, exhibit potential differential therapeutic vulnerabilities, with epigenetically distinct SCLC subtypes also described. The clinical relevance of these subtypes is unclear, due in part to challenges in obtaining tumor biopsies for reliable profiling. Here we describe a robust workflow for genome-wide DNA methylation profiling applied to both patient-derived models and to patients' circulating cell-free DNA (cfDNA). Tumor-specific methylation patterns were readily detected in cfDNA samples from patients with SCLC and were correlated with survival outcomes. cfDNA methylation also discriminated between the transcription factor SCLC subtypes, a precedent for a liquid biopsy cfDNA-methylation approach to molecularly subtype SCLC. Our data reveal the potential clinical utility of cfDNA methylation profiling as a universally applicable liquid biopsy approach for the sensitive detection, monitoring and molecular subtyping of patients with SCLC.


Conflict of interest statement

C.M.R. has consulted regarding oncology drug development with AbbVie, Amgen, Astra Zeneca, Epizyme, Genentech/Roche, Ipsen, Jazz, Lilly and Syros and serves on the scientific advisory boards of Bridge Medicines, Earli and Harpoon Therapeutics. C.D. receives research grants/support from AstraZeneca, Astex Pharmaceuticals, Bioven, Amgen, Carrick Therapeutics, Merck AG, Taiho Oncology, GSK, Bayer, Boehringer Ingelheim, Roche, BMS, Novartis, Celgene, Epigene Therapeutics, Angle, Menarini, Clearbridge Biomedics, Thermo Fisher Scientific and Neomed Therapeutics. C.D. has received honoraria/consultancy fees from Biocartis, Merck, AstraZeneca and GRAIL. The remaining authors declare no competing interests.

Figures

Fig. 1
Fig. 1. A workflow for accurate detection of SCLC methylation patterns in CDX/PDX models and cfDNA samples.
a, T7-MBD-seq workflow. Fragmented genomic DNA or cfDNA were subjected to barcoding and pooling followed by incubation with a methyl-binding domain 2 protein (MBD2). A tenth of the pooled sample was kept as input control. NGS libraries were generated for both methylated enriched and input fractions with the aim of obtaining methylation and copy number profiles from the same original barcoded and pooled sample. Blood tube image was obtained from BioRender.com. WGS, whole-genome sequencing. b, Hierarchical clustering heat map showing Pearson correlation between the normalized reads per million values across the whole genome (8,956,617 300-bp windows), for varying starting amounts of DNA (in triplicate) of the lung cancer cell line H1975. c, Hierarchical clustering heat map of Spearman correlation of differentially methylated CpG probes (20,578 CpG probes corresponding to 14,887 300-bp windows) previously detected between healthy lung tissue (n = 31 individuals) and primary SCLC tumors (n = 34 patients) mapped to our SCLC dataset (n = 50 CDX and PDX models from 33 patients, β-values were averaged over up to three independent mice for each model) and to healthy lung samples (n = 13 individuals) processed through T7-MBD-seq protocol. d, Dot plot showing methylation enrichment scores of input control samples and methylation captured samples (MeCap) for both tissue samples (n = 110) and cfDNA samples (n = 157). e, Spearman correlation between methylation profiles for CDX models and cfDNA samples from the same patients (using 76,225 300-bp regions with nrpm < 1 in NCCs, but ≥1 in a CDX/PDX sample). f, Venn diagram showing the overlap of most significant DMRs for three different comparisons: CDX/PDXs (n = 50 models, as in c) versus healthy lung (n = 13 individuals) (DMRs = 6,793, |Δβ| ≥ 0.5, false discovery rate (FDR) ≤ 0.001), CDX/PDXs (n = 50 models) versus NCCs (n = 79 individuals) (DMRs = 12,542, |Δβ| ≥ 0.5, FDR ≤ 0.001) and SCLC cfDNA (n = 78 patients) versus NCCs (n = 79 individuals) (DMRs = 6,443, |Δβ| ≥ 0.3, FDR ≤ 0.001). Source data
Fig. 2
Fig. 2. Generation of a DNA methylation classifier for sensitive tumor detection.
a, Analysis workflow for the generation of the tumor/healthy classifier. b, Sensitivity and specificity metrics plotted against cutoff values for the median tumor prediction score output by the tumor/healthy classifier applied to held-out synthetic mixture sets (total of n = 1,951 mixture sets). Dotted lines indicate the cutoff value (0.25) that optimizes the balanced accuracy metric (average of sensitivity and specificity). c, Box plots of median tumor prediction scores from applying the tumor/healthy classifier to in silico serial dilutions of a fragmented SCLC cell line (H446) mixed with an NCC cfDNA sample, with varying proportions of the cell line in the mixture (x axis). For each proportion, 11 independent in silico dilution experiments were carried out. Boxes mark the 25th percentile (bottom), median (central bar) and 75th percentile (top); whiskers extend to minimum and maximum points. Dotted line indicates the cutoff for the tumor/healthy classifier derived as above. Arrow indicates the lowest dilution of H466 with a median value (across the 11 in silico experiments) above this cutoff (0.22% tumor content). Source data
Fig. 3
Fig. 3. Methylation tumor prediction score applied to SCLC cfDNA samples.
a, Box plots of classifier tumor prediction scores for 78 held-out SCLC cfDNA samples (29 limited stage and 49 extensive stage) and 41 held-out NCC cfDNA samples from applying the 100 classifiers trained on CDX/PDX synthetic spike-in samples. Boxes mark the 25th percentile (bottom), median (central bar) and 75th percentile (top); whiskers extend to minimum and maximum points. Dotted lines indicate the tumor prediction score cutoff value of 0.25. Inset plot shows tumor prediction scores for 20 out of 29 limited stage patients who had detailed staging information available. b, Scatter-plot showing median classifier tumor prediction scores against ichorCNA tumor fraction values (on a log scale) for the 78 SCLC and 41 NCC cfDNA samples. The classifier tumor prediction scores are correlated with ichorCNA tumor fraction (Spearman’s ρ = 0.72). Dotted lines are indicating the cutoff for both measures. c, ROC curves and AUROC scores generated by using ichorCNA tumor fraction (CNA, green line) or median classifier tumor prediction score (methylation, purple line) to classify LS-SCLC (n = 29) and NCC cfDNA (n = 41) samples. P value is from a comparison of the AUROC scores using a two-sided DeLong’s test. Source data
Fig. 4
Fig. 4. Methylation score predicts survival in patients with SCLC.
a, Kaplan–Meier curves showing OS of the 78 patients with SCLC stratified by high and low methylation score (derived from cfDNA samples and calculated as the average β-value across 4,061 genomic regions used by the tumor/healthy classifier, then dichotomized using the median value). The number of patients at risk for each time point is indicated below the time point and color coded according to high or low groups. P value obtained by comparing the groups using a two-sided log-rank test. b, Forest plot showing the results of multivariable Cox proportional hazards regression modeling of OS for patients with methylation score high or low status. Error bars indicate 95% CI for the HR. P values were calculated using a two-sided Wald test. Source data
Fig. 5
Fig. 5. DNA methylation profiling identifies SCLC subtypes in both preclinical models and cfDNA samples.
a, PCA plot of 33 CDX/PDX models (not including second models derived from the same patient), using β-values for the 50,000 most variable methylated regions across these models. CDX and PDX models segregated according to the expression of ASCL1, NEUROD1 (single or coexpressing with ASCL1) and POU2F3 (double negative) b, Hierarchical clustering heat map of β-values for 33 CDX/PDX models using 366 subtype-specific DMRs derived from publicly available DNA methylation data for 59 cell lines. Bars on the top show the expression values (variance-stabilizing transformation; VST) of ASCL1, NEUROD1, POU2F3 and YAP1 derived from RNA-seq data for each model. c, Analysis workflow for the generation of ASCL1 and NEUROD1 classifiers. d,e, ASCL1 and NEUROD1 classifier median prediction scores for 33 CDX/PDX models (d) and 56 cfDNA samples with an estimated tumor fraction of at least 4% (e). Color fill of dots indicates known subtype. In e, only cfDNA samples from patients who also generated a CDX model (n = 11) have known subtype. Dotted lines indicate classifier cutoff values. f, Bar plots of subtype distribution detected by cfDNA methylation (n = 56 patients) compared to subtype distribution detected by immunohistochemistry (IHC) of SCLC tissue samples (n = 159) from a previous study. In a,b,d data for each CDX model are averaged over tumors from up to three independent mice. Source data
Extended Data Fig. 1
Extended Data Fig. 1. SCLC methylation patterns in preclinical models and cfDNA samples.
a, PCA plot of CDX/PDX models (n = 50 models from 33 patients, β-values were averaged over up to three independent mice for each model) and normal lung tissue samples (n = 13 individuals), from PCA applied to β-values for the 6,793 most significant DMRs detected between CDX/PDX and normal lung. b, Distribution of the 6,793 DMRs over regulatory regions (CpG Islands, shores and shelves) in CDX/PDX vs normal lung comparison. c, Bar plot showing the percentage of the 6,793 DMRs detected as hypermethylated and hypomethylated in CDX/PDX vs normal lung comparison. d, PCA plot of SCLC cfDNA (n = 78 patients) and NCC cfDNA (n = 79 individuals), from PCA applied to β-values for the 6,443 most significant DMRs detected between SCLC cfDNA and NCC cfDNA. e, Distribution of the 6,443 DMRs over regulatory regions (CpG Islands, shores and shelves) in SCLC cfDNA versus NCC cfDNA comparison. f, Bar plot showing the percentage of the 6,443 DMRs detected as hypermethylated and hypomethylated in SCLC cfDNA versus NCC cfDNA comparison. Source data
Extended Data Fig. 2
Extended Data Fig. 2. Sensitivity and specificity of the tumor/normal classifier.
a,b, ROC curves from applying the 100 individual tumor/normal classifiers to 29 limited stage SCLC cfDNA samples and 41 NCC cfDNA samples (a), and to 49 extensive stage SCLC cfDNA samples and 41 NCC cfDNA samples (b). Source data
Extended Data Fig. 3
Extended Data Fig. 3. The methylation score as a surrogate of tumor burden.
a, Box plot showing the methylation score (calculated as the average β-value across the 4,061 genomic regions used by the tumor/normal classifier) for cfDNA samples from limited or extensive stage patients. Boxes mark the 25th percentile (bottom), median (central bar) and 75th percentile (top). Whiskers extend to the most extreme value within 1.5-fold of interquartile range. Individual data points also shown. P value calculated by two-sided Mann-Whitney U test. b,c Scatter plots between the methylation score (as in a) and the copy-number estimated tumor fraction from ichorCNA (b), and median DNA fragment size (across the whole genome) from paired-end sequencing reads (c). Pearson correlation (R value) and two-sided P value are indicated. Black, dashed line shows linear regression fit. ac, n = 78 cfDNA samples from independent SCLC patients (n = 29 limited stage and n = 49 extensive stage). Source data
Extended Data Fig. 4
Extended Data Fig. 4. Identification of SCLC subtype-specific DMRs.
a, PCA plot showing the 59 SCLC cell lines (43 ASCL1, 7 NEUROD1, 9 dual negative) and 33 CDX/PDX models (24 ASCL1, 8 NEUROD1, 1 dual negative; second models derived from the same patient were excluded), from PCA applied to β-values for the 50,000 most variable methylated regions according to the cell lines. β-values for each CDX model were averaged over up to three independent mice. b, Hierarchical clustering heatmap showing 366 subtype-specific DMRs derived by publicly available DNA methylation data from 59 cell lines. Bars on the top show the normalized expression values of ASCL1, NEUROD1, POU2F3 and YAP1 derived from Affymetrix Exon Microarrays for each cell line. c, Heatmaps showing sensitivity and specificity for varying cutoff values applied to the median prediction scores output by applying the ASCL1 and NEUROD1 classifiers to mixture sets in held-out test data (total of n = 1,787 mixture sets). Red crosses indicate the cutoffs (0.16 for NEUROD1; 0.76 for ASCL1) that jointly optimize the balanced accuracy metric (average of sensitivity and specificity) across both classifiers. d, Box plots of classifier prediction scores for n = 100 individual ASCL1 classifiers (top) or n = 100 individual NEUROD1 classifiers (bottom), applied to in silico serial dilutions of a POU2F3 (left), NEUROD1 (middle) or ASCL1 (right) CDX model mixed with an NCC cfDNA sample, with varying proportions of the CDX model in the mixture (x-axis). Boxes mark the 25th percentile (bottom), median (central bar) and 75th percentile (top). Whiskers extend to the most extreme value within 1.5-fold of interquartile range. Points lying outside the whiskers are plotted individually. Horizontal lines show the cutoffs for ASCL1 and NEUROD1 classifiers derived above. Source data
Extended Data Fig. 5
Extended Data Fig. 5. Prediction of SCLC subtype in post-treatment samples.
Box plots showing prediction scores from n = 100 individual ASCL1 and NEUROD1 classifiers for a panel of paired CDX and PDX models, and paired cfDNA samples. CDX models were derived longitudinally from patients at baseline and post-treatment while paired PDX models were generated in vivo (as described in ref. ). cfDNA samples were isolated from patients at baseline and again at post-treatment. Horizontal dotted lines show the median cutoffs for ASCL1 and NEUROD1 classifiers, 0.76 and 0.16 respectively. Colored regions indicate the predicted SCLC subtype. Boxes mark the 25th percentile (bottom), median (central bar) and 75th percentile (top). Whiskers extend to the most extreme value within 1.5-fold of interquartile range. Points lying outside the whiskers are plotted individually. Data for CDX models are averaged over tumors from up to three independent mice. Source data

References

    1. Rudin CM, Brambilla E, Faivre-Finn C, Sage J. Small-cell lung cancer. Nat. Rev. 2021;7:3. - PMC - PubMed
    1. Dingemans AC, et al. Small-cell lung cancer: ESMO Clinical Practice Guidelines for diagnosis, treatment and follow-up. Ann. Oncol. 2021;32:839–853. - PMC - PubMed
    1. Horn L, et al. First-line atezolizumab plus chemotherapy in extensive-stage small-cell lung cancer. N. Engl. J. Med. 2018;379:2220–2229. - PubMed
    1. Gazdar AF, Carney DN, Nau MM, Minna JD. Characterization of variant subclasses of cell lines derived from small cell lung cancer having distinctive biochemical, morphological, and growth properties. Cancer Res. 1985;45:2924–2930. - PubMed
    1. Rudin CM, et al. Molecular subtypes of small cell lung cancer: a synthesis of human and mouse model data. Nat. Rev. Cancer. 2019;19:289–297. - PMC - PubMed

Publication types

Substances