Clinical Trial
. 2022 Oct;28(10):2183-2193.
doi: 10.1038/s41591-022-01919-8. Epub 2022 Aug 8.

Pepinemab antibody blockade of SEMA4D in early Huntington's disease: a randomized, placebo-controlled, phase 2 trial

Collaborators, Affiliations
Clinical Trial

Pepinemab antibody blockade of SEMA4D in early Huntington's disease: a randomized, placebo-controlled, phase 2 trial

Andrew Feigin et al. Nat Med. 2022 Oct.

Erratum in

Abstract

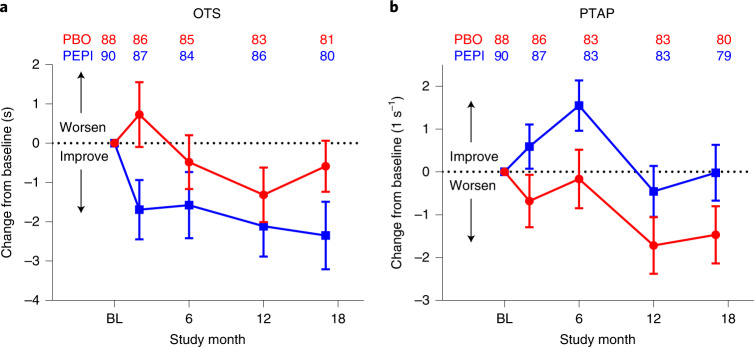
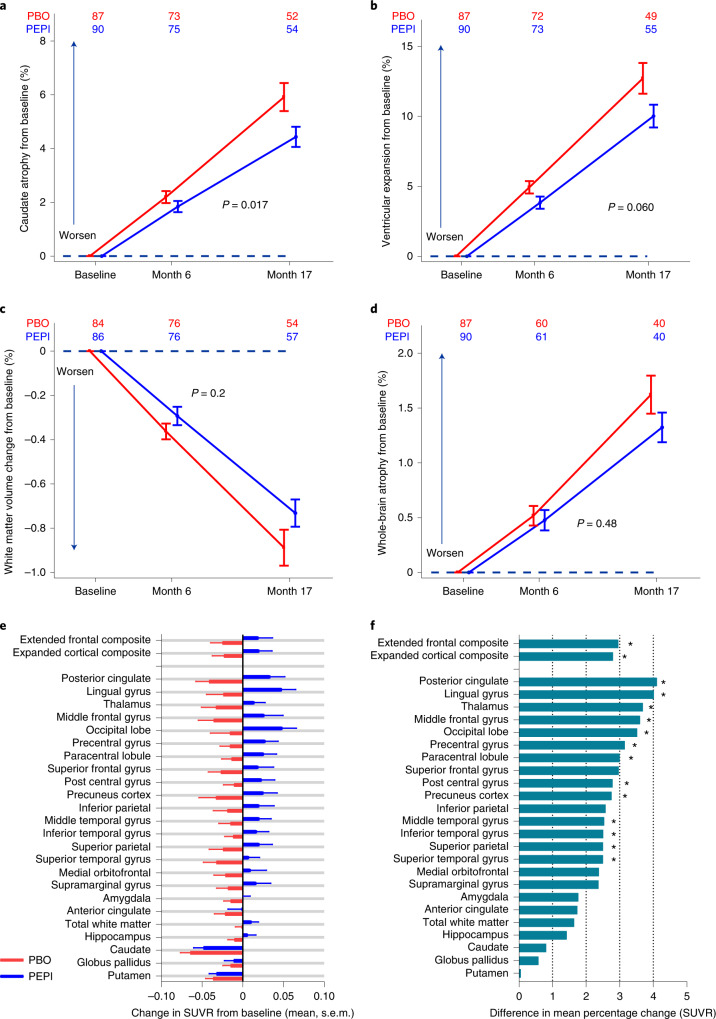
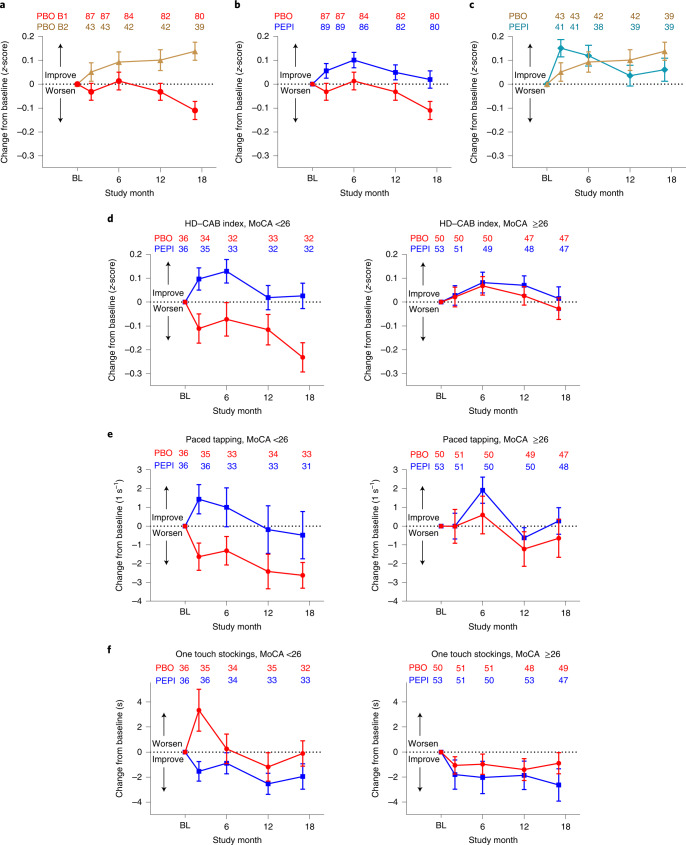
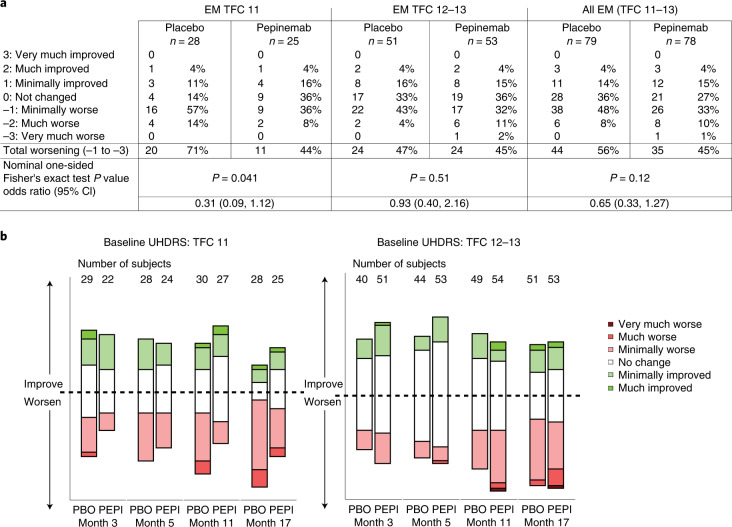
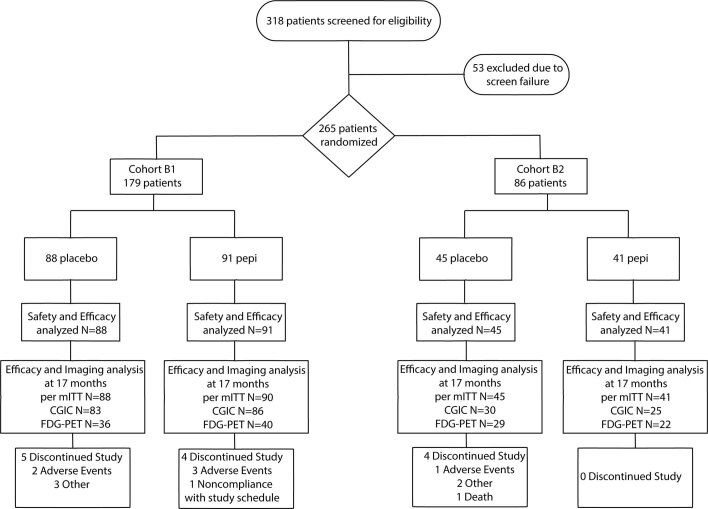
SIGNAL is a multicenter, randomized, double-blind, placebo-controlled phase 2 study (no. NCT02481674) established to evaluate pepinemab, a semaphorin 4D (SEMA4D)-blocking antibody, for treatment of Huntington's disease (HD). The trial enrolled a total of 265 HD gene expansion carriers with either early manifest (EM, n = 179) or late prodromal (LP, n = 86) HD, randomized (1:1) to receive 18 monthly infusions of pepinemab (n = 91 EM, 41 LP) or placebo (n = 88 EM, 45 LP). Pepinemab was generally well tolerated, with a relatively low frequency of serious treatment-emergent adverse events of 5% with pepinemab compared to 9% with placebo, including both EM and LP participants. Coprimary efficacy outcome measures consisted of assessments within the EM cohort of (1) a two-item HD cognitive assessment family comprising one-touch stockings of Cambridge (OTS) and paced tapping (PTAP) and (2) clinical global impression of change (CGIC). The differences between pepinemab and placebo in mean change (95% confidence interval) from baseline at month 17 for OTS were -1.98 (-4.00, 0.05) (one-sided P = 0.028), and for PTAP 1.43 (-0.37, 3.23) (one-sided P = 0.06). Similarly, because a significant treatment effect was not observed for CGIC, the coprimary endpoint, the study did not meet its prespecified primary outcomes. Nevertheless, a number of other positive outcomes and post hoc subgroup analyses-including additional cognitive measures and volumetric magnetic resonance imaging and fluorodeoxyglucose-positron-emission tomography imaging assessments-provide rationale and direction for the design of a phase 3 study and encourage the continued development of pepinemab in patients diagnosed with EM HD.


Conflict of interest statement

Vaccinex employment and stock: E.E.E., T.L.F., J.E.L., E.S., V.M. and M.Z. Vaccinex patents and applications related to SEMA4D (USPTO nos. 8,816,058, 9,090,709, 10,800,853 and 7,919,594): E.E.E., T.L.F., E.S. and M.Z. IXICO employment and stock: R.M. Research grant support from HSG, Neurocrine, Uniqure and Vaccinex: P.D. Payments to Clintrex Research Corporation for provision of research services during the conduct of the trial: K.D.K. Research funding from Vaccinex, CHDI, HDSA, Roche/Genentech, UniQure, HSG/NBI and Cures within Reach, consulting role for Teva and on Speaker’s Bureau of Sunovion Pharmaceuticals: E.F.S. Consultation fees from Amylyz, Novartis, Sage, Teva and Uniqure, grant funding from uniQure, Roche/Genentech, Triplet Therapeutics and CHDI and salary support from HSG for serving as chair of DSMB of a study funded by Neurocrine and the virtual UHDRS study: S. Frank. The remaining authors declare no competing interests.

Figures

Fig. 1
Fig. 1. Effects of pepinemab treatment on primary cognitive assessments in EM cohort B1.
a,b, Observed mean changes from baseline (BL) by treatment group over time for the mITT sample of EM cohort B1. a, OTS measures time to a correct response (averaged over all trials per visit). b, PTAP measures tapping consistency as the reciprocal of the average standard deviation of inter-tap interval durations following cessation of aural cues (over all trials per visit). a,b, Error bars show one standard error on either side of the mean, with sample sizes at each time point for each group listed above the profile lines.
Fig. 2
Fig. 2. Pepinemab delays brain atrophy and restores loss of metabolic activity in EM subjects.
ad, Mean percentage changes from baseline by treatment group over time for the mITT sample of EM cohort B1 (PEPI, n = 90: PBO, n = 88) in vMRI measurement. a, Caudate BSI (atrophy); b, ventricular BSI (expansion); c, white matter (preservation); d, whole-brain BSI (atrophy). e, FDG–PET SUVR change from baseline to month 17 for each treatment group (mean and 1 s.d.) in each brain ROI for EM cohort B1. f. Treatment effect at month 17 calculated as difference between pepinemab (n = 40) and placebo groups (n = 36) as mean percentage change in SUVR. *P ≤ 0.05; exact two-sided P values for 15 brain regions (listed from top to bottom) are: extended frontal composite, 0.031; expanded cortical composite, 0.028; posterior cingulate, 0.008; lingual gyrus, 0.014; thalamus, 0.011; middle frontal gyrus, 0.033; occipital lobe, 0.029; precentral gyrus, 0.010, paracentral lobule, 0.014; post central gyrus, 0.028; precuneus cortex, 0.048; middle temporal gryus, 0.044; inferior temporal gyrus, 0.033; superior parietal, 0.050; superior temporal gyrus, 0.037; P values for all regions are shown in Extended Data Table 5. Analysis results were determined from MMRM of scheduled measurements at months 2, 6 and 17, with estimation of the difference in means between groups at month 17. P values are indicated (two-sided); as described in Methods, stated P values for all statistical tests, besides the coprimary efficacy analyses, were not corrected for multiplicity and are thus presented as nominal and not under alpha control. Error bars show one standard error on either side of the mean, with sample sizes at each time point for each group listed above the profile lines.
Fig. 3
Fig. 3. Exploratory cognitive measures and post hoc subgroup analysis of baseline MoCA as a biomarker for treatment response in early HD.
ac, Observed mean changes from baseline by treatment group over time for the placebo groups alone of cohort B1 (red circles) and B2 (brown triangles) (a), for both placebo and pepinemab treatment groups of EM cohort B1 (b) and LP cohort B2 (c). Cognitive assessments stratified by baseline MoCA scores of <26 and 26–30 for assessments of HD–CAB index (d), PTAP (e) and OTS (f). Error bars in each panel show one standard error on either side of the mean, with sample sizes at each time point for each group listed above the profile lines. PEPI (blue squares) and PBO (red circles) in EM cohort B1, and PEPI (teal diamonds) and PBO (brown triangles) in LP cohort B2.
Fig. 4
Fig. 4. Effects of pepinemab treatment on CGIC in EM cohort B1.
a, Observed categorical CGIC values at visit 17 for the entire EM cohort B1 CGIC analysis population, and in two subgroups stratified by baseline TFC value (that is, 11 and 12–13). b, Observed categorical CGIC in the subgroups stratified by TFC value over the study duration. The CGIC is a seven-point Likert scale, ranging from very much worse (−3) to very much improved (+3). Values were set to −3 following a patient death adjudged by a blinded data review committee to be related to Huntington’s disease. P values determined by one-sided Fisher’s exact test; odds ratio (95% CI) are also shown.
Extended Data Fig. 1
CONSORT diagram indicating participant numbers and disposition.
Extended Data Fig. 2
Extended Data Fig. 2. Pepinemab is detected in CSF at expected level for target engagement.
a. Drug concentration in CSF of subjects treated with pepinemab. Mean+SEM is shown; dotted lines indicate target concentration (~100-300 ng/ml). b. Concentration of soluble SEMA4D (sSEMA4D) in CSF, mean+SEM are shown for each treatment group (n = 26 PEPI, n = 28 PBO). *** indicates statistical significance, p = 0.000000001855. As seen in previous trials,, levels of total soluble SEMA4D (including complex of drug bound to target) increased 1.7-fold upon dosing due to the increased half-life of the pepinemab/SEMA4D complex in subjects treated with pepinemab compared to those treated with placebo (average of 5.9 vs 3.5 ng/ml respectively, p < 0.001), demonstrating evidence of target engagement in CSF. The mean (SD) observed maximum serum concentration (Cmax) after all infusions post visit 12 in Cohort B overall was 218 (115) µg/mL and the AUCtau over the dosing interval was 68,900 (14,447) µg*hr/mL. Based on the empirical Bayesian estimates of the pharmacokinetic parameters, the terminal elimination half-lives for Cohorts B1 and B2 were calculated to be approximately 25 and 23 days, respectively. In general, the clearance of pepinemab was low and the volume of distribution small, which is common to other therapeutic monoclonal antibodies and similar to observations in previously completed studies with pepinemab,.

References

    1. Glidden, A. et al. in Movement Disorders Vol. 32 (ed A. Jon Stoessl), Supplement 2, S183 (Wiley, 2017).
    1. Simpson JA, Lovecky D, Kogan J, Vetter LA, Yohrling GJ. Survey of the Huntington’s disease patient and caregiver community reveals most impactful symptoms and treatment needs. J. Huntingt. Dis. 2016;5:395–403. doi: 10.3233/JHD-160228. - DOI - PubMed
    1. Rub U, et al. Huntington’s disease (HD): the neuropathology of a multisystem neurodegenerative disorder of the human brain. Brain Pathol. 2016;26:726–740. doi: 10.1111/bpa.12426. - DOI - PMC - PubMed
    1. Wilton DK, Stevens B. The contribution of glial cells to Huntington’s disease pathogenesis. Neurobiol. Dis. 2020;143:104963. doi: 10.1016/j.nbd.2020.104963. - DOI - PMC - PubMed
    1. Basile JR, Gavard J, Gutkind JS. Plexin-B1 utilizes RHOA and ROK to promote the integrin-dependent activation of AKT and ERK, and endothelial cell motility. J. Biol. Chem. 2007;282:34888–34895. doi: 10.1074/jbc.M705467200. - DOI - PubMed

Publication types

Associated data