

The economic burden of treating uncomplicated hypertension in Sub-Saharan Africa: a systematic literature review
- PMID: 35941626
- PMCID: PMC9358363
- DOI: 10.1186/s12889-022-13877-4
The economic burden of treating uncomplicated hypertension in Sub-Saharan Africa: a systematic literature review
Abstract
Background and objectives: Hypertension is one of the leading cardiovascular risk factors with high numbers of undiagnosed and untreated patients in Sub Saharan Africa (SSA). The health systems and affected people are often overwhelmed by the social and economic burden that comes with the disease. However, the research on the economic burden and consequences of hypertension treatment remains scare in SSA. The objective of our review was to compare different hypertension treatment costs across the continent and identify major cost drivers.
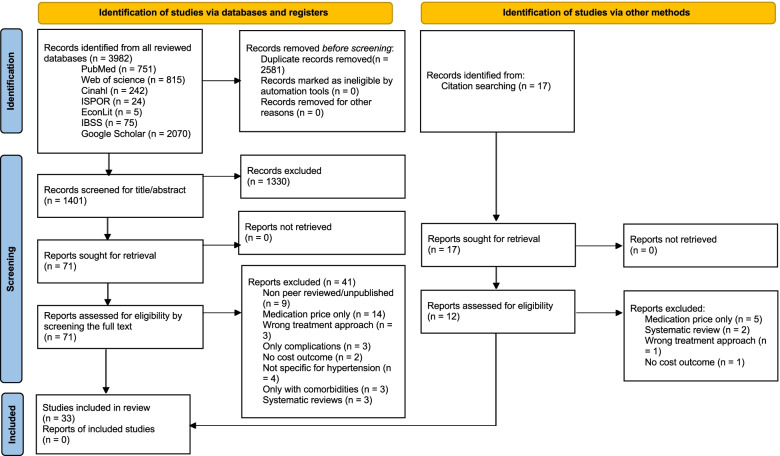
Material and methods: Systematic literature searches were conducted in multiple databases (e.g., PubMed, Web of Science, Google Scholar) for peer reviewed articles written in English language with a publication date from inception to Jan. 2022. We included studies assessing direct and indirect costs of hypertension therapy in SSA from a provider or user perspective. The search and a quality assessment were independently executed by two researchers. All results were converted to 2021 US Dollar.
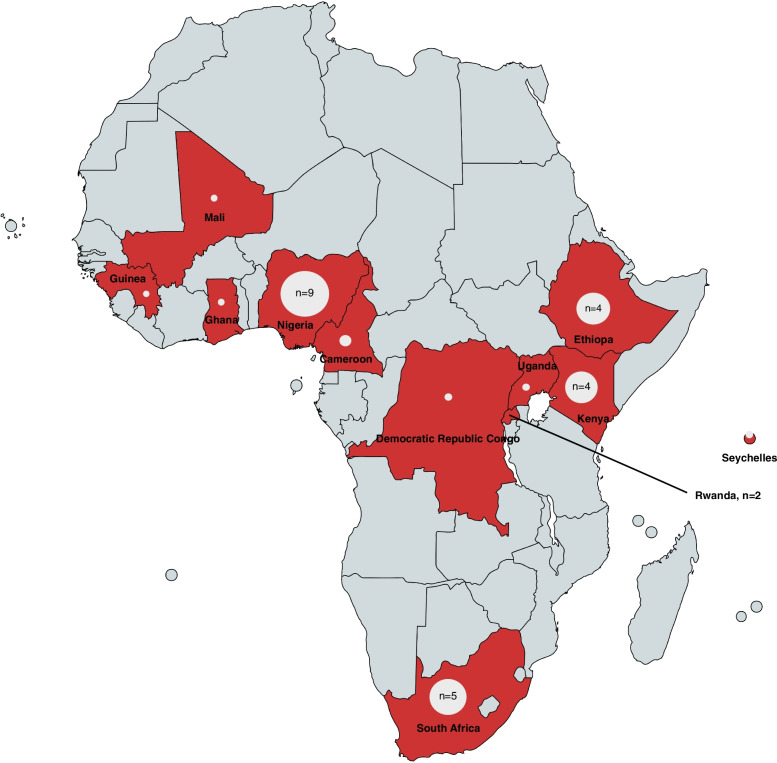
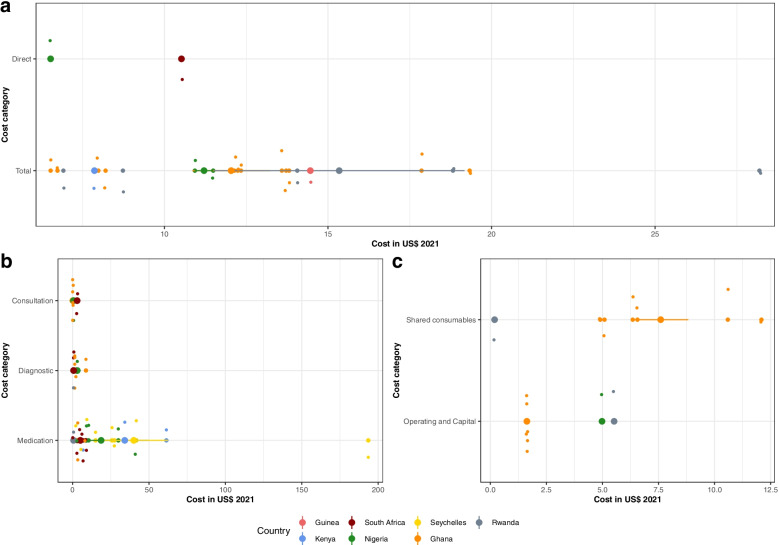
Results: Of 3999 results identified in the initial search, 33 were selected for data extraction. Costs differed between countries, costing perspectives and cost categories. Only 25% of the SSA countries were mentioned in the studies, with Nigeria dominating the research with a share of 27% of the studies. We identified 15 results each from a user or provider perspective. Medication costs were accountable for the most part of the expenditures with a range from 1.70$ to 97.06$ from a patient perspective and 0.09$ to 193.55$ from a provider perspective per patient per month. Major cost drivers were multidrug treatment, inpatient or hospital care and having a comorbidity like diabetes.
Conclusion: Hypertension poses a significant economic burden for patients and governments in SSA. Interpreting and comparing the results from different countries and studies is difficult as there are different financing methods and cost items are defined in different ways. However, our results identify medication costs as one of the biggest cost contributors. When fighting the economic burden in SSA, reducing medication costs in form of subsidies or special interventions needs to be considered.
Trial registration: Registration: PROSPERO, ID CRD42020220957.
Keywords: Economic; Hypertension; Sub-Saharan Africa.
© 2022. The Author(s).
Conflict of interest statement
Authors have nothing to disclose.
Figures


References
-
- Kokubo Y, Matsumoto C. Hypertension is a risk factor for several types of heart disease: review of prospective studies. In: Islam MS, editor. Hypertension: from basic research to clinical practice. Cham: Springer International Publishing; 2017. pp. 419–426. - PubMed
-
- World Health Organizations . Hypertension. 2021.
-
- Twagirumukiza M, De Bacquer D, Kips JG, de Backer G, Stichele RV, Van Bortel LM. Current and projected prevalence of arterial hypertension in sub-Saharan Africa by sex, age and habitat: an estimate from population studies. J Hypertens. 2011;29(7):1243–1252. doi: 10.1097/HJH.0b013e328346995d. - DOI - PubMed
Publication types
MeSH terms
LinkOut - more resources
Full Text Sources
Medical
Research Materials
