. 2023 May 1;77(5):1566-1579.
doi: 10.1002/hep.32707. Epub 2023 Apr 17.

Profiling of syngeneic mouse HCC tumor models as a framework to understand anti-PD-1 sensitive tumor microenvironments

Affiliations

Profiling of syngeneic mouse HCC tumor models as a framework to understand anti-PD-1 sensitive tumor microenvironments

Daniel J Zabransky et al. Hepatology. .

Abstract

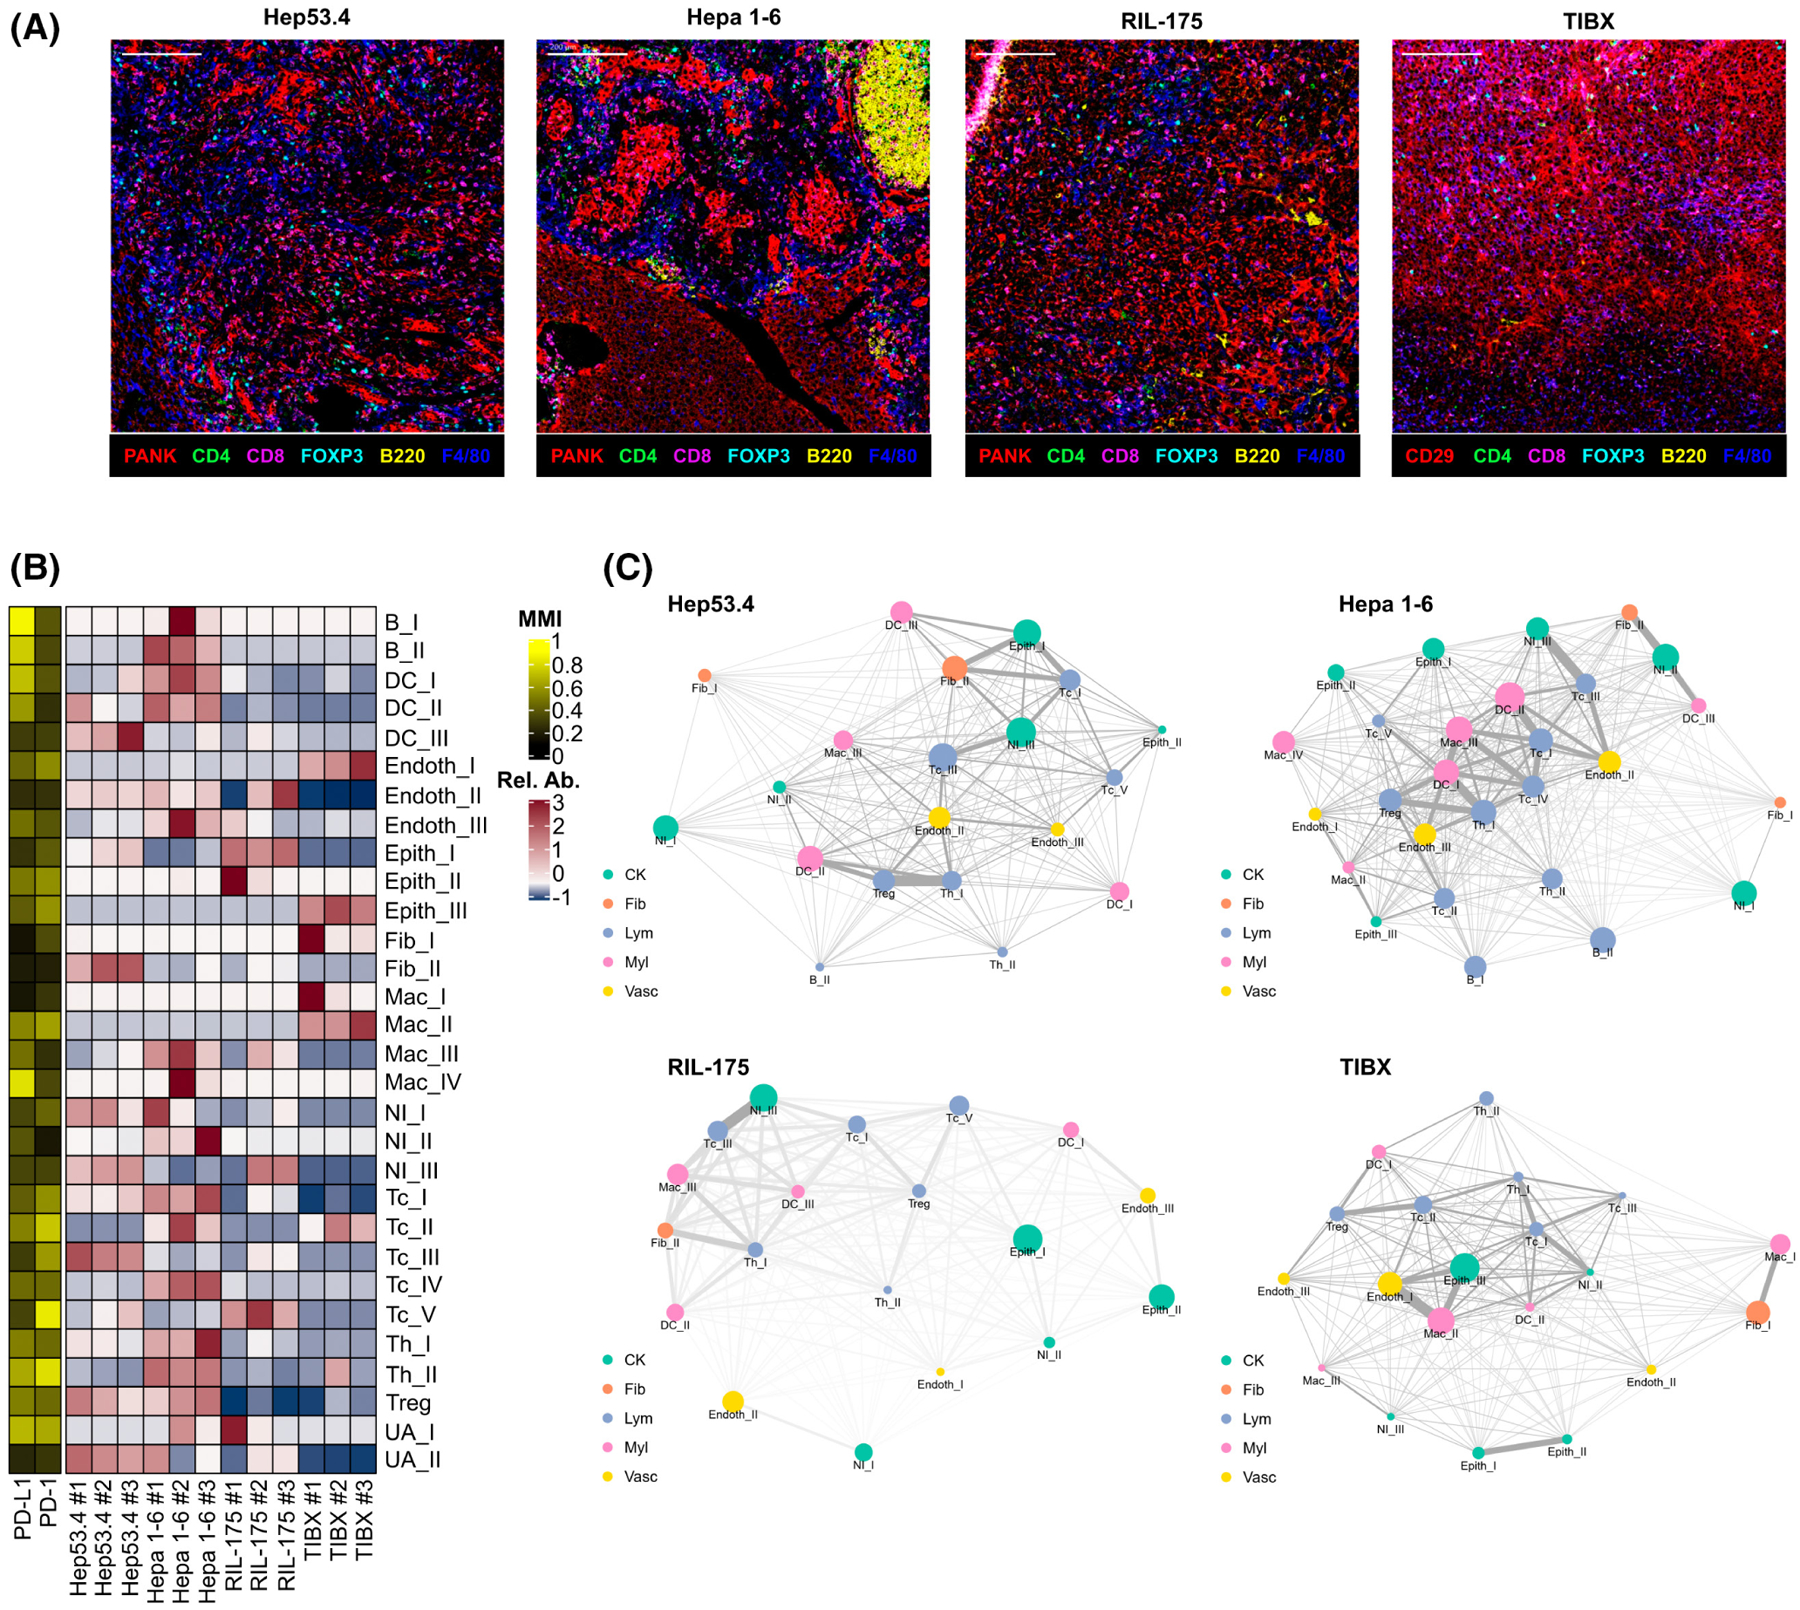
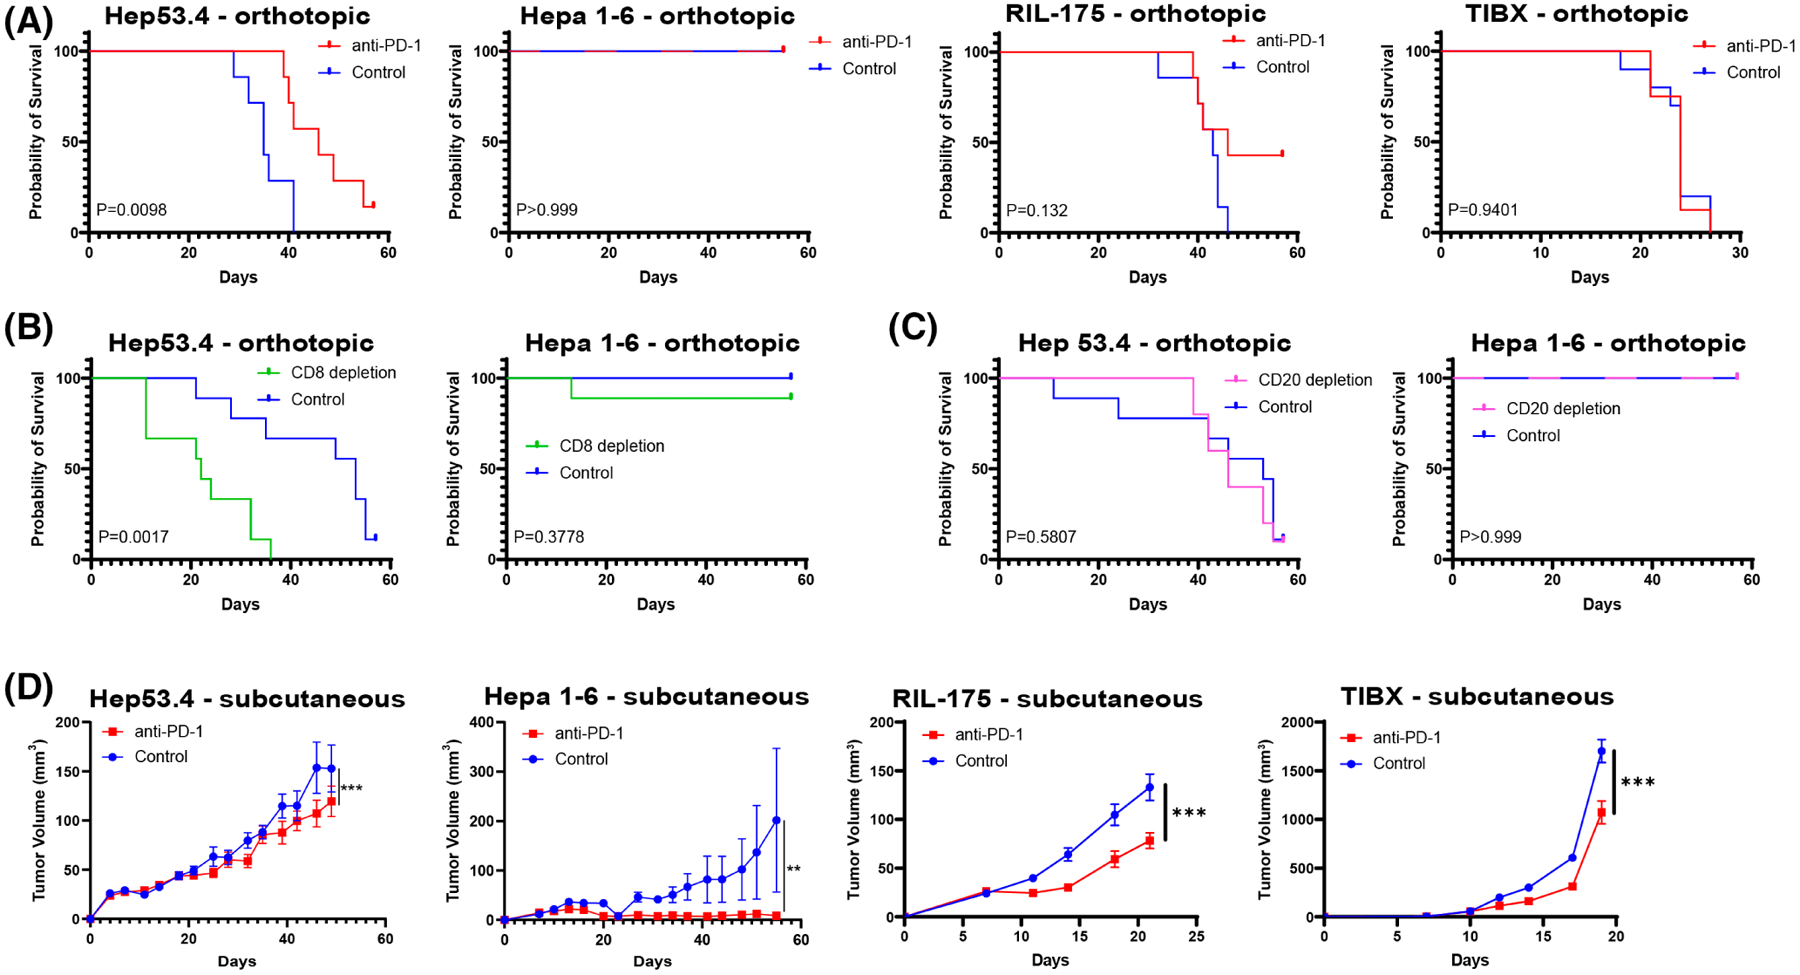
Background and aims: The treatment of hepatocellular carcinoma (HCC) has been transformed by the use of immune checkpoint inhibitors. However, most patients with HCC do not benefit from treatment with immunotherapy. There is an urgent need to understand the mechanisms that underlie response or resistance to immunotherapy for patients with HCC. The use of syngeneic mouse models that closely recapitulate the heterogeneity of human HCC will provide opportunities to examine the complex interactions between cancer cells and nonmalignant cells in the tumor microenvironment.

Approach and results: We leverage a multifaceted approach that includes imaging mass cytometry and suspension cytometry by time of flight to profile the tumor microenvironments of the Hep53.4, Hepa 1-6, RIL-175, and TIBx (derivative of TIB-75) syngeneic mouse HCC models. The immune tumor microenvironments vary across these four models, and various immunosuppressive pathways exist at baseline in orthotopic liver tumors derived from these models. For instance, TIBx, which is resistant to anti-programmed cell death protein 1 therapy, contains a high proportion of "M2-like" tumor-associated macrophages with the potential to diminish antitumor immunity. Investigation of The Cancer Genome Atlas reveals that the baseline immunologic profiles of Hep53.4, RIL-175, and TIBx are broadly representative of human HCCs; however, Hepa 1-6 does not recapitulate the immune tumor microenvironment of the vast majority of human HCCs.

Conclusions: There is a wide diversity in the immune tumor microenvironments in preclinical models and in human HCC, highlighting the need to use multiple syngeneic HCC models to improve the understanding of how to treat HCC through immune modulation.


Conflict of interest statement

Dr. Zabransky received grants from Roche/Genentech. Dr. Jaffee consults for NextCure, Carta, DragonFly, Achilles and Genocea. She received grants from Abmeta, Lustgarten, AstraZeneca, Break Through Cancer and Parker Institute. Dr. Yarchoan consults for Exelixis, Eisai and AstraZeneca.

Figures

FIGURE 1
FIGURE 1
Tumor-infiltrating immune cells and their spatial relationships differ among mouse models of hepatocellular carcinoma (HCC). (A) Representative multicolor images from imaging mass cytometry (IMC) for orthotropic Hep53.4, Hepa 1–6, RIL-175, and TIBx tumors (one mouse from each cell line selected for representation; scale bar = 200 μm). (B) Heatmap showing relative abundance (Rel. Ab.) of 30 final annotated clusters and mean metal intensity (MMI) for programmed death-ligand 1 (PD-L1) and programmed cell death protein 1 (PD-1) from orthotopic liver tumors (n = 3 from each cell line; n = 113,628 cells in total). (C) Distance relationship network visualizations of IMC data from orthotopic liver tumors for each of the four HCC models. Colors represent broad category of clusters (CK, cytokeratin+ epithelial cluster, fib, fibroblast cluster, Lym, lymphocyte cluster, Myl, myeloid cell cluster, Vasc, endothelial cell cluster). Node sizes are proportional to the relative abundance of the indicated cell type, and thicker edges indicate closer cell type interactions based on distance.
FIGURE 2
FIGURE 2
Analysis of tumor-infiltrating immune cell populations by IHC in orthotopic mouse cell line models of HCC. (A) Representative images from the four cell line models (rows) showing staining by hematoxylin and eosin (H&E) and for CD8, B220, and programmed death-ligand 1 (PD-L1) in orthotopic tumors (scale bar = 200 μm). (B) Quantification of CD8+ (left), B220+ (middle), and PD-L1+ (right) cells per high powered field at 10× magnification presented as average ± SD. Five randomly selected fields were selected per marker for each cell line. Images were analyzed using halo image analysis software (Indica Laboratories). *p < 0.05, **p < 0.01, ***p < 0.001, ****p < 0.0001 for comparisons by unpaired t tests.
FIGURE 3
FIGURE 3
Composition of tumor-infiltrating lymphoid and myeloid cell subsets in orthotopic hepatocellular carcinoma mouse models. (A) Abundance of each annotated lymphoid cell cluster as the percentage of total cells as defined by cytometry by time of flight (CyTOF) analysis in each orthotopic liver tumor (n ≥ 3 for each cell line model, N = 154,441 total number of lymphoid cells analyzed). (B) Metal intensities of PD-1 in lymphoid cell clusters from orthotopic liver tumors across cell line models. (C) Abundance of each annotated myeloid cell cluster as the percentage of total cells as defined by CyTOF analysis in each orthotopic liver tumor (n ≥ 3 for each cell line model, N = 241,784 total number of myeloid cells analyzed). (D) Metal intensities of programmed death-ligand 1 (PD-L1) in myeloid cell clusters from orthotopic liver tumors across cell line models (flase discovery rate-adjusted p values *p < 0.05, **p < 0.01, ***p < 0.001 for [B] and [D]). DC, dendritic cell; DNT, double negative T cell; GMDSC, granulocytic myeloid-derived suppressor cell; MMDSC, monocytic myeloid-derived suppressor cell; TcEM, CD8+ effector memory cell; TcN, CD8+ naïve T cell; ThEM, CD4+ effector memory cell; ThN, CD4+ naïve T cell; Treg, regulatory T cell.
FIGURE 4
FIGURE 4
In vivo efficacy of anti–PD-1 therapy differs among hepatocellular carcinoma cell line models. (A) Kaplan–Meier survival curves for mice with orthotopic tumors treated with anti–programmed cell death protein 1(PD-1) or isotype control for hep 53.4 (n = 7 per group), Hepa 1–6 (n = 10 per group), RIL-175 (n = 7 per group), and TIBx (n = 10 per group). (B) Kaplan–Meier survival curves for mice with orthotopic tumors treated with anti-CD8a or isotype control for Hep53.4 (n = 9 per group) or Hepa 1–6 (n = 9 anti-CD8a group, n = 7 control group). (C) Kaplan–Meier survival curves for mice with orthotopic tumors treated with anti-CD20 or isotype control for Hep53.4 (n = 10 anti-CD20 group, n = 9 control group) or Hepa 1–6 (n = 9 anti-CD20 group, n = 10 control group). Log-rank p value for a comparison between experimental and control-treated groups indicated on each plot in (A)–(C). (D) Subcutaneous tumor volume curves comparing treatment with anti–PD-1 or isotype control for Hep53.4 (n = 7 control group, n = 8 anti–PD-1 group), Hepa 1–6 (n = 10 per group), RIL-175 (n = 10 per group), and TIBx (n = 10 per group). Error bars = SEM; *p < 0.05, **p < 0.01, ***p < 0.001.
FIGURE 5
FIGURE 5
Human hepatocellular carcinoma (HCC) tumor immune microenvironment can be represented by mouse models of HCC. (A) Ranks of proportions of CIBERSORT data from individual tumors from the HCC (LIHC) The Cancer Genome Atlas (TCGA) dataset. Each column represents an individual tumor sample (n = 371) with ranks assigned to the 10 cell type clusters shared between both CIBERSORT and cytometry by time of flight data. (B) Individual human HCC tumor samples were then assigned to one of four mouse model profiles by maximum projection value. (C) Demographic and clinical variables presented as proportion of tumors within each mouse model profile from the LIHC TCGA dataset. The p values for Pearson’s χ2 test reported for each panel with the exception of age at diagnosis where multiple unpaired t tests were used; ***p < 0.001. DC, dendritic cell; N/A, not applicable; ThEM, CD4+ effector memory cell; Treg, regulatory T cell.

References

    1. Kim E, Viatour P. Hepatocellular carcinoma: old friends and new tricks. Exp Mol Med. 2020;52:1898–907. - PMC - PubMed
    1. Oura K, Morishita A, Tani J, Masaki T. Tumor immune microenvironment and immunosuppressive therapy in hepatocellular carcinoma: a review. Int J Mol Sci. 2021;22:5801. - PMC - PubMed
    1. Ho WJ, Zhu Q, Durham J, Popovic A, Xavier S, Leatherman J, et al. Neoadjuvant cabozantinib and nivolumab convert locally advanced hepatocellular carcinoma into resectable disease with enhanced antitumor immunity. Nat Cancer. 2021;2:891–903. - PMC - PubMed
    1. Sangro B, Sarobe P, Hervás-Stubbs S, Melero I. Advances in immunotherapy for hepatocellular carcinoma. Nat Rev Gastroenterol Hepatol. 2021;18:525–43. - PMC - PubMed
    1. Darlington GJ. Liver cell lines. Methods Enzymol. 1987;151:19–38. - PubMed

Publication types

Substances