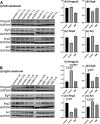
Differential proteomic analysis of mouse cerebrums with high-fat diet (HFD)-induced hyperlipidemia
- PMID: 35942128
- PMCID: PMC9356585
- DOI: 10.7717/peerj.13806
Differential proteomic analysis of mouse cerebrums with high-fat diet (HFD)-induced hyperlipidemia
Abstract
Hyperlipidemia is a chronic disease characterized by elevated blood cholesterol and triglycerides and there is accumulated evidence that the disease might affect brain functions. Here we report on a proteomic analysis of the brain proteins in hyperlipidemic mice. Hyperlipidemia was successfully induced in mice by a 20 week high-fat diet (HFD) feeding (model group). A control group with a normal diet and a treatment group with HFD-fed mice treated with a lipid-lowering drug simvastatin (SIM) were established accordingly. The proteins were extracted from the left and right cerebrum hemispheres of the mice in the three groups and subjected to shotgun proteomic analysis. A total of 4,422 proteins were detected in at least half of the samples, among which 324 proteins showed significant difference (fold change >1.5 or <0.67, p < 0.05) in at least one of the four types of comparisons (left cerebrum hemispheres of the model group versus the control group, right cerebrums of model versus control, left cerebrums of SIM versus model, right cerebrums of SIM versus model). Biological process analysis revealed many of these proteins were enriched in the processes correlated with lipid metabolism, neurological disorders, synaptic events and nervous system development. For the first time, it has been reported that some of the proteins have been altered in the brain under the conditions of HFD feeding, obesity or hyperlipidemia. Further, 22 brain processes-related proteins showed different expression in the two cerebrum hemispheres, suggesting changes of the brain proteins caused by hyperlipidemia might also be asymmetric. We hope this work will provide useful information to understand the effects of HFD and hyperlipidemia on brain proteins.
Keywords: Brain; Cerebrum; High-fat diet; Hyperlipidemia; Lipid; Mouse; Proteomics.
©2022 Chen et al.
Conflict of interest statement
The authors declare there are no competing interests.
Figures


Similar articles
-
Beneficial Effects of Red Yeast Rice on High-Fat Diet-Induced Obesity, Hyperlipidemia, and Fatty Liver in Mice.J Med Food. 2015 Oct;18(10):1095-102. doi: 10.1089/jmf.2014.3259. Epub 2015 Jul 1. J Med Food. 2015. PMID: 26133037
-
The protective effects of Salvia officinalis essential oil compared to simvastatin against hyperlipidemia, liver, and kidney injuries in mice submitted to a high-fat diet.J Food Biochem. 2020 Apr;44(4):e13160. doi: 10.1111/jfbc.13160. Epub 2020 Feb 3. J Food Biochem. 2020. PMID: 32010989
-
Beneficial effects of phosphatidylcholine on high-fat diet-induced obesity, hyperlipidemia and fatty liver in mice.Life Sci. 2014 Nov 18;118(1):7-14. doi: 10.1016/j.lfs.2014.09.027. Epub 2014 Oct 16. Life Sci. 2014. PMID: 25445436
-
High fat diet-induced hyperlipidemia and tissue steatosis in rabbits through modulating ileal microbiota.Appl Microbiol Biotechnol. 2022 Nov;106(21):7187-7207. doi: 10.1007/s00253-022-12203-7. Epub 2022 Sep 29. Appl Microbiol Biotechnol. 2022. PMID: 36173452
-
Hyperlipidemia induced by high-fat diet enhances dentin formation and delays dentin mineralization in mouse incisor.J Mol Histol. 2016 Oct;47(5):467-74. doi: 10.1007/s10735-016-9691-2. Epub 2016 Aug 24. J Mol Histol. 2016. PMID: 27558143
Cited by
-
Profiling and Cellular Analyses of Obesity-Related circRNAs in Neurons and Glia under Obesity-like In Vitro Conditions.Int J Mol Sci. 2023 Mar 25;24(7):6235. doi: 10.3390/ijms24076235. Int J Mol Sci. 2023. PMID: 37047207 Free PMC article.
-
Investigating the shared genetic architecture between obesity and depression: a large-scale genomewide cross-trait analysis.Front Endocrinol (Lausanne). 2025 May 8;16:1578944. doi: 10.3389/fendo.2025.1578944. eCollection 2025. Front Endocrinol (Lausanne). 2025. PMID: 40405979 Free PMC article.
-
Salidroside alleviates diet-induced obesity and insulin resistance by activating Nrf2/ARE pathway and enhancing the thermogenesis of adipose tissues.Food Sci Nutr. 2023 Jun 6;11(8):4735-4744. doi: 10.1002/fsn3.3450. eCollection 2023 Aug. Food Sci Nutr. 2023. PMID: 37576042 Free PMC article.
References
-
- Andreadou I, Schulz R, Badimon L, Adameová A, Kleinbongard P, Lecour S, Nikolaou PE, Falcão Pires I, Vilahur G, Woudberg N, Heusch G, Ferdinandy P. Hyperlipidaemia and cardioprotection: animal models for translational studies. British Journal of Pharmacology. 2020;177:5287–5311. doi: 10.1111/bph.14931. - DOI - PMC - PubMed
-
- Businaro R, Leone S, Fabrizi C, Sorci G, Donato R, Lauro GM, Fumagalli L. S100B protects LAN-5 neuroblastoma cells against Abeta amyloid-induced neurotoxicity via RAGE engagement at low doses but increases Abeta amyloid neurotoxicity at high doses. Journal of Neuroscience Research. 2006;83:897–906. doi: 10.1002/jnr.20785. - DOI - PubMed
-
- Cara ML, Streata I, Buga AM, Iliescu DG. Developmental brain asymmetry. The good and the bad sides. Symmetry. 2022;14:128. doi: 10.3390/sym14010128. - DOI
Publication types
MeSH terms
LinkOut - more resources
Full Text Sources

