

Sex-specific effects of maternal dietary carbohydrate quality on fetal development and offspring metabolic phenotype in mice
- PMID: 35942169
- PMCID: PMC9356227
- DOI: 10.3389/fnut.2022.917880
Sex-specific effects of maternal dietary carbohydrate quality on fetal development and offspring metabolic phenotype in mice
Erratum in
-
Erratum: Sex-specific effects of maternal dietary carbohydrate quality on fetal development and offspring metabolic phenotype in mice.Front Nutr. 2022 Nov 29;9:1094120. doi: 10.3389/fnut.2022.1094120. eCollection 2022. Front Nutr. 2022. PMID: 36532513 Free PMC article.
Abstract
Objectives: In utero glycemia is an important determinant of fetal growth. Women with gestational diabetes are more likely to deliver large-for-gestational age babies that are at increased risk for obesity. The maternal nutritional state modulates the development of offspring biological systems during the critical periods of gestation and lactation. Carbohydrate typically contributes most of the dietary energy, however, there are very few mechanistic studies investigating the effects of maternal dietary carbohydrate quality on fetal and offspring outcomes. Therefore, we sought to investigate the direct effects of maternal carbohydrate quality on sex-specific offspring metabolic programming.
Methods: Female C57BL/6 mice were fed one of five isocaloric diets: four high-sugar diets based on glucose, sucrose, isomaltulose or fructose (all containing 60% energy as carbohydrate), or a standard, minimally processed, chow diet, and were mated with chow-fed males. Half of the dams were sacrificed for fetus dissection and placental collection, with the remaining giving live birth. All dams were metabolically profiled before and during pregnancy, and pups were similarly profiled at 12 weeks of age.
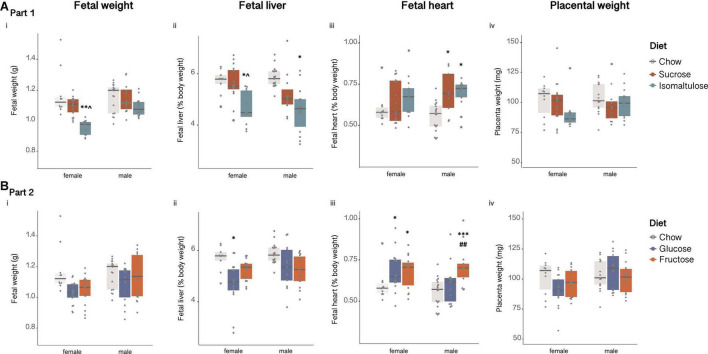
Results: Overall, glucose-fed dams were heavier and fatter than chow or isomaltulose-fed dams. Female fetuses from glucose and isomaltulose-fed mothers weighed less and had smaller livers, than those from chow-fed mothers, with isomaltulose-fed female fetuses also having decreased placental mass. In contrast, male fetuses responded differently to the maternal diets, with heart mass being significantly increased when their mothers were fed fructose-containing diets, that is, sucrose, isomaltulose and fructose. High-sugar fed female offspring weighed the same, but were significantly fatter, than chow-fed offspring at 12 weeks of age, while glucose and isomaltulose-fed male pups displayed a similar phenotype to their mothers'.
Conclusion: While both glucose and isomaltulose diets constrained fetal growth in females, only placentas from isomaltulose-fed dams were significantly smaller than those from chow-fed mothers, suggesting the mechanisms through which fetal growth is reduced may be different. Female fetuses of isomaltulose-fed mothers were also lighter than sucrose-fed fetuses suggesting the glycemic index, or rate of glucose digestion and absorption, may be an important factor in determining nutrient availability to the growing fetus.
Keywords: carbohydrate quality; glycemic index; maternal diet; metabolism; mice.
Copyright © 2022 Campbell, Lucic Fisher, Brandon, Senior and Bell-Anderson.
Conflict of interest statement
The authors declare that the research was conducted in the absence of any commercial or financial relationships that could be construed as a potential conflict of interest.
Figures


Similar articles
-
NTP technical report on the toxicity studies of Dibutyl Phthalate (CAS No. 84-74-2) Administered in Feed to F344/N Rats and B6C3F1 Mice.Toxic Rep Ser. 1995 Apr;30:1-G5. Toxic Rep Ser. 1995. PMID: 12209194
-
Effects of snack intake during pregnancy and lactation on reproductive outcome in mild hyperglycemic rats.Physiol Behav. 2021 Oct 15;240:113544. doi: 10.1016/j.physbeh.2021.113544. Epub 2021 Jul 30. Physiol Behav. 2021. PMID: 34332976
-
Effects of a maternal diet supplemented with chocolate and fructose beverage during gestation and lactation on rat dams and their offspring.Clin Exp Pharmacol Physiol. 2011 Sep;38(9):613-22. doi: 10.1111/j.1440-1681.2011.05568.x. Clin Exp Pharmacol Physiol. 2011. PMID: 21722163
-
Maternal Dietary Carbohydrate and Pregnancy Outcomes: Quality over Quantity.Nutrients. 2024 Jul 14;16(14):2269. doi: 10.3390/nu16142269. Nutrients. 2024. PMID: 39064712 Free PMC article. Review.
-
The influence of fetal sex on antenatal maternal glucose and insulin dynamics.Front Clin Diabetes Healthc. 2024 Dec 17;5:1351317. doi: 10.3389/fcdhc.2024.1351317. eCollection 2024. Front Clin Diabetes Healthc. 2024. PMID: 39742292 Free PMC article. Review.
Cited by
-
Maternal monosaccharide diets evoke cognitive, locomotor, and emotional disturbances in adolescent and young adult offspring rats.Front Nutr. 2023 May 9;10:1176213. doi: 10.3389/fnut.2023.1176213. eCollection 2023. Front Nutr. 2023. PMID: 37229474 Free PMC article.
-
Fructose Consumption in Pregnancy and Associations with Maternal and Offspring Hepatic and Whole-Body Adiposity in Rodents: A Scoping Review.Curr Dev Nutr. 2024 Nov 27;9(1):104510. doi: 10.1016/j.cdnut.2024.104510. eCollection 2025 Jan. Curr Dev Nutr. 2024. PMID: 39896731 Free PMC article.
References
-
- National Health and Medical Research Council. Australian Dietary Guidelines. Canberra, ACT: National Health and Medical Research Council; (2013).
LinkOut - more resources
Full Text Sources