. 2022 Jul 18:10.1111/rssa.12866.
doi: 10.1111/rssa.12866. Online ahead of print.

Mapping ex ante risks of COVID-19 in Indonesia using a Bayesian geostatistical model on airport network data

Affiliations

Mapping ex ante risks of COVID-19 in Indonesia using a Bayesian geostatistical model on airport network data

Jacqueline D Seufert et al. J R Stat Soc Ser A Stat Soc. .

Abstract

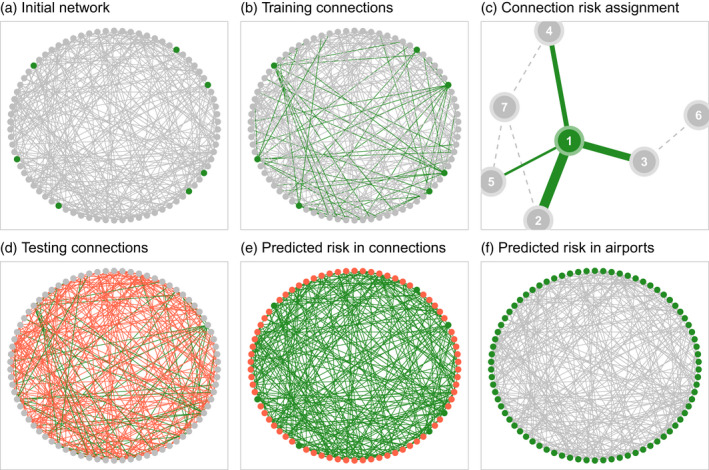
A rapid response to global infectious disease outbreaks is crucial to protect public health. Ex ante information on the spatial probability distribution of early infections can guide governments to better target protection efforts. We propose a two-stage statistical approach to spatially map the ex ante importation risk of COVID-19 and its uncertainty across Indonesia based on a minimal set of routinely available input data related to the Indonesian flight network, traffic and population data, and geographical information. In a first step, we use a generalised additive model to predict the ex ante COVID-19 risk for 78 domestic Indonesian airports based on data from a global model on the disease spread and covariates associated with Indonesian airport network flight data prior to the global COVID-19 outbreak. In a second step, we apply a Bayesian geostatistical model to propagate the estimated COVID-19 risk from the airports to all of Indonesia using freely available spatial covariates including traffic density, population and two spatial distance metrics. The results of our analysis are illustrated using exceedance probability surface maps, which provide policy-relevant information accounting for the uncertainty of the estimates on the location of areas at risk and those that might require further data collection.

Keywords: Bayesian geostatistics; COVID‐19; INLA‐SPDE; Indonesia; disease mapping; network analysis.


Figures

FIGURE 1
FIGURE 1
Workflow for predicting the ex ante COVID‐19 infection risk in Indonesia at a fine spatial scale.
FIGURE 2
FIGURE 2
Airport Network Model workflow. (a) Initial network with the seven international airports highlighted in green, (b) Training network of flights associated with these seven airports, (c) Connection risk assignment, (d) All domestic flight connections, (e) Predicted risk for these connections and (f) Predicted risk in all airports.
FIGURE 3
FIGURE 3
Airport Network Model. Mean estimated marginal effect (red lines) on the log COVID‐19 risk of three edge metric covariates. Top‐left: number of flight connections per route (NB.FLY); top‐right: connectivity (CONNECT); bottom‐left: proportion of departures per route (DEP.FLY). The blue dashed lines indicate 95% pointwise confidence intervals.
FIGURE 4
FIGURE 4
Predicted ex ante COVID‐19 risk at airports. Ex ante COVID‐19 (log) risk (x‐axis) predicted for all (78) domestic airports in Indonesia (y‐axis). Red dots correspond to the mean estimation of the log ex ante COVID‐19 risk. Bars represent 95% confidence intervals, which provide a lower and upper estimate of (log) COVID‐19 risk.
FIGURE 5
FIGURE 5
Covariates used in the Spatial Propagation Model. (a) log population size (POP), (b) log travel time to the nearest airport (ACCESS), (c) log traffic density (TRAFFIC), and (d) log Euclidean distance to Java and Bali (DIST.JAVA). All covariates are defined on a 5 × 5 km2 grid. Grey pixels are regions without population which are excluded in this study. Green dots in panel (b) indicate the location of the investigated airports (78) from which log COVID‐19 risk are taken as response in the Spatial Propagation Model.
FIGURE 6
FIGURE 6
Model validation. Q–Q plot assessing the uniformity of the PITs associated with the predictions of ex ante COVID‐19 risks (log(RISKi)) for i = {1, …, 78} hold‐out data in a leave‐one‐out cross‐validation (LOOCV) procedure. Perfect uniformity is represented by the diagonal line. Dots represent the values of the theoretical quantiles (x‐axis) of the estimated PITs along with their corresponding estimated sample quantiles (y‐axis).
FIGURE 7
FIGURE 7
Model validation. Mean (green points) and predicted 95% CI (red segments) together with the true observed values, log(RISKi), (blue points) for each hold‐out airport i = {1, …, 78}, produced by a leave‐one‐out cross‐validation (LOOCV) procedure.
FIGURE 8
FIGURE 8
Maps of the ex ante (log) COVID‐19 risk in Indonesia. The maps show the (a–c) median and (d‐f) standard deviation of the (log) ex ante COVID‐19 risk for three scenarios (I: lower (first column), II: mean (second column), III upper estimations (third column) of the response) in Indonesia predicted at fine spatial grid (5 × 5 km2).
FIGURE 9
FIGURE 9
Exceedance probability maps. Probability of log COVID‐19 risk exceeding −2.2 in scenarios I (a), II (b) and III (c). Probability of log COVID‐19 risk exceeding −1 in scenarios I (d), II (e) and III (f). The spatial resolution is 5 × 5 km2.
FIGURE A1
FIGURE A1
Indonesian domestic flight network. Flight connections and their frequency (denoted by line thickness) among the 78 domestic Indonesian airports from December 2019 to early January 2020. Data source: aviationstack (2020).
FIGURE A2
FIGURE A2
Diagnostic plots of the Airport Network Model. We provide four diagnostic plots for the Airport Network Model: (a) Q–Q plot which plots the theoretical quantiles versus the observed response, (b) histogram of the residuals, (c) Q–Q of the logged response. The response is the COVID‐19 ex ante risk of 132 connections among the airports in the domestic Indonesian network.
FIGURE A3
FIGURE A3
Diagnostic plots of the Airport Network Model based on a gamma distribution function. Q–Q plot which plots the theoretical quantiles versus the deviance of the residuals.
FIGURE A4
FIGURE A4
Model diagnostics. Top‐left: marginal posterior distribution of the fixed effects (covariate coefficients and intercept). Top‐right: marginal posterior distribution of the precision of the Gaussian unstructured error terms and the hyperparameters. Bottom‐left: marginal posterior mean and 95% CI of the spatial random effects. Bottom‐right: marginal posterior mean and 95% CI of the linear predictor and fitted values.
FIGURE A5
FIGURE A5
Predicted COVID‐19 risk in Indonesia at regency level. The map shows the predicted log‐transformed mean ex ante COVID‐19 risk in each regency (514 in total) of Indonesia. Data period: December 2019 until early January 2020.
FIGURE A6
FIGURE A6
Spatial Propagation Model: robustness check. Diagnostic plots for the investigated spatial models. Each colour represents the result of a model using a different combination of PC priors. Top: marginal posterior distribution of the fixed effects (covariate coefficients and intercept). Middle: marginal posterior distribution of the precision of the Gaussian unstructured error terms and the hyperparameters. Bottom: marginal posterior mean and 95% CI of the spatial random effects.

Similar articles

References

    1. Ahlawat, A. , Wiedensohler, A. & Mishra, S.K. (2020) An overview on the role of relative humidity in airborne transmission of SARS‐CoV‐2 in indoor environments. Aerosol and Air Quality Research, 20, 1856–1861.
    1. Asyary, A. & Veruswati, M. (2020) Sunlight exposure increased Covid‐19 recovery rates: a study in the central pandemic area of Indonesia. The Science of the Total Environment, 729, 139016. - PMC - PubMed
    1. aviationstack . (2020) Free, Real‐time Flight Status and Global Aviation Data API. [Accessed 10 January 2021] Available from: https://www.aviationstack.com
    1. Bakka, H. , Rue, H. , Fuglstad, G. , Riebler, A. , Bolin, D. , Illian, J. et al. (2018) Spatial modeling with R–INLA: a review. Wiley Interdisciplinary Reviews: Computational Statistics, 10, e1443.
    1. Bhadra, A. , Mukherjee, A. & Sarkar, K. (2021) Impact of population density on Covid‐19 infected and mortality rate in India. Modeling Earth Systems and Environment, 7, 623–629. - PMC - PubMed

LinkOut - more resources