. 2022 Aug 9:11:e78933.
doi: 10.7554/eLife.78933.

COVID-19 pandemic dynamics in South Africa and epidemiological characteristics of three variants of concern (Beta, Delta, and Omicron)

Affiliations

COVID-19 pandemic dynamics in South Africa and epidemiological characteristics of three variants of concern (Beta, Delta, and Omicron)

Wan Yang et al. Elife. .

Abstract

Severe acute respiratory syndrome coronavirus 2 (SARS-CoV-2) variants of concern (VOCs) have been key drivers of new coronavirus disease 2019 (COVID-19) pandemic waves. To better understand variant epidemiologic characteristics, here we apply a model-inference system to reconstruct SARS-CoV-2 transmission dynamics in South Africa, a country that has experienced three VOC pandemic waves (i.e. Beta, Delta, and Omicron BA.1) by February 2022. We estimate key epidemiologic quantities in each of the nine South African provinces during March 2020 to February 2022, while accounting for changing detection rates, infection seasonality, nonpharmaceutical interventions, and vaccination. Model validation shows that estimated underlying infection rates and key parameters (e.g. infection-detection rate and infection-fatality risk) are in line with independent epidemiological data and investigations. In addition, retrospective predictions capture pandemic trajectories beyond the model training period. These detailed, validated model-inference estimates thus enable quantification of both the immune erosion potential and transmissibility of three major SARS-CoV-2 VOCs, that is, Beta, Delta, and Omicron BA.1. These findings help elucidate changing COVID-19 dynamics and inform future public health planning.

Keywords: COVID-19; SARS-CoV-2; epidemiology; global health; immune evasion; none; reinfection rate; transmissibility; variant of concern.


Conflict of interest statement

WY No competing interests declared, JS JS and Columbia University disclose partial ownership of SK Analytics. JS discloses consulting for BNI

Figures

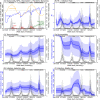
Figure 1.
Figure 1.. Pandemic dynamics in South Africa, model-fit and validation using serology data.
(A) Pandemic dynamics in each of the nine provinces (see legend); dots depict reported weekly numbers of cases and deaths; lines show model mean estimates (in the same color). (B) For validation, model estimated infection rates are compared to seroprevalence measures over time from multiple sero-surveys summarized in The South African COVID-19 Modelling Consortium, 2021. Boxplots depict the estimated distribution for each province (middle bar = mean; edges = 50% CrIs) and whiskers (95% CrIs), summarized over n=100 model-inference runs (500 model replica each, totaling 50,000 model realizations). Red dots show corresponding measurements. Note that reported mortality was high in February 2022 in some provinces (see additional discussion in Appendix 1).
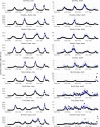
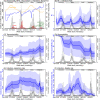
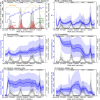
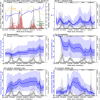
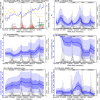
Figure 2.
Figure 2.. Model validation using retrospective prediction.
Model-inference was trained on cases and deaths data since March 15, 2020 until 2 weeks (1st plot in each panel) or 1 week (2nd plot) before the Delta or Omicron (BA.1) wave (see timing on the x-axis); the model was then integrated forward using the estimates made at the time to predict cases (left panel) and deaths (right panel) for the remaining weeks of each wave. Blue lines and surrounding shades show model fitted cases and deaths for weeks before the prediction (line = median, dark blue area = 50% CrIs, and light blue = 80% CrIs, summarized over n=100 model-inference runs totaling 50,000 model realizations). Red lines show model projected median weekly cases and deaths; surrounding shades show 50% (dark red) and 80% (light red) CIs of the prediction (n = 50,000 model realizations). For comparison, reported cases and deaths for each week are shown by the black dots; however, those to the right of the vertical dash lines (showing the start of each prediction) were not used in the model. For clarity, here we show 80% CIs (instead of 95% CIs, which tend to be wider for longer-term projections) and predictions for the four most populous provinces (Gauteng in A and B; KwaZulu-Natal in C and D; Western Cape in E and F; and Eastern Cape in G and H). Predictions for the other five provinces are shown in Appendix 1—figure 3.
Figure 3.
Figure 3.. Example model-inference estimates for Gauteng.
(A) Observed relative mobility, vaccination rate, and estimated disease seasonal trend, compared to case and death rates over time. Key model-inference estimates are shown for the time-varying effective reproduction number Rt (B), transmissibility RTX (C), population susceptibility (D, shown relative to the population size in percentage), infection-detection rate (E), and infection-fatality risk (F). Grey shaded areas indicate the approximate circulation period for each variant. In (B) – (F), blue lines and surrounding areas show the estimated mean, 50% (dark) and 95% (light) CrIs; boxes and whiskers show the estimated mean, 50% and 95% CrIs for estimated infection rates. All summary statistics are computed based on n=100 model-inference runs totaling 50,000 model realizations. Note that the transmissibility estimates (RTX in C) have removed the effects of changing population susceptibility, NPIs, and disease seasonality; thus, the trends are more stable than the reproduction number (Rt in B) and reflect changes in variant-specific properties. Also note that infection-fatality risk estimates were based on reported COVID-19 deaths and may not reflect true values due to likely under-reporting of COVID-19 deaths.
Figure 4.
Figure 4.. Model-inferred epidemiological properties for different variants across SA provinces.
Heatmaps show (A) Estimated mean infection rates by week (x-axis) and province (y-axis), (B) Estimated mean cumulative infection numbers relative to the population size in each province, and (C) Estimated population susceptibility (to the circulating variant) by week and province. (D) Boxplots in the top row show the estimated distribution of increases in transmissibility for Beta, Delta, and Omicron (BA.1), relative to the Ancestral SARS-CoV-2, for each province (middle bar = median; edges = 50% CIs; and whiskers = 95% CIs; summarized over n=100 model-inference runs); boxplots in the bottom row show, for each variant, the estimated distribution of immune erosion to all adaptive immunity gained from infection and vaccination prior to that variant. Red lines show the mean across all provinces.
Appendix 1—figure 1.
Appendix 1—figure 1.. Model-fit to case and death data in each province.
Dots show reported SARS-CoV-2 cases and deaths by week. Blue lines and surrounding area show model estimated median, 50% (darker blue) and 95% (lighter blue) credible intervals. Note that reported mortality was high in February 2022 in some provinces with no clear explanation.
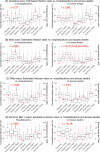
Appendix 1—figure 2.
Appendix 1—figure 2.. Model validation using hospitalization and excess mortality data.
Model estimated infection rates are compared to COVID-related hospitalizations (left panel) and excess mortality (right panel) during the Ancestral (A), Beta (B), Delta (C), and Omicron (D) waves. Boxplots show the estimated distribution for each province (middle bar = mean; edges = 50% CrIs and whiskers = 95% CrIs). Red dots show COVID-related hospitalizations (left panel, right y-axis) and excess mortality (right panel, right y-axis); these are independent measurements not used for model fitting. Correlation (r) is computed between model estimates (i.e., median cumulative infection rates for the nine provinces) and the independent measurements (i.e., hospitalizations in the nine provinces in left panel, and age-adjusted excess mortality in the right panel), for each wave. Note that hospitalization data begin from 6/6/20 and excess mortality data begin from 5/3/20 and thus are incomplete for the ancestral wave.
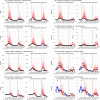
Appendix 1—figure 3.
Appendix 1—figure 3.. Model validation using retrospective prediction, for the remaining 5 provinces.
Model-inference was trained on cases and deaths data since March 15, 2020 until 2 weeks (1st plot in each panel) or 1 week (2nd plot) before the Delta or Omicron wave (see timing on the x-axis); the model was then integrated forward using the estimates made at the time to predict cases (left panel) and deaths (right panel) for the remaining weeks of each wave. Blue lines and surrounding shades show model fitted cases and deaths for weeks before the prediction (line = median, dark blue area = 50% CrIs, and light blue = 80% CrIs). Red lines show model projected median weekly cases and deaths; surrounding shades show 50% (dark red) and 80% (light red) CIs of the prediction. For comparison, reported cases and deaths for each week are shown by the black dots; however, those to the right of the vertical dash lines (showing the start of each prediction) were not used in the model. For clarity, here we show 80% CIs (instead of 95% CIs, which tend to be wider for longer-term projections) and predictions for the five least populous provinces (Limpopo in A and B; Mpumalanga in C and D; North West in E and F; Free State in G and H; and Northern Cape in I and J). Predictions for the other 4 provinces are shown in Figure 2.
Appendix 1—figure 4.
Appendix 1—figure 4.. Model inference estimates for KwaZulu-Natal.
(A) Observed relative mobility, vaccination rate, and estimated disease seasonal trend, compared to case and death rates over time. Key model-inference estimates are shown for the time-varying effective reproduction number Rt (B), transmissibility RTX (C), population susceptibility (D, shown relative to the population size in percentage), infection-detection rate (E), and infection-fatality risk (F). Grey shaded areas indicate the approximate circulation period for each variant. In (B) – (F), blue lines and surrounding areas show the estimated mean, 50% (dark) and 95% (light) CrIs; boxes and whiskers show the estimated mean, 50% and 95% CrIs for estimated infection rates. Note that the transmissibility estimates (RTX in C) have removed the effects of changing population susceptibility, NPIs, and disease seasonality; thus, the trends are more stable than the reproduction number (Rt in B) and reflect changes in variant-specific properties. Also note that infection-fatality risk estimates were based on reported COVID-19 deaths and may not reflect true values due to likely under-reporting of COVID-19 deaths.
Appendix 1—figure 5.
Appendix 1—figure 5.. Model inference estimates for Western Cape.
(A) Observed relative mobility, vaccination rate, and estimated disease seasonal trend, compared to case and death rates over time. Key model-inference estimates are shown for the time-varying effective reproduction number Rt (B), transmissibility RTX (C), population susceptibility (D, shown relative to the population size in percentage), infection-detection rate (E), and infection-fatality risk (F). Grey shaded areas indicate the approximate circulation period for each variant. In (B) – (F), blue lines and surrounding areas show the estimated mean, 50% (dark) and 95% (light) CrIs; boxes and whiskers show the estimated mean, 50% and 95% CrIs for estimated infection rates. Note that the transmissibility estimates (RTX in C) have removed the effects of changing population susceptibility, NPIs, and disease seasonality; thus, the trends are more stable than the reproduction number (Rt in B) and reflect changes in variant-specific properties. Also note that infection-fatality risk estimates were based on reported COVID-19 deaths and may not reflect true values due to likely under-reporting of COVID-19 deaths.
Appendix 1—figure 6.
Appendix 1—figure 6.. Model inference estimates for Eastern Cape.
(A) Observed relative mobility, vaccination rate, and estimated disease seasonal trend, compared to case and death rates over time. Key model-inference estimates are shown for the time-varying effective reproduction number Rt (B), transmissibility RTX (C), population susceptibility (D, shown relative to the population size in percentage), infection-detection rate (E), and infection-fatality risk (F). Grey shaded areas indicate the approximate circulation period for each variant. In (B) – (F), blue lines and surrounding areas show the estimated mean, 50% (dark) and 95% (light) CrIs; boxes and whiskers show the estimated mean, 50% and 95% CrIs for estimated infection rates. Note that the transmissibility estimates (RTX in C) have removed the effects of changing population susceptibility, NPIs, and disease seasonality; thus, the trends are more stable than the reproduction number (Rt in B) and reflect changes in variant-specific properties. Also note that infection-fatality risk estimates were based on reported COVID-19 deaths and may not reflect true values due to likely under-reporting of COVID-19 deaths.
Appendix 1—figure 7.
Appendix 1—figure 7.. Model inference estimates for Limpopo.
(A) Observed relative mobility, vaccination rate, and estimated disease seasonal trend, compared to case and death rates over time. Key model-inference estimates are shown for the time-varying effective reproduction number Rt (B), transmissibility RTX (C), population susceptibility (D, shown relative to the population size in percentage), infection-detection rate (E), and infection-fatality risk (F). Grey shaded areas indicate the approximate circulation period for each variant. In (B) – (F), blue lines and surrounding areas show the estimated mean, 50% (dark) and 95% (light) CrIs; boxes and whiskers show the estimated mean, 50% and 95% CrIs for estimated infection rates. Note that the transmissibility estimates (RTX in C) have removed the effects of changing population susceptibility, NPIs, and disease seasonality; thus, the trends are more stable than the reproduction number (Rt in B) and reflect changes in variant-specific properties. Also note that infection-fatality risk estimates were based on reported COVID-19 deaths and may not reflect true values due to likely under-reporting of COVID-19 deaths.
Appendix 1—figure 8.
Appendix 1—figure 8.. Model inference estimates for Mpumalanga.
(A) Observed relative mobility, vaccination rate, and estimated disease seasonal trend, compared to case and death rates over time. Key model-inference estimates are shown for the time-varying effective reproduction number Rt (B), transmissibility RTX (C), population susceptibility (D, shown relative to the population size in percentage), infection-detection rate (E), and infection-fatality risk (F). Grey shaded areas indicate the approximate circulation period for each variant. In (B) – (F), blue lines and surrounding areas show the estimated mean, 50% (dark) and 95% (light) CrIs; boxes and whiskers show the estimated mean, 50% and 95% CrIs for estimated infection rates. Note that the transmissibility estimates (RTX in C) have removed the effects of changing population susceptibility, NPIs, and disease seasonality; thus, the trends are more stable than the reproduction number (Rt in B) and reflect changes in variant-specific properties. Also note that infection-fatality risk estimates were based on reported COVID-19 deaths and may not reflect true values due to likely under-reporting of COVID-19 deaths.
Appendix 1—figure 9.
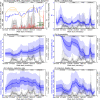
Appendix 1—figure 9.. Model inference estimates for North West.
(A) Observed relative mobility, vaccination rate, and estimated disease seasonal trend, compared to case and death rates over time. Key model-inference estimates are shown for the time-varying effective reproduction number Rt (B), transmissibility RTX (C), population susceptibility (D, shown relative to the population size in percentage), infection-detection rate (E), and infection-fatality risk (F). Grey shaded areas indicate the approximate circulation period for each variant. In (B) – (F), blue lines and surrounding areas show the estimated mean, 50% (dark) and 95% (light) CrIs; boxes and whiskers show the estimated mean, 50% and 95% CrIs for estimated infection rates. Note that the transmissibility estimates (RTX in C) have removed the effects of changing population susceptibility, NPIs, and disease seasonality; thus, the trends are more stable than the reproduction number (Rt in B) and reflect changes in variant-specific properties. Also note that infection-fatality risk estimates were based on reported COVID-19 deaths and may not reflect true values due to likely under-reporting of COVID-19 deaths.
Appendix 1—figure 10.
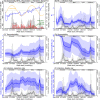
Appendix 1—figure 10.. Model inference estimates for Free State.
(A) Observed relative mobility, vaccination rate, and estimated disease seasonal trend, compared to case and death rates over time. Key model-inference estimates are shown for the time-varying effective reproduction number Rt (B), transmissibility RTX (C), population susceptibility (D, shown relative to the population size in percentage), infection-detection rate (E), and infection-fatality risk (F). Grey shaded areas indicate the approximate circulation period for each variant. In (B) – (F), blue lines and surrounding areas show the estimated mean, 50% (dark) and 95% (light) CrIs; boxes and whiskers show the estimated mean, 50% and 95% CrIs for estimated infection rates. Note that the transmissibility estimates (RTX in C) have removed the effects of changing population susceptibility, NPIs, and disease seasonality; thus, the trends are more stable than the reproduction number (Rt in B) and reflect changes in variant-specific properties. Also note that infection-fatality risk estimates were based on reported COVID-19 deaths and may not reflect true values due to likely under-reporting of COVID-19 deaths.
Appendix 1—figure 11.
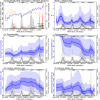
Appendix 1—figure 11.. Model inference estimates for Northern Cape.
(A) Observed relative mobility, vaccination rate, and estimated disease seasonal trend, compared to case and death rates over time. Key model-inference estimates are shown for the time-varying effective reproduction number Rt (B), transmissibility RTX (C), population susceptibility (D, shown relative to the population size in percentage), infection-detection rate (E), and infection-fatality risk (F). Grey shaded areas indicate the approximate circulation period for each variant. In (B) – (F), blue lines and surrounding areas show the estimated mean, 50% (dark) and 95% (light) CrIs; boxes and whiskers show the estimated mean, 50% and 95% CrIs for estimated infection rates. Note that the transmissibility estimates (RTX in C) have removed the effects of changing population susceptibility, NPIs, and disease seasonality; thus, the trends are more stable than the reproduction number (Rt in B) and reflect changes in variant-specific properties. Also note that infection-fatality risk estimates were based on reported COVID-19 deaths and may not reflect true values due to likely under-reporting of COVID-19 deaths.
Appendix 1—figure 12.
Appendix 1—figure 12.. Comparison of posterior estimates for Gauteng during the Omicron (BA.1) wave, under four different settings for infection-detection rate.
Four space reprobing (SR) settings for the infection-detection rate were tested and results are shown in the 4 four columns: (1) Use of the same baseline range as before (i.e., 1%–8%) for all weeks during the Omicron (BA.1) wave; (2) Use of a wider and higher range (i.e., 1%–12%) for all weeks; (3) Use of a range of 1%–15% for the 1st week of Omicron detection, 5%–20% for the 2nd week of Omicron detection, and 1%–8% for the rest; and (4) Use of a range of 5%–25% for the 2nd week of detection and 1%–8% for all other weeks. Estimated infection-detection rates are shown in the 1st row, population susceptibility estimates are shown in the 2nd row, and transmissibility estimates are shown in the 3rd row. In each plot, blue lines and surrounding areas show the median, 50% and 95% CrIs of the posterior (left y-axis) for each week (x-axis). For comparison, reported cases for corresponding weeks are shown by the grey bars (right y-axis).
Appendix 1—figure 13.
Appendix 1—figure 13.. Comparison of retrospective prediction of the Omicron (BA.1) wave in Gauteng with the four different settings of infection-detection rate.
Four space reprobing (SR) settings for the infection-detection rate were tested, and the results are shown in the 4 panels: (1) Use of the same baseline range as before (i.e., 1%–8%) for all weeks during the Omicron (BA.1) wave; (2) Use of a wider and higher range (i.e., 1%–12%) for all weeks; (3) Use of a range of 1%–15% for the 1st week of Omicron detection, 5%–20% for the 2nd week of Omicron detection, and 1%–8% for the rest; and (4) Use of a range of 5%–25% for the 2nd week of detection and 1%–8% for all other weeks. Blue lines and show model fitted cases for weeks before the prediction. Red lines show model projected median weekly cases and deaths; surrounding shades show 50% (dark red) and 80% (light red) CIs of the prediction. For comparison, reported cases for each week are shown by the black dots; however, those to the right of the vertical dash lines (showing the start of each prediction) were not used in the model.
Appendix 1—figure 14.
Appendix 1—figure 14.. Comparison of the estimated increase in transmissibility and immune erosion for the Omicron (BA.1) variant in Gauteng, under four different settings of the infection-detection rate.
Four space reprobing (SR) settings for the infection-detection rate were tested: (1) Use of the same baseline range as before (i.e., 1%–8%) for all weeks during the Omicron (BA.1) wave; (2) Use of a wider and higher range (i.e., 1%–12%) for all weeks; (3) Use of a range of 1%–15% for the 1st week of Omicron detection, 5%–20% for the 2nd week of Omicron detection, and 1%–8% for the rest; and (4) Use of a range of 5%–25% for the 2nd week of detection and 1%–8% for all other weeks. Boxplots in left panel show the estimated distribution of increases in transmissibility, relative to the Ancestral SARS-CoV-2 (middle bar = median; edges = 50% CIs; and whiskers = 95% CIs); boxplots in the right panel show the estimated distribution of immune erosion to all adaptive immunity gained from infection and vaccination prior to the surge of Omicron (BA.1) wave.
Appendix 1—figure 15.
Appendix 1—figure 15.. Posterior estimates for the transmission rate (βt in Equation 1) by week.
Thick black lines show the median, dark blue areas show the 50% CrIs, and light blue areas show the 95% CrIs. For reference, the dashed vertical black lines indicate three dates (mm/dd/yy), that is 10/15/20, 5/15/21, and 11/15/21, roughly the start of the Beta, Delta, and Omicron waves, respectively.
Appendix 1—figure 16.
Appendix 1—figure 16.. Posterior estimates for the latent period (Zt in Equation 1) by week.
Thick black lines show the median, dark blue areas show the 50% CrIs, and light blue areas show the 95% CrIs. For reference, the dashed vertical black lines indicate three dates (mm/dd/yy), i.e., 10/15/20, 5/15/21, and 11/15/21, roughly the start of the Beta, Delta, and Omicron waves, respectively.
Appendix 1—figure 17.
Appendix 1—figure 17.. Posterior estimates for the infectious period (Dt in Equation 1) by week.
Thick black lines show the median, dark blue areas show the 50% CrIs, and light blue areas show the 95% CrIs. For reference, the dashed vertical black lines indicate three dates (mm/dd/yy), i.e., 10/15/20, 5/15/21, and 11/15/21, roughly the start of the Beta, Delta, and Omicron waves, respectively.
Appendix 1—figure 18.
Appendix 1—figure 18.. Posterior estimates for the immunity period (Lt in Equation 1) by week.
Thick black lines show the median, dark blue areas show the 50% CrIs, and light blue areas show the 95% CrIs. For reference, the dashed vertical black lines indicate three dates (mm/dd/yy), i.e., 10/15/20, 5/15/21, and 11/15/21, roughly the start of the Beta, Delta, and Omicron waves, respectively.
Appendix 1—figure 19.
Appendix 1—figure 19.. Posterior estimates for the scaling factor of NPI effectiveness (et in Equation 1) by week.
Thick black lines show the median, dark blue areas show the 50% CrIs, and light blue areas show the 95% CrIs. For reference, the dashed vertical black lines indicate three dates (mm/dd/yy), i.e., 10/15/20, 5/15/21, and 11/15/21, roughly the start of the Beta, Delta, and Omicron waves, respectively.
Appendix 1—figure 20.
Appendix 1—figure 20.. Posterior estimates for the mean of time from infectiousness to detection (Td, mean in the observation model) by week.
Thick black lines show the median, dark blue areas show the 50% CrIs, and light blue areas show the 95% CrIs. For reference, the dashed vertical black lines indicate three dates (mm/dd/yy), i.e., 10/15/20, 5/15/21, and 11/15/21, roughly the start of the Beta, Delta, and Omicron waves, respectively.
Appendix 1—figure 21.
Appendix 1—figure 21.. Posterior estimates for the standard deviation of time from infectiousness to detection (Td, sd in the observation model) by week.
Thick black lines show the median, dark blue areas show the 50% CrIs, and light blue areas show the 95% CrIs. For reference, the dashed vertical black lines indicate three dates (mm/dd/yy), i.e., 10/15/20, 5/15/21, and 11/15/21, roughly the start of the Beta, Delta, and Omicron waves, respectively.
Appendix 1—figure 22.
Appendix 1—figure 22.. Posterior estimates for infection-detection rate (rt in the observation model) by week.
Thick black lines show the median, dark blue areas show the 50% CrIs, and light blue areas show the 95% CrIs. For reference, the dashed vertical black lines indicate three dates (mm/dd/yy), i.e., 10/15/20, 5/15/21, and 11/15/21, roughly the start of the Beta, Delta, and Omicron waves, respectively.
Appendix 1—figure 23.
Appendix 1—figure 23.. Posterior estimates for infection-fatality risk (IFRt in the observation model) by week.
Thick black lines show the median, dark blue areas show the 50% CrIs, and light blue areas show the 95% CrIs. For reference, the dashed vertical black lines indicate three dates (mm/dd/yy), i.e., 10/15/20, 5/15/21, and 11/15/21, roughly the start of the Beta, Delta, and Omicron waves, respectively.
Author response image 1.
Author response image 1.. Example test runs comparing initial prior ranges of infection detection rate.
When a higher initial prior range (5 – 20%, top row) was used, the model prior tended to largely over estimate cases and underestimate deaths, suggesting the infection detection rate was likely lower than 5 – 20%; whereas when a lower initial prior range (1-10%, bottom row) was used, the model prior more closely captured the observed weekly cases and deaths throughout the entire first wave, suggesting it is a more appropriate range. Due to the large numbers of parameter range combinations and potential changes over time, we opted to use a wide prior parameter range that is able to reproduce the observed cases and deaths relatively well based on this simple initial test.
Author response image 2.
Author response image 2.. Estimated seasonal trends using climate data during 2000 – 2020 and 2020 – 2021.
Note that data were not available for Free State, Gauteng, Limpopo, Mpumalanga, and North West and only available for 3 weather stations in Northern Cape during years 2020 – 2021.

Update of

Similar articles

Cited by

References

    1. Abu-Raddad LJ, Chemaitelly H, Ayoub HH, Yassine HM, Benslimane FM, Al Khatib HA, Tang P, Hasan MR, Coyle P, AlMukdad S, Al Kanaani Z, Al Kuwari E, Jeremijenko A, Kaleeckal AH, Latif AN, Shaik RM, Abdul Rahim HF, Nasrallah GK, Al Kuwari MG, Butt AA, Al Romaihi HE, Al-Thani MH, Al Khal A, Bertollini R. Severity, Criticality, and Fatality of the SARS-CoV-2 Beta Variant. Clinical Infectious Diseases; 2021a. - DOI - PMC - PubMed
    1. Abu-Raddad LJ, Chemaitelly H, Butt AA, National Study Group for COVID-19 Vaccination Effectiveness of the bnt162b2 covid-19 vaccine against the b.1.1.7 and b.1.351 variants. The New England Journal of Medicine. 2021b;385:187–189. doi: 10.1056/NEJMc2104974. - DOI - PMC - PubMed
    1. Allen H, Vusirikala A, Flannagan J, Twohig KA, Zaidi A, Chudasama D, Lamagni T, Groves N, Turner C, Rawlinson C, Lopez-Bernal J, Harris R, Charlett A, Dabrera G, Kall M, COVID-19 Genomics UK (COG-UK Consortium) Household transmission of COVID-19 cases associated with SARS-CoV-2 delta variant (B.1.617.2): national case-control study. The Lancet Regional Health. Europe. 2022;12:e100252. doi: 10.1016/j.lanepe.2021.100252. - DOI - PMC - PubMed
    1. Anderson JL. An ensemble adjustment kalman filter for data assimilation. Monthly Weather Review. 2001;129:2884–2903. doi: 10.1175/1520-0493(2001)129<2884:AEAKFF>2.0.CO;2. - DOI
    1. Andrews N, Stowe J, Kirsebom F, Toffa S, Rickeard T, Gallagher E, Gower C, Kall M, Groves N, O’Connell AM, Simons D, Blomquist PB, Zaidi A, Nash S, Aziz N, Thelwall S, Dabrera G, Myers R, Amirthalingam G, Gharbia S, Barrett JC, Elson R, Ladhani SN, Ferguson N, Zambon M, Campbell CN, Brown K, Hopkins S, Chand M, Ramsay M, Bernal JL. Effectiveness of COVID-19 Vaccines against the Omicron (B.1.1.529) Variant of Concern. medRxiv. 2021 doi: 10.1101/2021.12.14.21267615. - DOI - PubMed

Publication types