. 2022 Aug 30;13(4):e0061122.
doi: 10.1128/mbio.00611-22. Epub 2022 Aug 9.

A Dynamic Interplay of Circulating Extracellular Vesicles and Galectin-1 Reprograms Viral Latency during HIV-1 Infection

Affiliations

A Dynamic Interplay of Circulating Extracellular Vesicles and Galectin-1 Reprograms Viral Latency during HIV-1 Infection

Julia Rubione et al. mBio. .

Abstract

Combined Antiretroviral therapy (cART) suppresses HIV replication but fails to eradicate the virus, which persists in a small pool of long-lived latently infected cells. Immune activation and residual inflammation during cART are considered to contribute to viral persistence. Galectins, a family of β-galactoside-binding proteins, play central roles in host-pathogen interactions and inflammatory responses. Depending on their structure, glycan binding specificities and/or formation of distinct multivalent signaling complexes, different members of this family can complement, synergize, or oppose the function of others. Here, we identify a regulatory circuit, mediated by galectin-1 (Gal-1)-glycan interactions, that promotes reversal of HIV-1 latency in infected T cells. We found elevated levels of circulating Gal-1 in plasma from HIV-1-infected individuals, which correlated both with inflammatory markers and the transcriptional activity of the reservoir, as determined by unspliced-RNA (US-RNA) copy number. Proinflammatory extracellular vesicles (EVs) isolated from the plasma of HIV-infected individuals induced Gal-1 secretion by macrophages. Extracellularly, Gal-1 interacted with latently infected resting primary CD4+ T cells and J-LAT cells in a glycan-dependent manner and reversed HIV latency via activation of the nuclear factor κB (NF-κB). Furthermore, CD4+ T cells isolated from HIV-infected individuals showed increased HIV-1 transcriptional activity when exposed to Gal-1. Thus, by modulating reservoir dynamics, EV-driven Gal-1 secretion by macrophages links inflammation with HIV-1 persistence in cART-treated individuals. IMPORTANCE Antiretroviral therapy has led to a dramatic reduction in HIV-related morbidity and mortality. However, cART does not eradicate the virus, which persists in resting CD4+ T cells as the main viral reservoir, consequently requiring lifelong treatment. A major question is how the functional status of the immune system during antiretroviral therapy determines the activity and size of the viral reservoir. In this study, we identified a central role for galectin-1 (Gal-1), a glycan-binding protein released in response to extracellular vesicles (EVs), in modulating the activity of HIV reservoir, thus shaping chronic immune activation in HIV-infected patients. Our work unveils a central role of Gal-1 in linking chronic immune activation and reservoir dynamics, highlighting new therapeutic opportunities in HIV infection.

Keywords: chronic inflammation; extracellular vesicles; galectin-1; human immunodeficiency virus; viral reservoir.


Conflict of interest statement

The authors declare no conflict of interest.

Figures

FIG 1
FIG 1
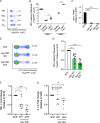
Gal-1 is elevated in the plasma of HIV-1-infected individuals. (A) Concentrations of Gal-1 in the plasma of 13 HIV-1-negative and 51 HIV-1-positive individuals were determined by ELISA. (B) HIV-1-infected individuals were classified according to the course of infection and treatment status. (C) Changes in plasma levels of Gal-1 over time in 10 cART-treated individuals. The first blood sample was obtained at the time of diagnosis and before initiation of cART treatment (baseline), and subsequent samples were obtained at the indicated months after initiation of cART treatment. Serum Gal-1 levels were determined by ELISA. (D and E) Virological and immunological status associated with cART treatment were evaluated in subjects analyzed for panel C by determination of viral load (D) and CD4+ T cell counts (E) at different times after treatment initiation. (F to H) Correlation analysis between Gal-1 levels present in serum samples from HIV-infected individuals under cART and inflammatory markers, including sCD14 (F), IP-10 (G), and sCD163 (H). (I and J) Correlation between Gal-1 levels present in serum samples from HIV-infected individuals under cART and reservoir size, as determined by average copy number of unspliced HIV RNA (I) and average HIV DNA copies (J). P values were calculated using the Mann-Whitney and Kruskal-Wallis tests (A and B, respectively). ***, P < 0.001; ****, P < 0.001. (F to J) r value and P value correspond to Spearman’s test.
FIG 2
FIG 2
Extracellular vesicles (EVs) circulating in the plasma of HIV-1-infected individuals trigger Gal-1 secretion by macrophages. (A) EVs were isolated by SEC followed by centrifugation from plasma of either healthy controls or HIV-1-infected individuals. The presence and purity of EVs in each fraction collected were analyzed by immunoblotting. Fractions 4 to 6 (enriched in EV markers) were pooled and centrifuged at 30,000 × g, and the pellet containing the EVs was resuspended in PBS. Illustration previously published in reference (32). (B) Characterization of plasma EVs by immunoblot analysis. Equal amounts of EV fractions (4 to 6) and non-EV fractions (7 to 9) from cART-treated HIV+ or healthy donor plasma were analyzed for CD63, CD9, ALIX, and HSP70 (inclusion markers) or IgG and APOA1 (exclusion markers). (C) Albumin was determined by immunoturbidimetry on plasma EV preparations from cART-treated HIV+ or healthy donor plasma and on plasma samples (PL) as positive controls. (D) Transmission electron microscopy (TEM) micrographs showing EVs purified by SEC combined with centrifugation at 30,000 × g from plasma of cART-treated HIV+ and healthy donors. Scale bars are shown for all micrographs. (E) Size distribution of plasma EVs from healthy and HIV+ cART-treated donors obtained by NTA, showing mean concentration (n = 9) for each EV size (circles) and the nonlinear regression fit (line). (F) Determination by NTA of the concentration (means ± SEM) of EVs isolated by SEC followed by centrifugation in plasma from healthy (black, n = 9) or cART-treated HIV+ (red, n = 8) donors. (G) Purified EVs from the plasma of either uninfected or HIV-1-infected individuals were added to MDM cultures (2.5 × 105/well). The presence of Gal-1 in cell culture supernatant was determined by ELISA at day 1 after addition of EVs. (H) Kinetics of Gal-1 production by MDMs stimulated with EVs isolated from plasma of HIV-1-infected individuals. (I) IL-6 production and release by MDMs stimulated for 24 h with EVs isolated from the plasma of HIV-1-infected individuals was evaluated in cell culture supernatants by ELISA. Mean values segregated by MDM donors are shown. In total, samples from 8 healthy EV donor and 11 HIV+ cART-treated EV donors were analyzed. P values were calculated using unpaired (G to I) or paired (H) Student’s t test. *, P < 0.05; **, P < 0.01.
FIG 3
FIG 3
Gal-1 produced by EV-stimulated macrophages activate HIV-1 latency. (A and B) MDMs were stimulated with EVs isolated from the plasma of either uninfected or HIV-1-infected individuals for 24 h. Conditioned medium was collected, centrifuged to remove cells and cell debris, and added to cultures of J-LAT cells (3 × 105; clone 10.6). Latency reversal was determined 24 h later by determining the percentage of eGFP-positive J-LAT cells by FACS. (A) Representative dot plots depicting eGFP expression in cells treated with MDM supernatants after EVHD/HIV stimulation are shown together with negative (PBS) and positive (PMA) controls (A). Results from two independent experiments in which 8 and 5 EVHIV donors were analyzed using two independent MDM cultures, respectively (B), are shown. (C) Expression of Gal-1 in MDMs was silenced by shRNA. LGALS1 mRNA levels were evaluated by qPCR. Pooled data from two donors are shown. (D and E) Gal-1-silenced MDMs were stimulated with EVHIV and conditioned medium was used to stimulate J-LAT cells (3 × 105 cells, clone 10.6). Representative dot plots (D) and pooled data (normalized to scrambled) from three independent experiments including 8 EV donors and MDMs from three different donors (E) are shown. (F and G) TNF-α and IL-1β concentrations were determined in conditioned medium from panel E by a cytokine bead array. P values were calculated using unpaired Student’s t test (B) or one-way ANOVA (C, E, F, and G). *, P < 0.05; **, P < 0.01; ***, P < 0.001; ****, P < 0.0001.
FIG 4
FIG 4
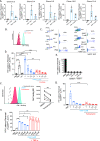
Gal-1 promotes HIV latency reversal in the J-LAT cell model in a glycan-dependent fashion. (A) The effect of rGal-1 on HIV-1 latency reactivation was analyzed in five different clones of J-LAT cells (clones 6.3, 8.4, 9.2, 10.6, and 15.4). (B) Binding of Gal-1 to the surface of J-LAT cells (clone 10.6) was analyzed by incubating 1 × 105 cells with biotinylated Gal-1 (12.5 μg/mL) in the absence or presence of lactose (Lac; 30 mM) for 1 h at 4°C. After extensive washing, cells were incubated with streptavidin-Alexa Fluor 647 (SA) and binding of Gal-1 to the cell surface was analyzed by FACS. (C and D) Latency reactivation in J-LAT cells (clone 10.6; 3 × 104) stimulated with the indicated doses of rGal-1 in the absence or presence of lactose (30 mM) was determined by quantifying the percentage of eGFP-positive cells in the annexin V/7-AAD gate by FACS at 24 h poststimulation. PMA (0.5 ng/mL) was used as a positive control and PBS as negative control. Representative dot plots (C) and pooled data from 6 experiments (D) are shown. (E) The effects of oxidized Gal-1 (oxGal-1) and monomeric Gal-1 (monGal-1) on HIV-1 latency reactivation were analyzed. PMA (5 ng/mL) was used as a positive control. (F and G) J-LAT cells were treated with the N-glycosylation inhibitor tunicamycin (4 μg/mL) for 18 h at 37°C. Representative histograms showing the binding of recombinant Gal-1 (rGal-1) (left) and the quantification of six independent experiments (right) are shown (F). Cells were incubated with the indicated doses of rGal-1 for 24 h, and latency reversal was analyzed by determining eGFP expression by FACS (from 2 independent experiments) (G). (H) HIV-1 latency reversal in J-LAT cells (3 × 105; clone 10.6) stimulated with TNF-α (0.03 ng/mL), different rGal-1 concentrations, or both are shown (from 2 independent experiments). P values were calculated using one-way ANOVA (A, D, G, H) or paired Student’s t test (F). ns, nonsignificant; DMSO, dimethyl sulfoxide. *, P < 0.05; **, P < 0.01; ***, P < 0.001; ****, P < 0.0001.
FIG 5
FIG 5
Gal-1 induces HIV latency reactivation through modulation of the NF-κB pathway. (A) Cytosolic IκB-α expression was analyzed by immunoblotting in J-LAT cells stimulated with rGal-1 for 1 h or left unstimulated (UT). A representative blot (top) and the quantification of 3 blots (bottom) are shown. (B and C) Induction of NF-κB activity in J-LAT cells, as determined by quantification of p65 nuclear translocation, analyzed by indirect immunofluorescence. A representative image (B) and the analysis of the mean nuclear fluorescence of ~60 cells per condition performed by blinded operators (C) are shown. (D) J-LAT cells were exposed to an NF-κB inhibitor (BAY-117082; 3 μg/mL) or left untreated for 30 min prior to stimulation with increasing doses of rGal-1. HIV-1 latency reactivation was determined at 24 h poststimulation by determining the percentage of GFP-positive cells by FACS. P values were calculated using one-way ANOVA (C and D) or paired Student’s t test (A). *, P < 0.05; **, P < 0.01; ***, P < 0.001; ****, P < 0.0001.
FIG 6
FIG 6
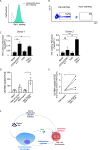
Gal-1 induces HIV-1 latency reversal in human primary CD4+ T cells. (A) Gal-1 binding to human CD4+ T cells was analyzed by flow cytometry. Streptavidin alone served as a control (SA alone). (B) Resting CD4+ T cells were stimulated with CCL19 (100 nM) for 24 h and infected with HIV-EGFP. On day 5 postinfection, GFP+ cells were removed by FACS and GFP CD4+ T cells were kept for further experiments. (C) GFP CD4+ T cells were stimulated with either anti-CD3/-CD28 MAb plus IL-7 (50 ng/mL), PHA (1 μg/mL), or PHA (1 μg/mL) plus rGal-1 (7 μM) or left untreated as a control (basal). GFP expression was analyzed at day 3 poststimulation by flow cytometry. (D and E) Ex vivo HIV latency reversal was assessed in CD4+ T cells from HIV-infected individuals under cART. Cells were purified and cultured for 16 h in the absence of stimuli (basal) or in the presence of PMA (50 ng/mL) and ionomycin (1 μg/mL) as a positive control and stimulated with suboptimal concentrations of PMA (2 ng/mL) either combined or not with rGal-1 (7 μM). A representative graph from 1 patient (D) and pooled data from 4 patients are shown (E). (F) Working model. EVs circulating in the blood of HIV-1-infected individuals stimulate macrophages to secrete both proinflammatory cytokines and Gal-1. Gal-1, in turn, binds to latently infected CD4+ T cells in a glycan-dependent fashion and triggers activation of the NF-κB pathway, resulting in HIV latency reversal. Subsequently, low levels of viral replication or the expression of viral pathogen recognition molecular patterns (PAMPs) boosts the inflammatory response. Thus, a regulatory circuit mediated by EVs and Gal-1 controls reservoir dynamics during HIV-1 infection. P values were calculated using one-way ANOVA (B and D) or Student’s t test (E). *, P < 0.05; **, P < 0.01; ***, P < 0.001.

Similar articles

Cited by

References

    1. Chomont N, El-Far M, Ancuta P, Trautmann L, Procopio FA, Yassine-Diab B, Boucher G, Boulassel M-R, Ghattas G, Brenchley JM, Schacker TW, Hill BJ, Douek DC, Routy J-P, Haddad EK, Sékaly R-P. 2009. HIV reservoir size and persistence are driven by T cell survival and homeostatic proliferation. Nat Med 15:893–900. doi:10.1038/nm.1972. - DOI - PMC - PubMed
    1. Wong JK, Hezareh M, Günthard HF, Havlir DV, Ignacio CC, Spina CA, Richman DD. 1997. Recovery of replication-competent HIV despite prolonged suppression of plasma viremia. Science 278:1291–1295. doi:10.1126/science.278.5341.1291. - DOI - PubMed
    1. Finzi D, Hermankova M, Pierson T, Carruth LM, Buck C, Chaisson RE, Quinn TC, Chadwick K, Margolick J, Brookmeyer R, Gallant J, Markowitz M, Ho DD, Richman DD, Siliciano RF. 1997. Identification of a reservoir for HIV-1 in patients on highly active antiretroviral therapy. Science 278:1295–1300. doi:10.1126/science.278.5341.1295. - DOI - PubMed
    1. Chun T-W, Justement JS, Murray D, Hallahan CW, Maenza J, Collier AC, Sheth PM, Kaul R, Ostrowski M, Moir S, Kovacs C, Fauci AS. 2010. Rebound of plasma viremia following cessation of antiretroviral therapy despite profoundly low levels of HIV reservoir: implications for eradication. AIDS 24:2803–2808. doi:10.1097/QAD.0b013e328340a239. - DOI - PMC - PubMed
    1. Chun TW, Davey RT, Engel D, Lane HC, Fauci AS. 1999. Re-emergence of HIV after stopping therapy. Nature 401:874–875. doi:10.1038/44755. - DOI - PubMed

Publication types