. 2022 Aug 1;5(8):e2225821.
doi: 10.1001/jamanetworkopen.2022.25821.

Association of Albuminuria and Regression of Chronic Kidney Disease in Adults With Newly Diagnosed Moderate to Severe Chronic Kidney Disease

Affiliations

Association of Albuminuria and Regression of Chronic Kidney Disease in Adults With Newly Diagnosed Moderate to Severe Chronic Kidney Disease

Meghann Pasternak et al. JAMA Netw Open. .

Abstract

Importance: People with chronic kidney disease (CKD) are risk-stratified for adverse events based on estimated glomerular filtration rate (eGFR) and albuminuria level. CKD has often a favorable course (CKD regression) regardless of eGFR. Determining whether lower albuminuria is associated with CKD regression may have implications on CKD management.

Objective: To assess the 5-year probability of CKD regression across albuminuria categories accounting for the competing risks of CKD progression and death in people with newly diagnosed CKD and the association between albuminuria level and CKD regression.

Design, setting, and participants: This population-based cohort study used administrative and laboratory data from Alberta, Canada, for adults with incident moderate to severe CKD (defined as sustained eGFR of 15-44 mL/min/1.73 m2 for >90 days), between April 1, 2008, and March 31, 2017, and albuminuria measures before cohort entry. Data analysis occurred in January to June 2022.

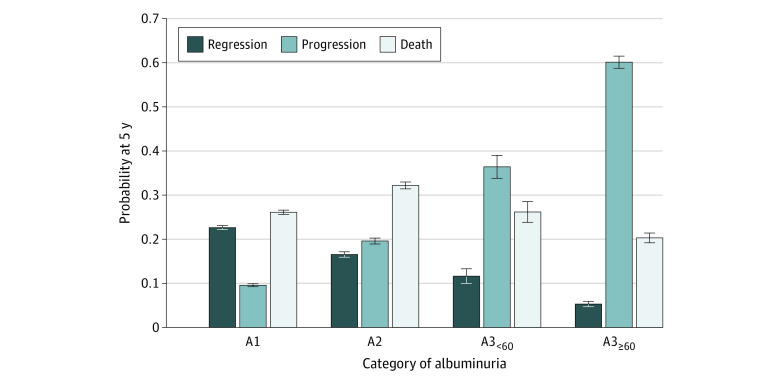
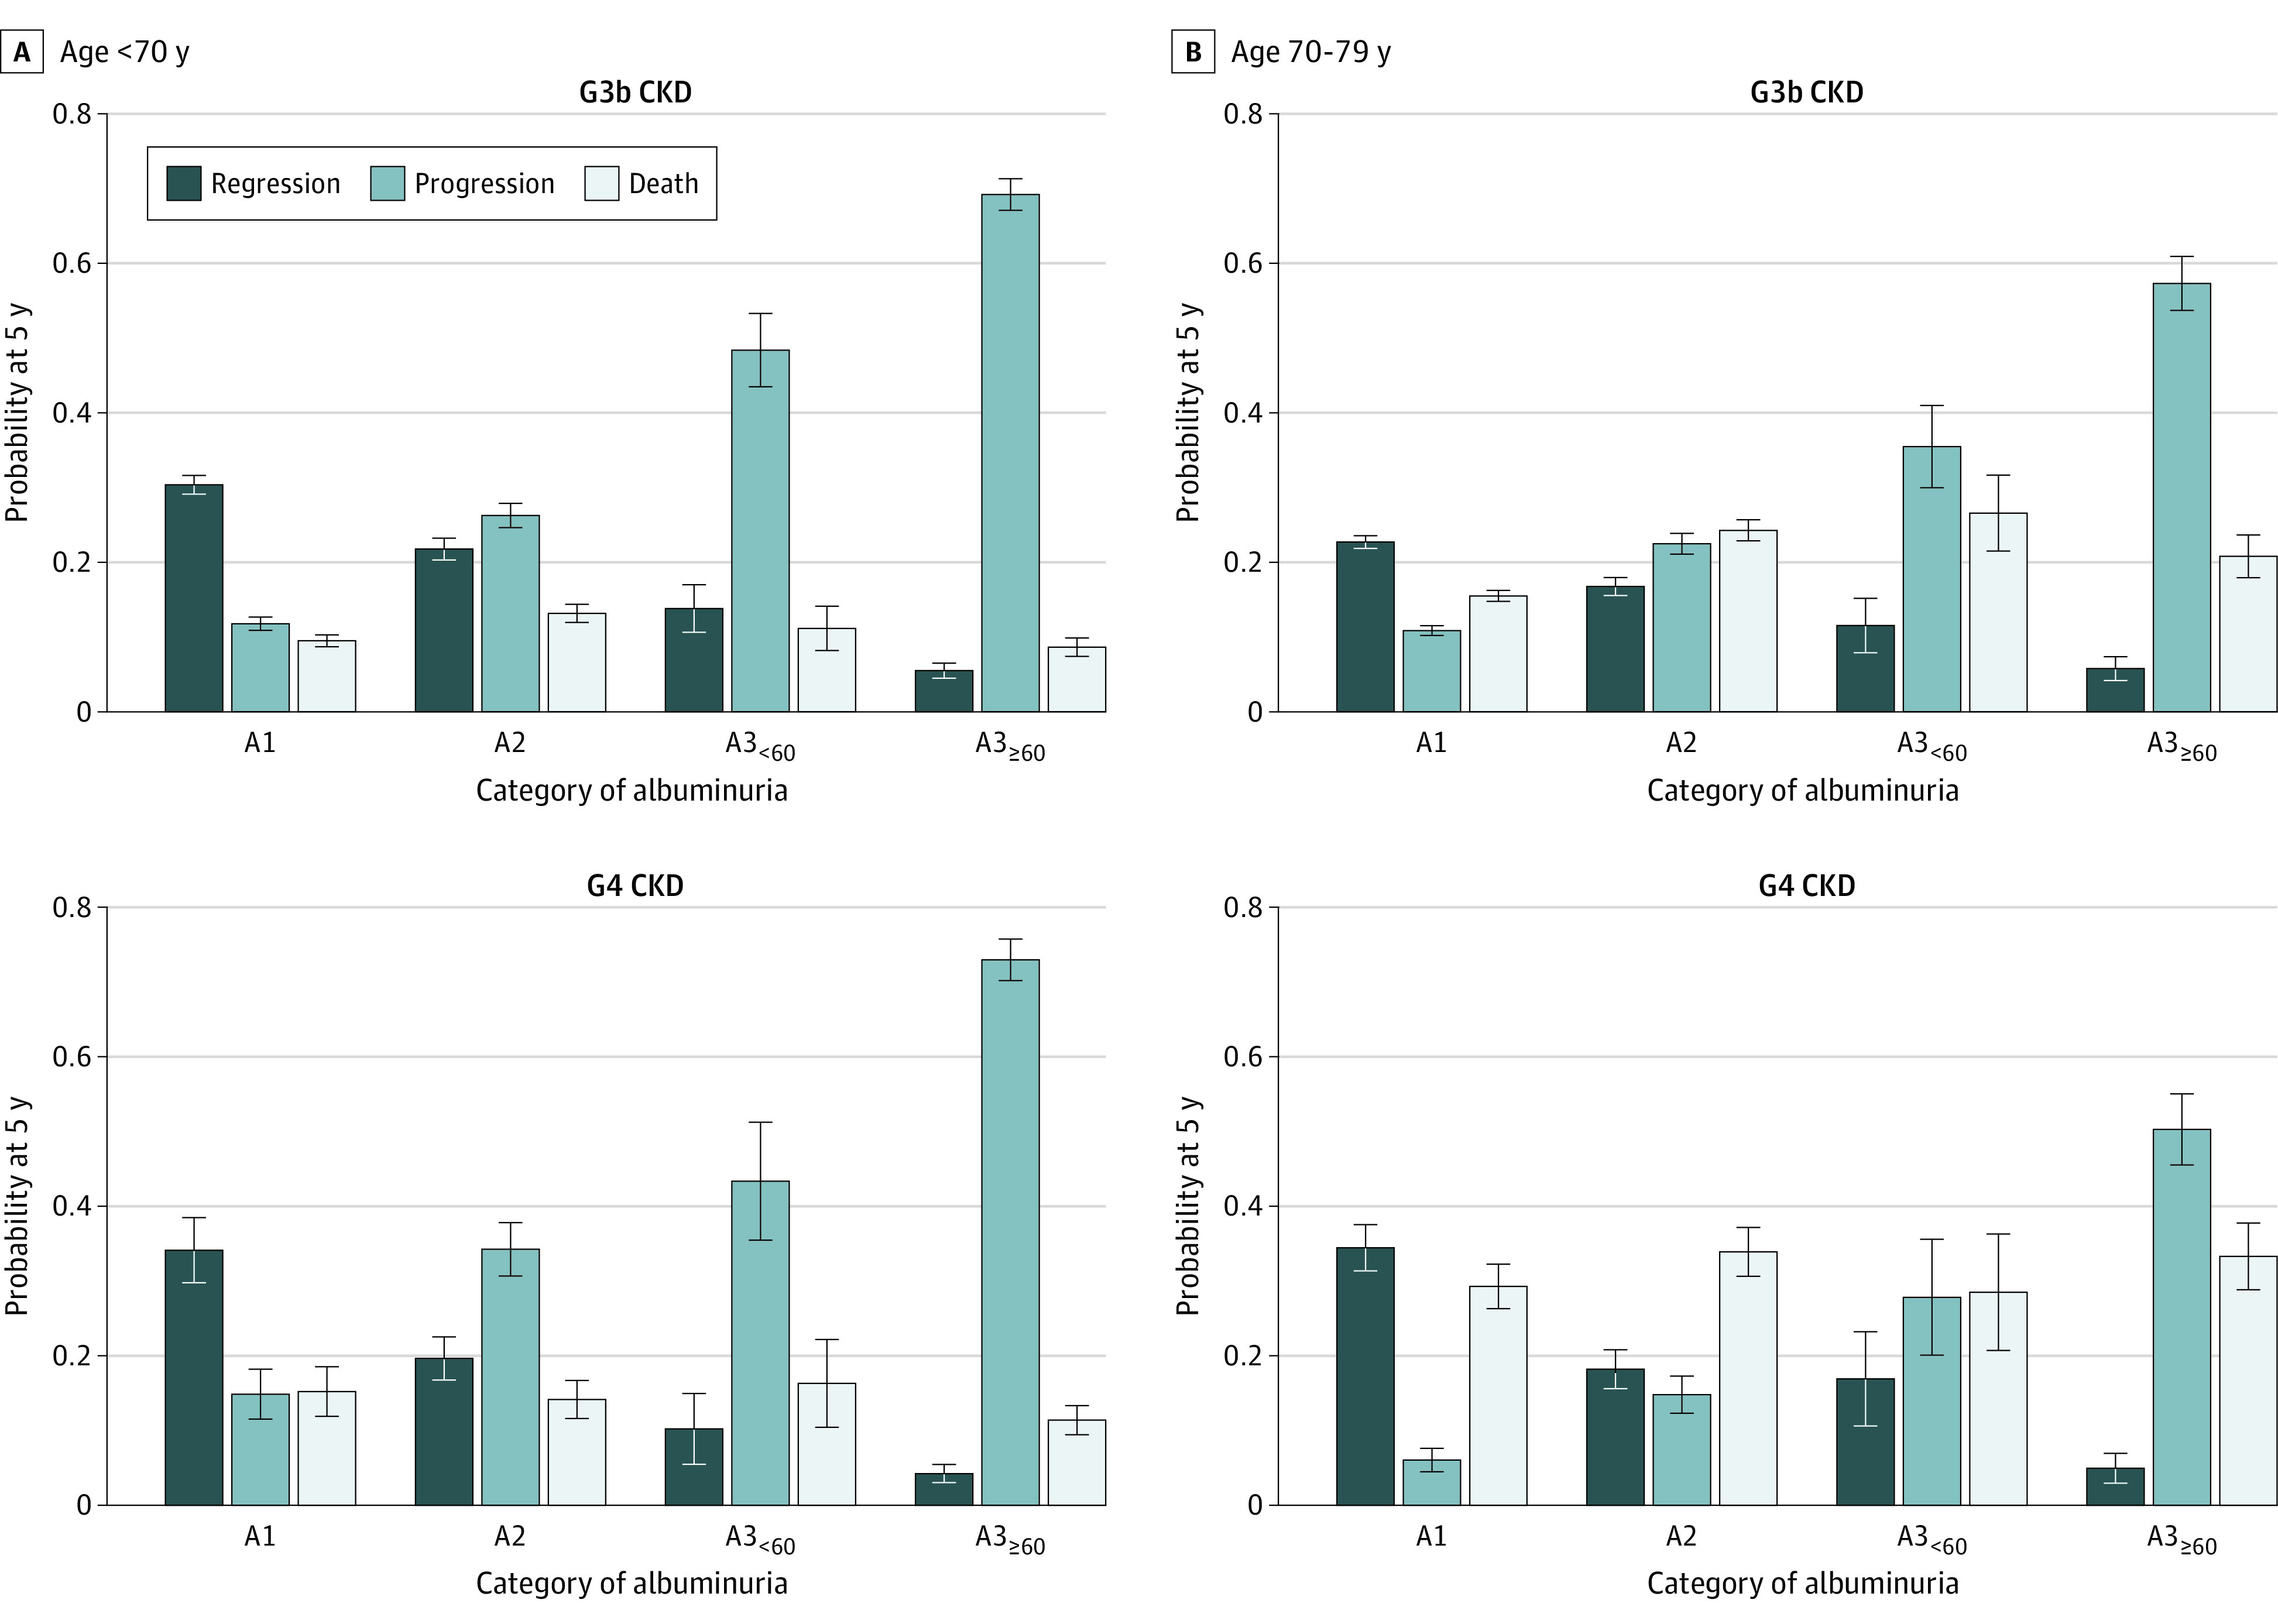
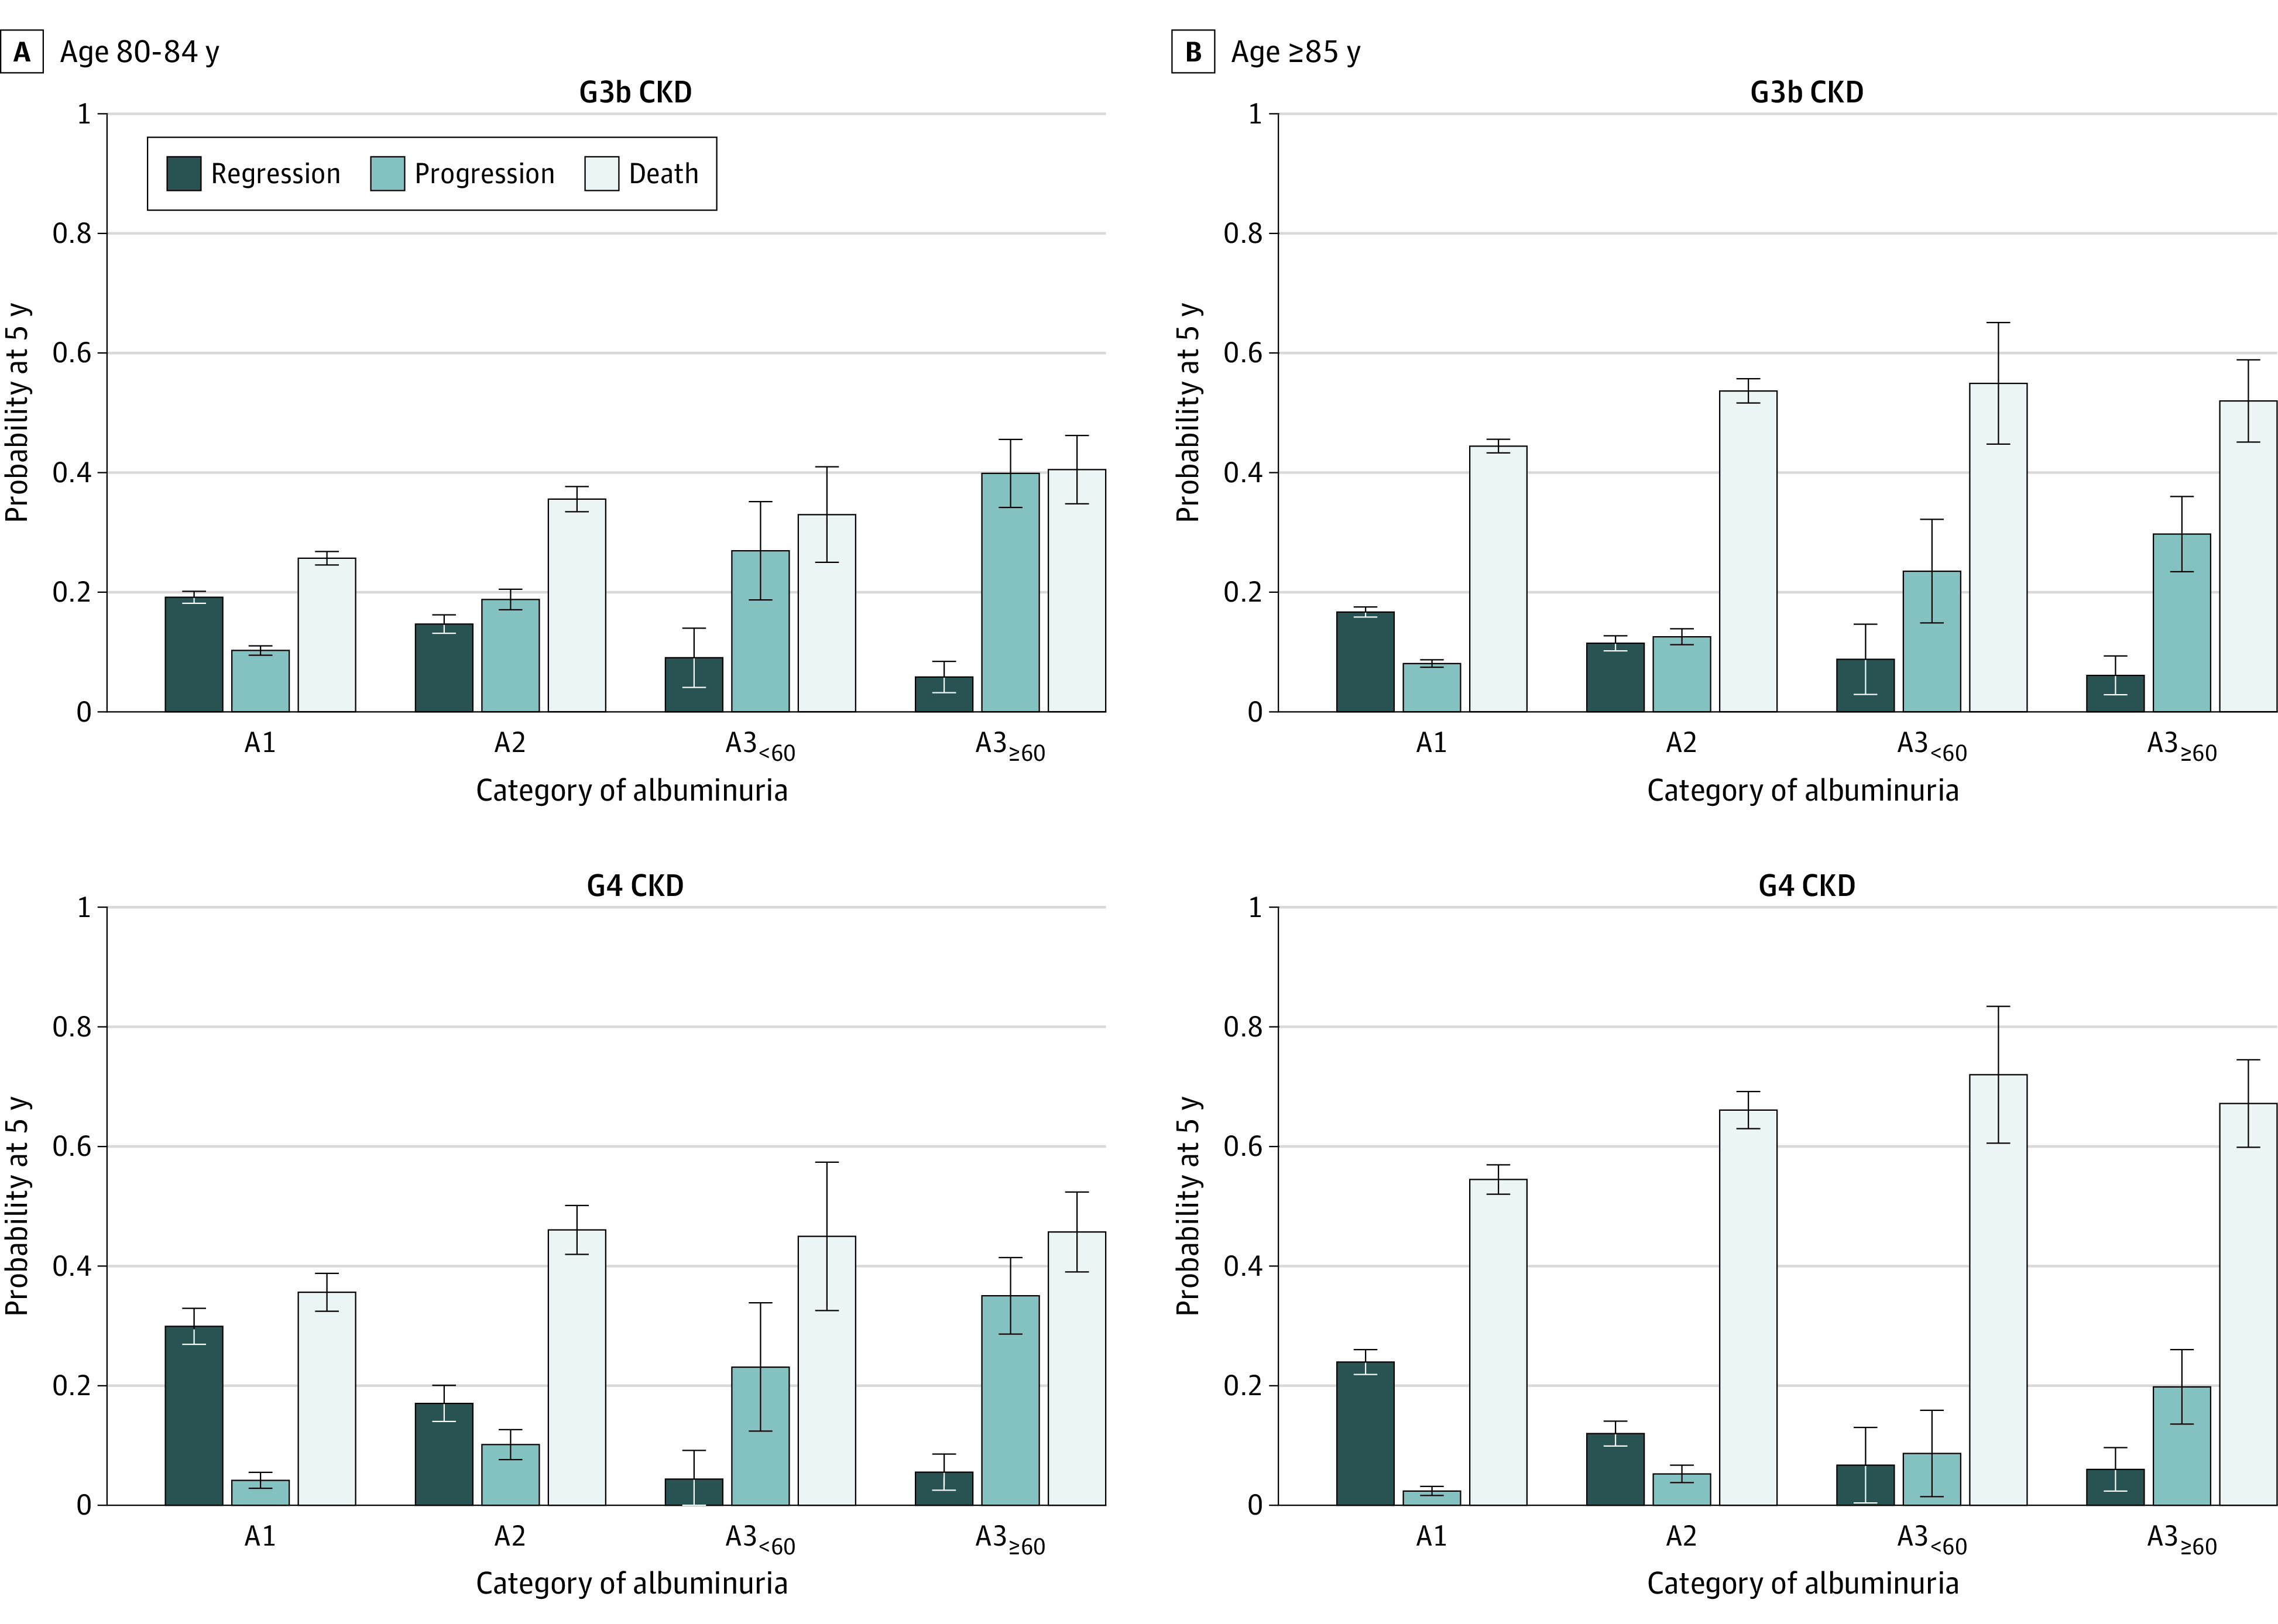
Exposure: Albuminuria categories were defined by albumin to creatinine ratios (ACRs): A1 (ACR, <3 mg/mmol), A2 (ACR, 3-29 mg/mmol), A3<60 (ACR, 30-59 mg/mmol), and A3≥60 (ACR, ≥60 mg/mmol).

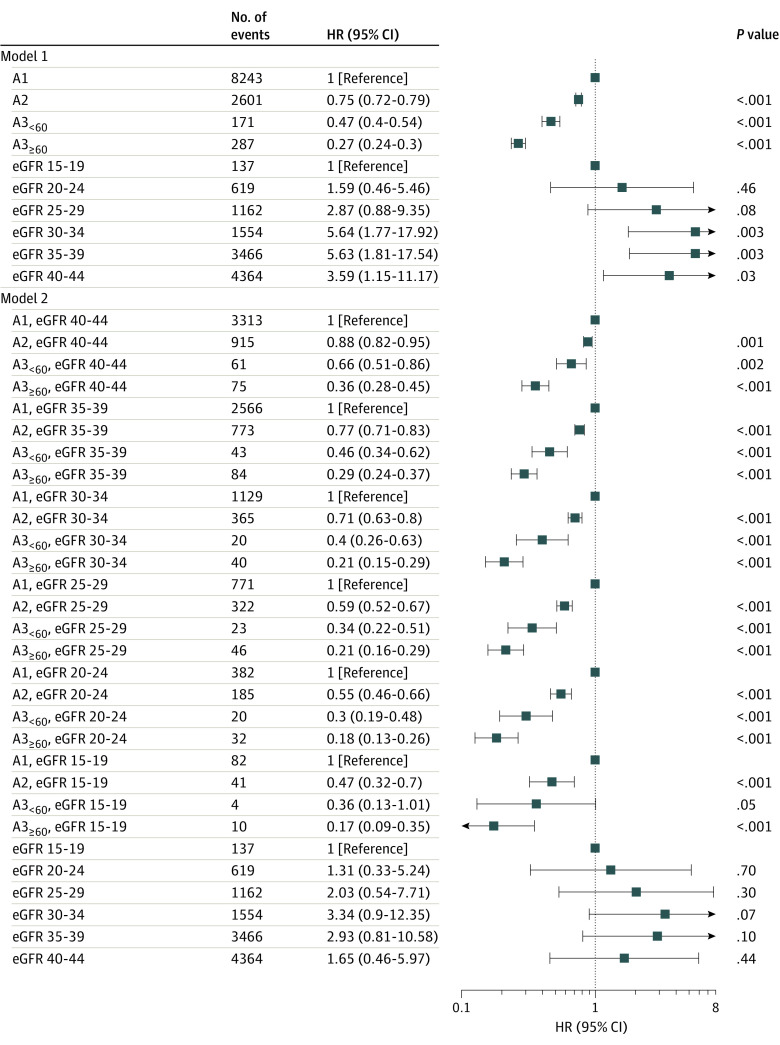
Main outcomes and measures: The main outcome was time to the earliest of CKD regression or progression (sustained change in CKD stage for >3 months and ≥25% increase or decrease in eGFR from baseline or kidney failure, respectively), death, or censoring (outmigration or study end date: March 31, 2019). Cumulative incidence functions were used to estimate absolute risks, and cause-specific Cox models were used to assess the association between albuminuria and CKD regression, accounting for age, sex, eGFR, comorbidities, and health services use indicators.

Results: Of 58 004 people with moderate to severe CKD (mean [SD] age, 77 [12] years; 31 725 [55%] women), 35 360 had A1 albuminuria (61%), 15 597 had A2 albuminuria (27%), 1527 had A3<60 albuminuria (3%), and 5520 had A3≥60 albuminuria (10%). Five-year probability of regression was highest with A1 (22.6%), followed by A2 (16.5%), and A3<60 (11.6%) and lowest with A3≥60 (5.3%). Using A1 albuminuria as the reference group, the hazard of regression was highest for A2 (hazard ratio [HR], 0.75; 95% CI, 0.72-0.79), then A3<60 (HR, 0.47; 95% CI, 0.40-0.54), and lowest for A3≥60 (HR, 0.27; 95% CI, 0.24-0.30).

Conclusions and relevance: In this cohort study of people with moderate to severe CKD, albuminuria levels were inversely associated with CKD regression. These findings extend the key prognostic role of albuminuria, offering novel opportunities to discuss both favorable and adverse outcomes in people with CKD and inform CKD management.


Conflict of interest statement

Conflict of Interest Disclosures: Dr Quinn reported having a patent for a dialysis measurement analysis and reporting data system issued. No other disclosures were reported.

Figures

Figure 1.
Figure 1.. Outcome Probabilities at 5 Years From Study Entry by Category of Albuminuria
Outcome probabilities were estimated using cumulative incidence functions at 5 years after study entry by category of albuminuria. Progression represents chronic kidney disease (CKD) progression or kidney failure. Death refers to death without regression, progression, or kidney failure. Albuminuria was categorized according to albumin to creatinine ratio, with A1 indicating less than 3 mg/mmol; A2, 3 to 30 mg/mmol; A3<60, 30 to 60 mg/mmol; and A3≥60 60 mg/mmol or greater.
Figure 2.
Figure 2.. Outcome Probabilities at 5 Years From Study Entry by Category of Albuminuria Stratified by Estimated Glomerular Filtration Rate Among Patients Younger than 80 Years
Outcome probabilities were estimated using cumulative incidence functions at 5 years after study entry by category of albuminuria, stratified by category of estimated glomerular filtration rate and age. Progression represents chronic kidney disease (CKD) progression or kidney failure. Death refers to death without regression, progression, or kidney failure. Albuminuria was categorized according to albumin to creatinine ratio, with A1 indicating less than 3 mg/mmol; A2, 3 to 30 mg/mmol; A3<60, 30 to 60 mg/mmol; and A3≥60 60 mg/mmol or greater.
Figure 3.
Figure 3.. Outcome Probabilities at 5 Years From Study Entry by Category of Albuminuria Stratified by Estimated Glomerular Filtration Rate Among Patients Aged 80 Years and Older
Outcome probabilities were estimated using cumulative incidence functions at 5 years after study entry by category of albuminuria, stratified by category of estimated glomerular filtration rate and age. Progression represents chronic kidney disease (CKD) progression or kidney failure. Death refers to death without regression, progression, or kidney failure. Albuminuria was categorized according to albumin to creatinine ratio, with A1 indicating less than 3 mg/mmol; A2, 3 to 30 mg/mmol; A3<60, 30 to 60 mg/mmol; and A3≥60 60 mg/mmol or greater.
Figure 4.
Figure 4.. Association Between Albuminuria and Chronic Kidney Disease (CKD) Regression
Model 1 does not include the interaction between albuminuria and estimated glomerular filtration rate (eGFR) (eTable 3 in the Supplement). Model 2 includes the same covariates as Model 1 with the additional interaction between albuminuria and index eGFR category (eTable 4 in the Supplement). Model 2 shows the linear combinations of the coefficients (epidemiological formulation) instead of differences in log-hazard ratios (HRs) (statistical interaction formulation; eTable 4 in the Supplement) to summarize the association between eGFR and CKD regression across categories of albuminuria. An alternative formulation of model 2 that summarizes the association between eGFR and CKD regression across categories of albuminuria is presented in eFigure 4 in the Supplement.

References

    1. Xie Y, Bowe B, Mokdad AH, et al. . Analysis of the Global Burden of Disease study highlights the global, regional, and national trends of chronic kidney disease epidemiology from 1990 to 2016. Kidney Int. 2018;94(3):567-581. doi:10.1016/j.kint.2018.04.011 - DOI - PubMed
    1. Hemmelgarn BR, Manns BJ, Lloyd A, et al. ; Alberta Kidney Disease Network . Relation between kidney function, proteinuria, and adverse outcomes. JAMA. 2010;303(5):423-429. doi:10.1001/jama.2010.39 - DOI - PubMed
    1. Tonelli M, Muntner P, Lloyd A, et al. ; Alberta Kidney Disease Network . Using proteinuria and estimated glomerular filtration rate to classify risk in patients with chronic kidney disease: a cohort study. Ann Intern Med. 2011;154(1):12-21. doi:10.7326/0003-4819-154-1-201101040-00003 - DOI - PubMed
    1. Liu P, Quinn RR, Lam NN, et al. . Progression and regression of chronic kidney disease by age among adults in a population-based cohort in Alberta, Canada. JAMA Netw Open. 2021;4(6):e2112828. doi:10.1001/jamanetworkopen.2021.12828 - DOI - PMC - PubMed
    1. Borrelli S, Leonardis D, Minutolo R, et al. . Epidemiology of CKD regression in patients under nephrology care. PLoS One. 2015;10(10):e0140138. doi:10.1371/journal.pone.0140138 - DOI - PMC - PubMed

Publication types