. 2022 Sep 8;7(17):e161370.
doi: 10.1172/jci.insight.161370.

Patterns of structural variation define prostate cancer across disease states

Affiliations

Patterns of structural variation define prostate cancer across disease states

Meng Zhou et al. JCI Insight. .

Abstract

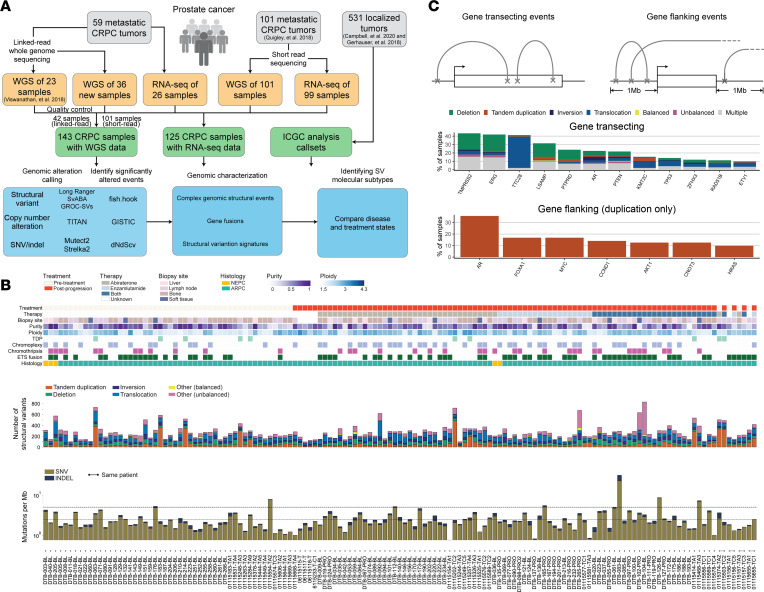
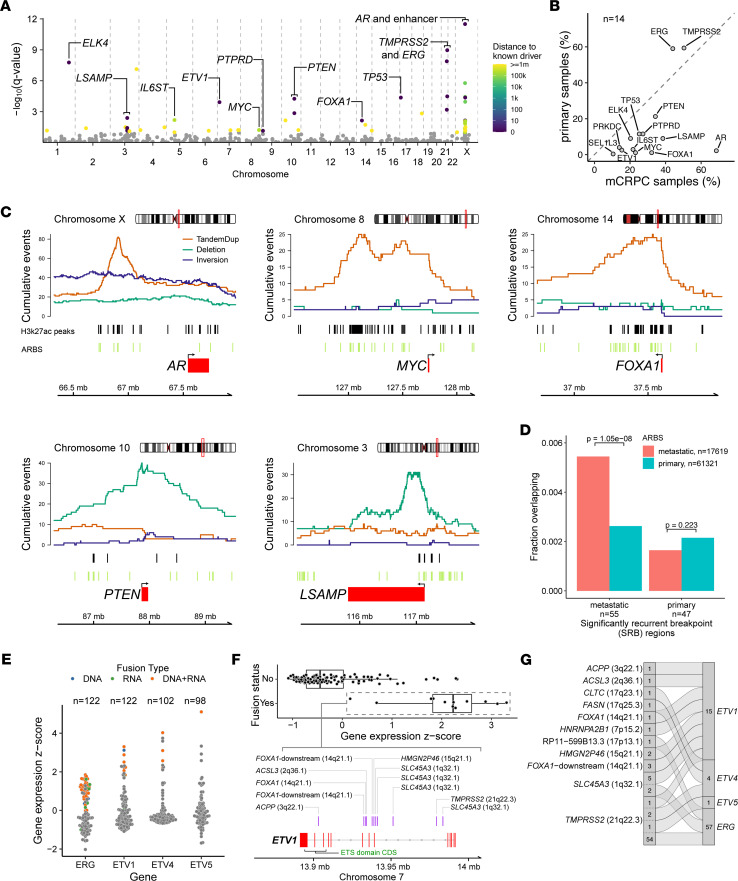
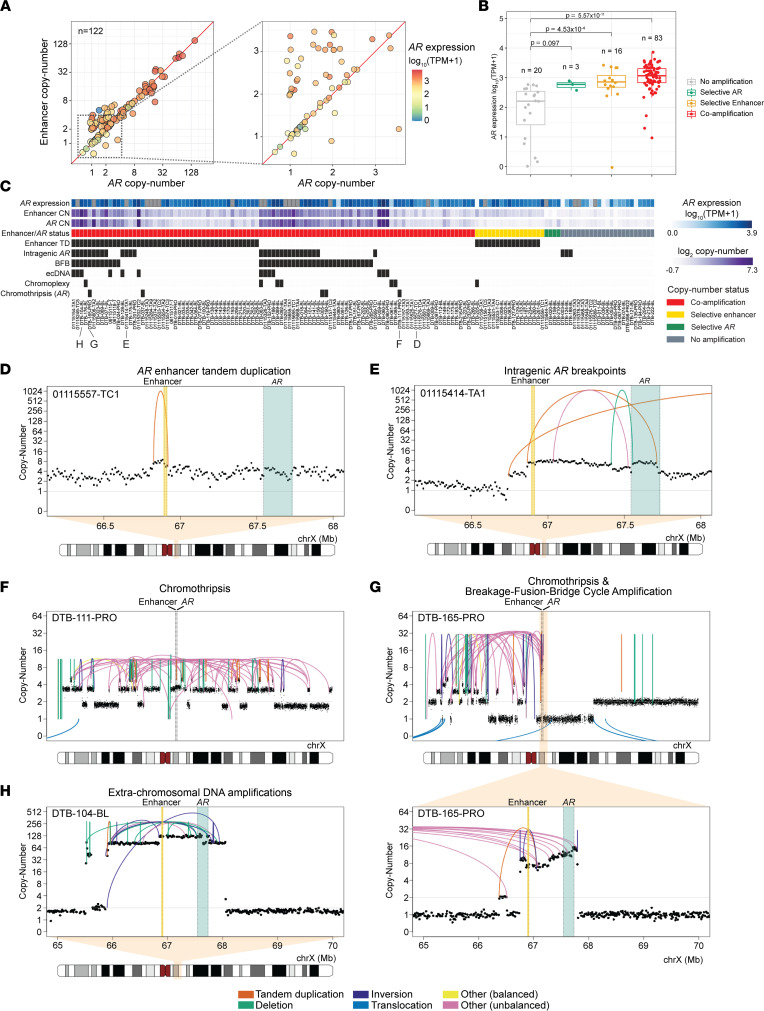
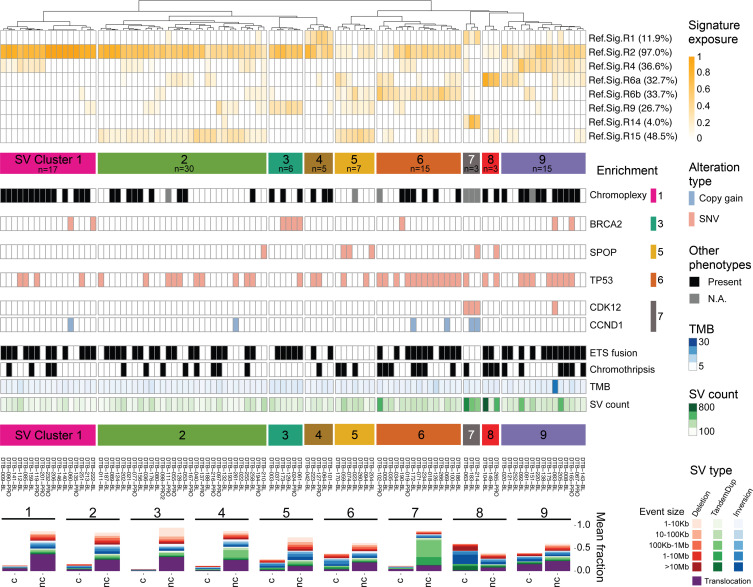
The complex genomic landscape of prostate cancer evolves across disease states under therapeutic pressure directed toward inhibiting androgen receptor (AR) signaling. While significantly altered genes in prostate cancer have been extensively defined, there have been fewer systematic analyses of how structural variation shapes the genomic landscape of this disease across disease states. We uniformly characterized structural alterations across 531 localized and 143 metastatic prostate cancers profiled by whole genome sequencing, 125 metastatic samples of which were also profiled via whole transcriptome sequencing. We observed distinct significantly recurrent breakpoints in localized and metastatic castration-resistant prostate cancers (mCRPC), with pervasive alterations in noncoding regions flanking the AR, MYC, FOXA1, and LSAMP genes enriched in mCRPC and TMPRSS2-ERG rearrangements enriched in localized prostate cancer. We defined 9 subclasses of mCRPC based on signatures of structural variation, each associated with distinct genetic features and clinical outcomes. Our results comprehensively define patterns of structural variation in prostate cancer and identify clinically actionable subgroups based on whole genome profiling.

Keywords: Bioinformatics; Genetic variation; Genetics; Oncology; Prostate cancer.


Figures

Figure 1
Figure 1. Study overview of prostate cancer across disease stages and the genomic landscape of mCRPC.
(A) Workflow of study and data analysis. Tumor specimens (gray) from both primary prostate cancer and mCRPC were included in this study. Linked-read and short-read WGS and RNA-Seq data sets were either generated for this study or reanalyzed from prior studies (9, 33). An overview of the genomic alteration and characterization analysis is shown. (B) Clinical annotations and somatic alterations for 143 patient samples in the pooled mCRPC cohort. Samples are ordered by treatment type; the 4 patients with pretreatment and post-progression pairs are placed at the right. Top: Clinical and sample information and genomic pattern classifications, including neuroendocrine prostate cancer (NEPC) and androgen receptor pathway active prostate cancer (ARPC). Middle: Distribution of genomic rearrangement types in individual samples. Bottom: Mutational burden for SNVs and indels computed as number of mutations per mega–base pair (Mb). Y axis shown in logarithmic scale. Threshold lines indicate mutational burden at 2.5 and 5 mutations per Mb. (C) Genomic rearrangement alteration profiles of key mCRPC genes. Top: Events were categorized into gene transecting or gene flanking based on the overlap of breakpoints with the gene body and flanking 1 Mb of either the transcription start site or the termination site of the gene. Only 159 genes reported and known to be involved in prostate cancer were considered in this analysis (Supplemental Table 1, G and H). Middle: Frequency and distribution of rearrangement types for gene transecting events; genes with ≥10% frequency are shown. Gene transecting events were prioritized over flanking events during annotation. The category “Multiple” represents gene-sample pairs carrying more than 1 type of rearrangement event. Bottom: Frequency of gene flanking events by tandem duplication; genes with ≥10% are shown.
Figure 2
Figure 2. Genome-wide analysis of genomic rearrangements in mCRPC and comparisons with localized prostate cancer.
(A) Analysis of SRBs identified regions of rearrangement hotspots, genome-wide, using a gamma-Poisson regression model. Each dot corresponds to a 100 kb bin (n = 26,663 total bins). Statistically significant SRB bins with FDR (Benjamini-Hochberg) q value ≤ 0.1 (n = 55) are colored based on the distance to the nearest known prostate cancer driver gene, within 1 Mb. (B) Comparison of SV alteration frequency in mCRPC (n = 143) versus primary localized prostate cancer (n = 278). The union set of genes (n = 14) within 1 Mb of SRB hotspot regions in mCRPC and localized prostate cancer cohorts was included in the comparison. (C) Patterns of rearrangements at the loci of driver genes identified at SRB regions in mCRPC cohort of 143 tumors. Cumulative counts of intrachromosomal SV events (tandem duplications [TandemDup], deletions, and inversions) were computed based on the breakpoints and span of the events. Interchromosomal translocations are not shown. Genome coordinates based on hg38 build. (D) Overlap of ARBS within SRB hotspots of mCRPC (55 regions) and primary localized prostate (47 regions) cohorts. χ2 test of independence P values is shown. (E) Fusion status and expression of selected genes in the ETS transcription factor gene family in the mCRPC cohort with WGS and RNA-Seq data. Fusion type was defined as the data evidence that supported the event: DNA only, corresponds to WGS; RNA only, corresponds to RNA-Seq; DNA+RNA, corresponds to support from both WGS and RNA-Seq. Each dot represents a tumor sample and is colored based on fusion type of each sample; gray indicates no evidence of fusion event. (F) Fusion profile of ETV1. DNA rearrangement breakpoints supporting the fusion (purple bars) are indicated with the corresponding fusion partners. (G) Summary of fusion partners for selected genes in ETS transcription factor gene family in mCRPC cohort. Fusion events and partners are indicated by flow connections. Total counts of individual fusion events and partners across the cohort are shown.
Figure 3
Figure 3. Modes of AR activation in mCRPC.
(A) Copy number of AR gene and its enhancer (~624 kb upstream) for mCRPC cohort samples after adjustment by tumor purity and sample ploidy normalization. Data shown for samples with available AR gene expression data. Left: Copy number of AR and its enhancer is shown in log2 scale, colored based on AR gene expression level (transcripts per million [TPM]). Right: Excerpt of figure highlighting AR expression for samples with lower copy number values. (B) AR expression for AR locus copy number status for 122 samples with available AR gene expression data. ANCOVA test was performed to account for tumor purity and ploidy as covariates. Tukey’s HSD P values for pairwise comparisons between groups with AR locus amplification status and groups with no amplification. (C) Patterns of rearrangements involving the AR locus in 143 mCRPC samples. Presence of specific alteration events and complex rearrangements (black) was predicted automatically and manually curated. AR gene expression shown (blue shades) for the same samples in B; samples with no available expression data are indicated in gray. (DH) Representative examples of each category. Complex and simple rearrangement patterns involving the AR locus, including focal duplication events on AR enhancer (D), intragenic amplification event leading to a breakpoint within AR between exons 4 and 5 (E), chromosome-level chromothripsis events involving AR and enhancer (F), arm-level chromothripsis coinciding with AR amplification by break-fusion-break cycle (G), and extrachromosomal DNA amplicon including AR and enhancer (H). AR gene boundary (green) and its enhancer (yellow) are shown. Concave arcs, intrachromosomal SV events; convex arcs, interchromosomal SV events. Copy number values represent 10 kb bins and have been tumor purity corrected.
Figure 4
Figure 4. Clustering of mCRPC SV signatures.
SV signature analysis and hierarchical clustering identify 9 distinct molecular groups in the mCRPC cohort of 101 samples sequenced with standard short reads. Top: Dendrogram of the clustering of SV signature exposure. The prevalence of each signature was computed based on having ≥0.05 exposure (proportion of SVs). Middle: Enrichment of altered prostate cancer drivers. Enriched alterations in clusters 1, 3, 5, 6, and 7 are shown based on statistical significance by χ2 test. Bottom: Composition of SV types and sizes for each SV cluster, separated by non-clustered (nc) and clustered (c) SV events. The number of samples per cluster is indicated in the corresponding cluster label.

References

    1. Leinonen R, et al. The sequence read archive. Nucleic Acids Res. 2011;39(suppl 1):19–21. - PMC - PubMed
    1. de Bono JS, et al. Abiraterone and increased survival in metastatic prostate cancer. N Engl J Med. 2011;364(21):1995–2005. doi: 10.1056/NEJMoa1014618. - DOI - PMC - PubMed
    1. Scher HI, et al. Increased survival with enzalutamide in prostate cancer after chemotherapy. N Engl J Med. 2012;367(13):1187–1197. doi: 10.1056/NEJMoa1207506. - DOI - PubMed
    1. Abida W, et al. Analysis of the prevalence of microsatellite instability in prostate cancer and response to immune checkpoint blockade. JAMA Oncol. 2019;5(4):471–478. doi: 10.1001/jamaoncol.2018.5801. - DOI - PMC - PubMed
    1. Abida W, et al. Rucaparib in men with metastatic castration-resistant prostate cancer harboring a BRCA1 or BRCA2 gene alteration. J Clin Oncol. 2020;38(32):3763–3772. doi: 10.1200/JCO.20.01035. - DOI - PMC - PubMed

Publication types