. 2022 Sep 8;7(17):e159910.
doi: 10.1172/jci.insight.159910.

CCR9 axis inhibition enhances hepatic migration of plasmacytoid DCs and protects against liver injury

Affiliations

CCR9 axis inhibition enhances hepatic migration of plasmacytoid DCs and protects against liver injury

Yuzo Koda et al. JCI Insight. .

Abstract

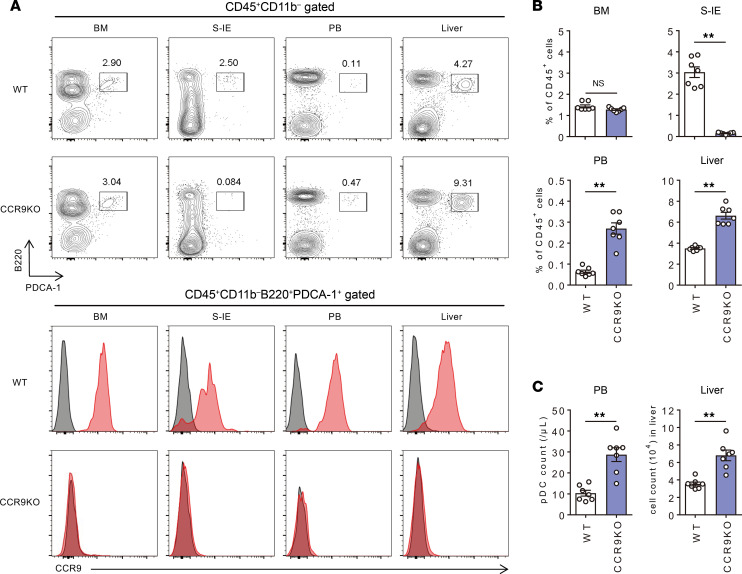
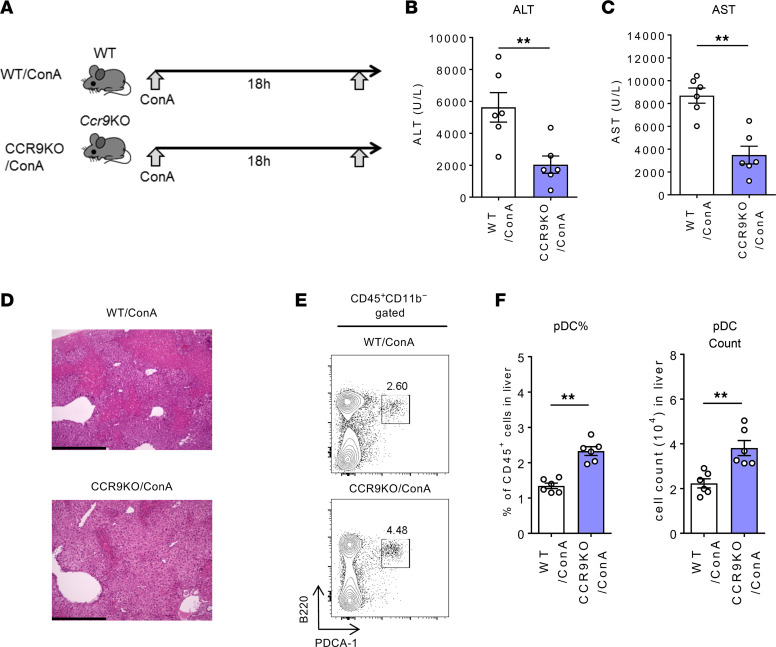
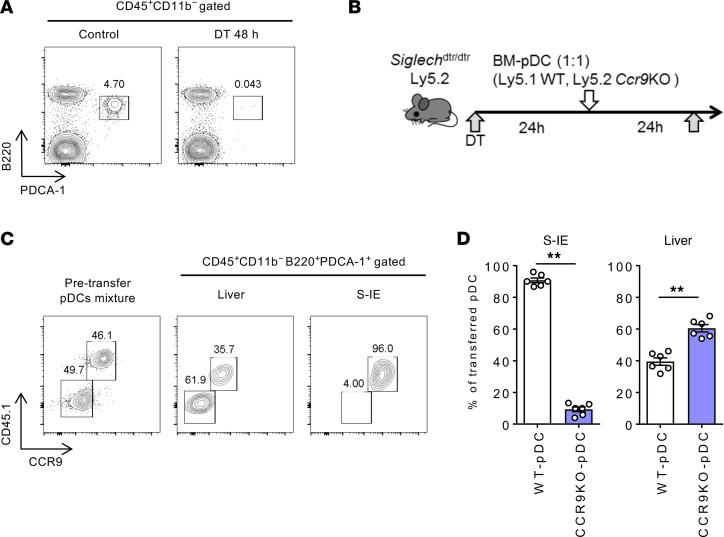
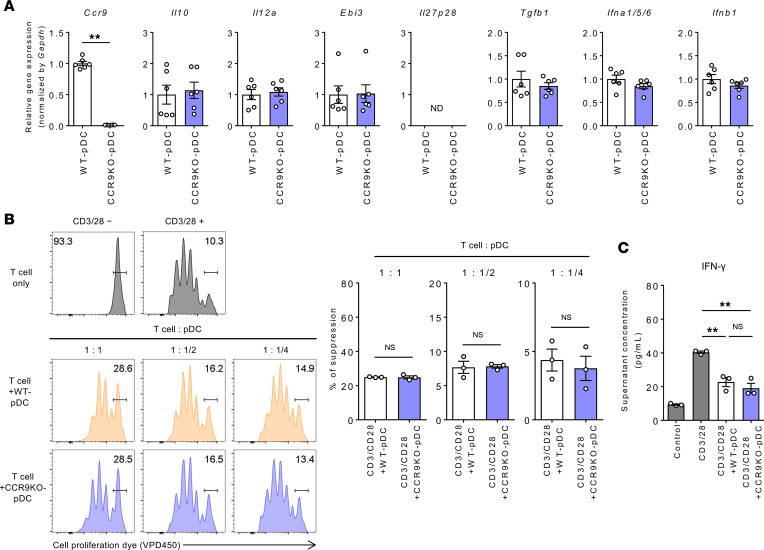
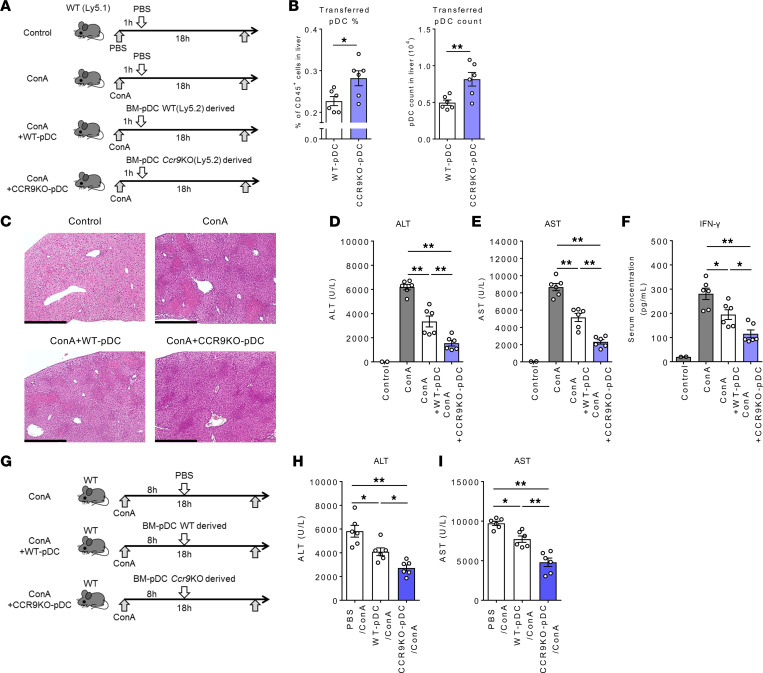
Plasmacytoid dendritic cells (pDCs) perform dual proinflammatory and immunosuppressive roles. We recently reported the potential of pDC therapy for treatment of intractable acute liver failure. However, establishment of efficient methods to deliver pDCs to the liver is essential for future clinical therapeutic applications. The present study demonstrates a higher abundance of liver and peripheral blood pDCs in mice lacking C-C motif chemokine receptor 9 (CCR9), a pDC gut-homing receptor, than in WT mice. Adoptive transfer of Ccr9-/- pDCs resulted in a higher efficiency of migration to the liver than WT pDCs did, while WT pDCs migrated efficiently to the original target organ, the small intestine. Further, Ccr9-/- pDCs consistently migrated efficiently to livers with concanavalin A-induced inflammation, and exerted a more effective immunosuppressive effect, resulting in better protection against acute liver inflammation than that demonstrated by WT pDCs. These findings highlight the therapeutic potential of the manipulation of the CCR9 axis as an approach to improve migration of immunosuppressive pDCs to the liver in order to exploit their beneficial effects in acute liver disease.

Keywords: Chemokines; Dendritic cells; Hepatitis; Hepatology; Immunology.


Conflict of interest statement

Conflict of interest: The authors have declared that no conflict of interest exists.

Figures

Figure 1
Figure 1. CCR9 deficiency induces hepatic pDC accumulation under steady-state conditions.
(A) Top: Representative B220 and PDCA-1 staining of CD45+CD11b-gated BM, S-IE, and PB mononuclear cells (MNCs) in male WT or Ccr9–/– mice with C57BL/6 background. Bottom: Representative histograms showing CCR9 expression in hepatic CD45+CD11bB220+PDCA-1+ pDCs. (B) Mean percentages of pDCs in the CD45+ MNC population from BM, S-IE, PB, and livers of WT or Ccr9–/– mice. Data represent the mean ± SEM (n = 7 per group). (C) Absolute numbers of pDCs in PB and liver. Data represent the mean ± SEM (n = 7 per group). **P < 0.01, Student’s t test. Data are combinations of 2 independent experiments from over 5 independent experiments (B and C).
Figure 2
Figure 2. CCR9 deficiency induces hepatic pDC accumulation in ConA-induced inflammation.
(A) Study design. WT or Ccr9–/– mice were injected i.v. with ConA (15 mg/kg) or PBS. All mice were sacrificed and analyzed 18 hours after ConA injection. (B) Serum alanine aminotransferase (ALT) levels. (C) Serum aspartate aminotransferase (AST) levels. (D) Representative photomicrographs of H&E-stained liver sections. Scale bars: 500 μm. (E) Representative B220 and PDCA-1 staining of CD45+CD11b-gated hepatic MNCs. (F) Mean percentages (left) and numbers (right) of hepatic pDCs in ConA-induced hepatitis. Data represent the mean ± SEM (n = 6 per group). **P < 0.01, Student’s t test. Data are combinations of 2 independent experiments (B, C, and F).
Figure 3
Figure 3. RNA-Seq analysis of hepatic pDCs derived from WT or Ccr9–/– mice.
Gene expression profiling of the liver (WT or Ccr9–/– mice), BM (WT mice), and SI-E (WT mice) pDCs was performed using RNA-Seq analysis (n = 3). CD45+CD11bB220+PDCA-1+Siglec-H+ cells were isolated from each organ. (A) Heatmap of pDC markers (top) and effector genes (bottom) of pDCs from each tissue. (B) Principal component analysis (PCA) plot of the top 2,000 genes. (C) Pearson’s correlation matrix using the top 75% of genes. (D) GO enrichment analysis of hepatic pDCs (WT or Ccr9–/–) and IE pDCs (WT) in comparison with BM pDCs (WT). Columns show enriched GO terms from upregulated genes (left 3 columns) and downregulated genes (right 3 columns).
Figure 4
Figure 4. Adoptive transfer of Ccr9–/– pDCs results in efficient migration of pDCs to the liver under steady-state conditions.
(A) WT or Siglechdtr/dtr mice were treated with diphtheria toxin (DT; 1 μg/mouse) 48 hours before sacrifice. Representative B220 and PDCA-1 staining of CD45+CD11b liver MNCs of WT (left) or Siglechdtr/dtr (right) mice. (B) Study design. Siglechdtr/dtr mice were treated with DT (1 μg/mouse), followed by i.v. inoculation with a cell suspension (2 × 10⁶ cells/200 μL PBS) of FLT3L-proliferated pDCs derived from WT (Ly5.1) mice and Ccr9–/– (Ly5.2) mice 24 hours later. All mice were sacrificed and analyzed 24 hours after pDC inoculation. (C) Representative CD45.1 and CCR9 staining of the pDC mixture prior to the treatment (left) and CD45+CD11b-gated liver and S-IE MNCs after transplantation (middle and right). (D) Mean percentages of WT (Ly5.1)/Ccr9–/– (Ly5.2) pDCs in the S-IE and liver after transplantation. Data represent the mean ± SEM (n = 6 per group). **P < 0.01, Student’s t test. Data are combinations of 2 independent experiments (D).
Figure 5
Figure 5. CCR9 deficiency does not influence the pDC immunosuppressive function.
(A) Expression of various genes in FLT3L-proliferated pDCs derived from WT or Ccr9–/– mice. Data represent the mean ± SEM (n = 6 per group). **P < 0.01, Student’s t test. (B) FLT3L-proliferated pDCs derived from WT or Ccr9–/– mice (1 × 10⁵, 0.5 × 10⁵, or 0.25 × 10⁵ cells per well) were cocultured with VPD450-stained Teffs (1 × 10⁵ cells per well), followed by stimulation with CD3/CD28 microbeads for 4 days. Representative histograms of Teffs (left) and suppression rate of Teff proliferation by coculture with the indicated pDCs (right). Data represent the mean ± SEM (n = 3 per group). (C) IFN-γ concentration in the culture supernatant. Data represent the mean ± SEM (n = 3 per group). **P < 0.01, Student’s t test (A and B) or ANOVA with Tukey’s multiple-comparison post hoc test (C). Data are combinations of 2 independent experiments (A).
Figure 6
Figure 6. Adoptive transfer of Ccr9–/– pDCs improves protection against ConA-induced liver inflammation.
(A) Study design. WT (Ly5.2) mice were injected i.v. with ConA (15 mg/kg) or PBS. An hour later, the mice were injected i.v. with FLT3L-proliferated BM pDCs from WT or Ccr9–/– mice (2 × 10⁶ cells/200 μL PBS) or 200 μL PBS alone. All mice were sacrificed and analyzed 18 hours after ConA injection. (B) Mean percentages (left) and absolute numbers (right) of transferred BM pDCs (CD45.1) in the liver during ConA-induced hepatitis. (C) Representative photomicrographs of H&E-stained liver sections. Scale bars: 500 μm. (DF) Serum ALT (D), AST (E), and IFN-γ (F) levels. (G) Study design. WT mice were injected i.v. with ConA (15 mg/kg) or PBS. Eight hours later, the mice were injected i.v. with FLT3L-proliferated BM pDCs from WT or Ccr9–/– mice (2 × 10⁶ cells/200 μL PBS) or 200 μL PBS alone. All mice were sacrificed and analyzed 18 hours after ConA injection. (H and I) Serum ALT (H) and AST (I) levels. Data represent the mean ± SEM (n = 6 per group). *P < 0.05, **P < 0.01, Student’s t test (B) or ANOVA with Tukey’s multiple-comparison post hoc test (DF, H, and I). Data are combinations of 2 independent experiments (B, DF, H, and I).

Similar articles

Cited by

References

    1. Thomson AW, Knolle PA. Antigen-presenting cell function in the tolerogenic liver environment. Nat Rev Immunol. 2010;10(11):753–766. doi: 10.1038/nri2858. - DOI - PubMed
    1. Zheng M, Tian Z. Liver-mediated adaptive immune tolerance. Front Immunol. 2019;10:2525. doi: 10.3389/fimmu.2019.02525. - DOI - PMC - PubMed
    1. Iwasaki A, Medzhitov R. Control of adaptive immunity by the innate immune system. Nat Immunol. 2015;16(4):343–353. doi: 10.1038/ni.3123. - DOI - PMC - PubMed
    1. Marra F, Tacke F. Roles for chemokines in liver disease. Gastroenterology. 2014;147(3):577–594. doi: 10.1053/j.gastro.2014.06.043. - DOI - PubMed
    1. Heymann F, Tacke F. Immunology in the liver—from homeostasis to disease. Nat Rev Gastroenterol Hepatol. 2016;13(2):88–110. doi: 10.1038/nrgastro.2015.200. - DOI - PubMed

Publication types