. 2022 Aug 9;15(746):eabn2694.
doi: 10.1126/scisignal.abn2694. Epub 2022 Aug 9.

Functional and biological heterogeneity of KRASQ61 mutations

Affiliations

Functional and biological heterogeneity of KRASQ61 mutations

Minh V Huynh et al. Sci Signal. .

Abstract

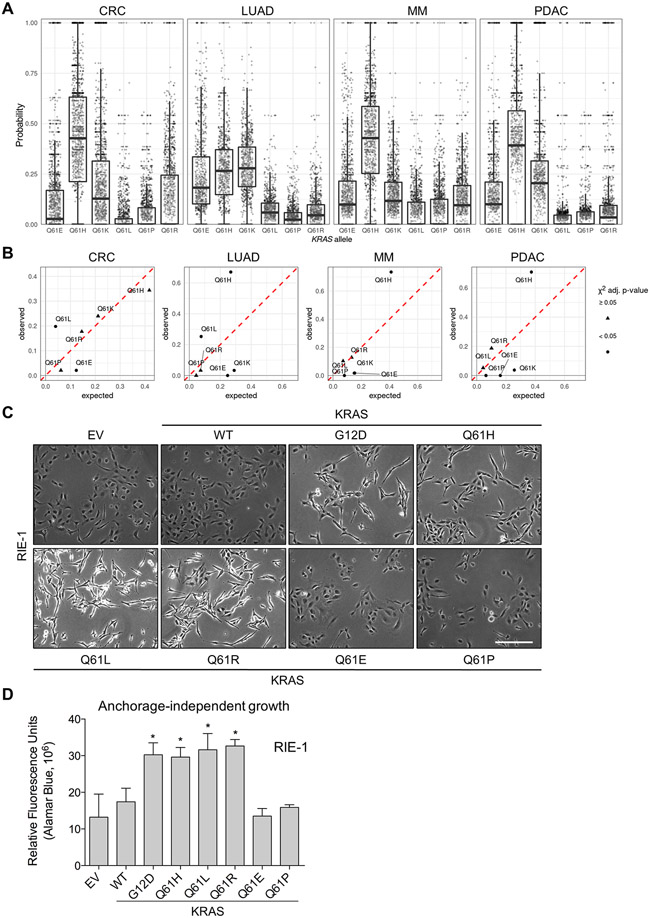
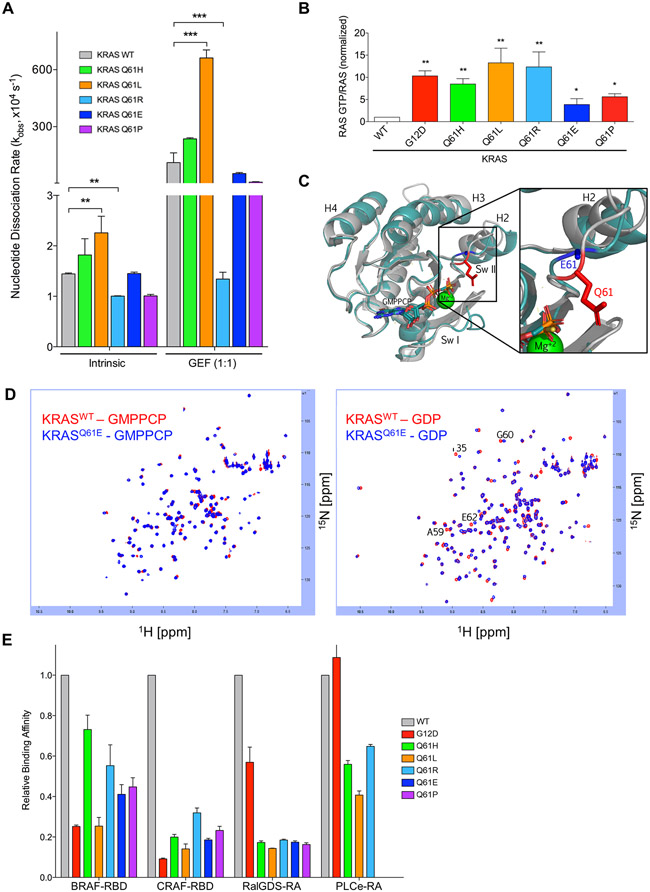
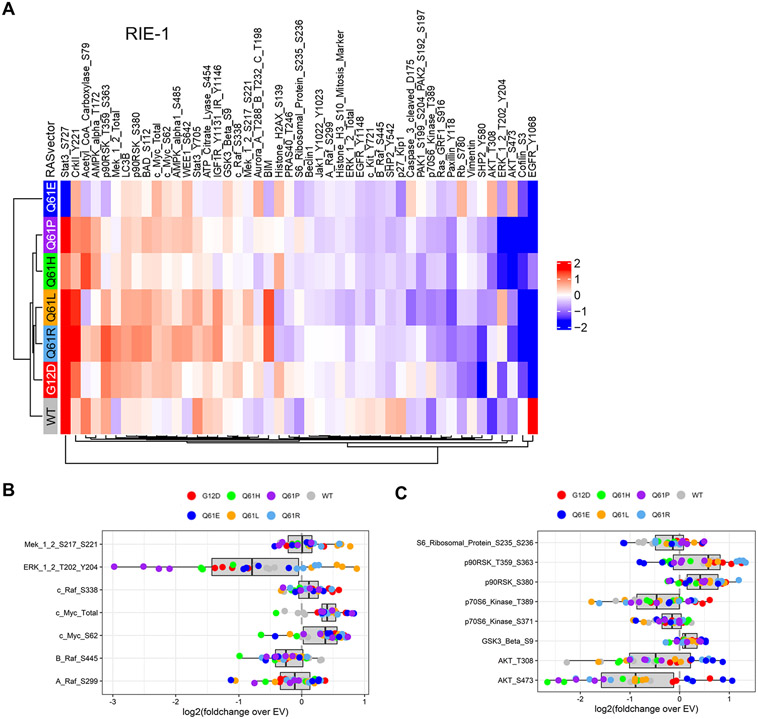
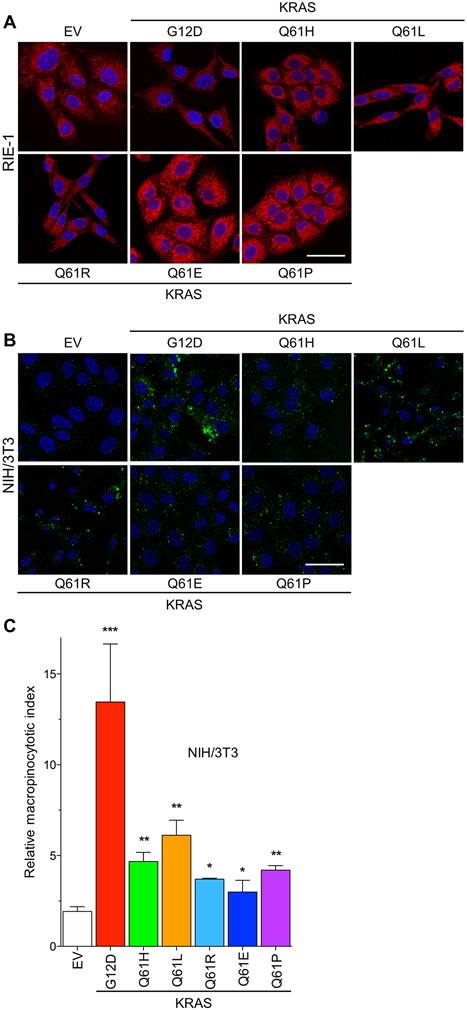
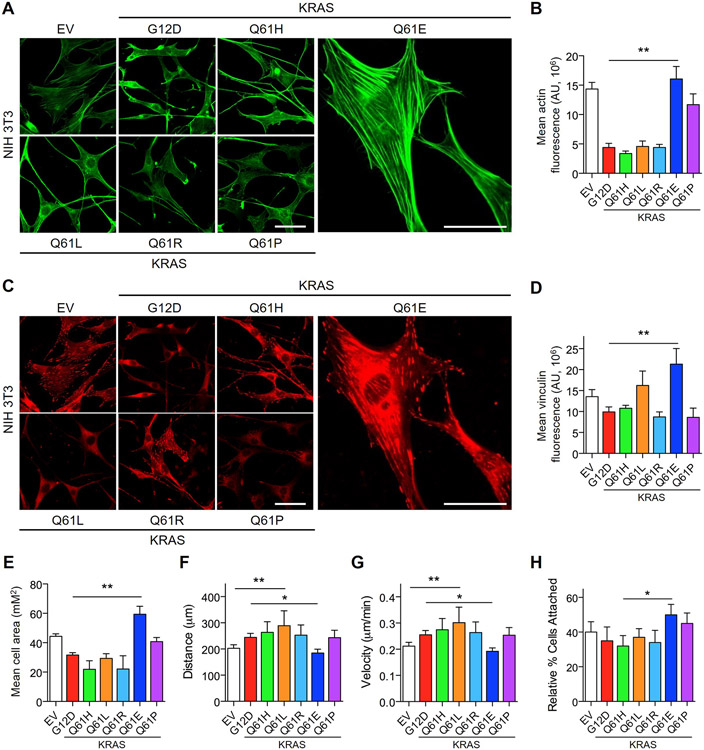
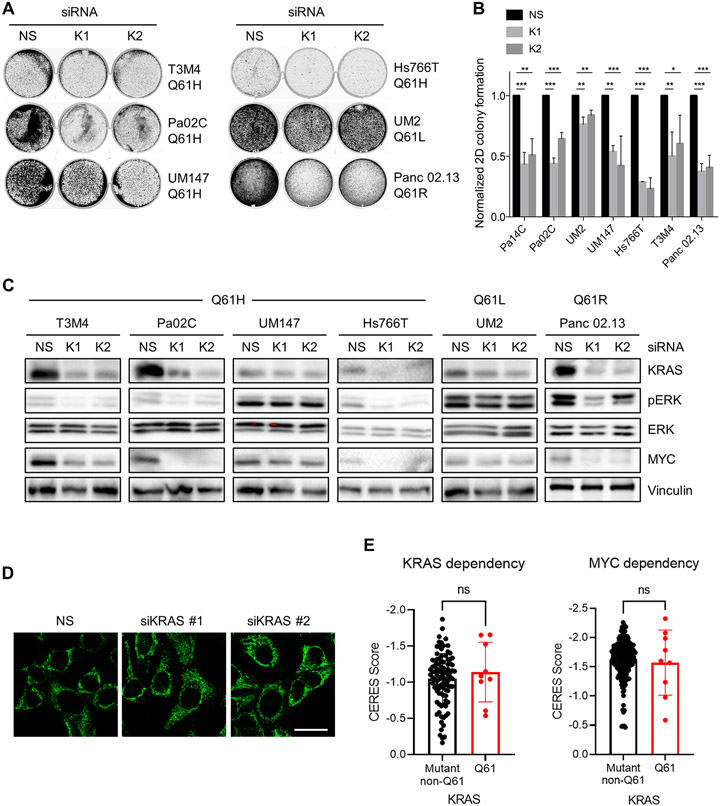
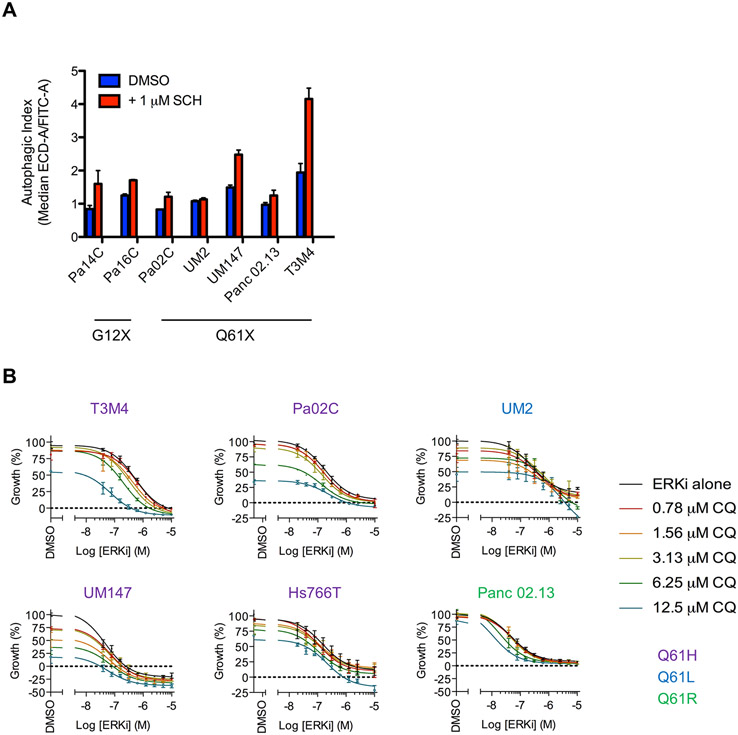
Missense mutations at the three hotspots in the guanosine triphosphatase (GTPase) RAS-Gly12, Gly13, and Gln61 (commonly known as G12, G13, and Q61, respectively)-occur differentially among the three RAS isoforms. Q61 mutations in KRAS are infrequent and differ markedly in occurrence. Q61H is the predominant mutant (at 57%), followed by Q61R/L/K (collectively 40%), and Q61P and Q61E are the rarest (2 and 1%, respectively). Probability analysis suggested that mutational susceptibility to different DNA base changes cannot account for this distribution. Therefore, we investigated whether these frequencies might be explained by differences in the biochemical, structural, and biological properties of KRASQ61 mutants. Expression of KRASQ61 mutants in NIH 3T3 fibroblasts and RIE-1 epithelial cells caused various alterations in morphology, growth transformation, effector signaling, and metabolism. The relatively rare KRASQ61E mutant stimulated actin stress fiber formation, a phenotype distinct from that of KRASQ61H/R/L/P, which disrupted actin cytoskeletal organization. The crystal structure of KRASQ61E was unexpectedly similar to that of wild-type KRAS, a potential basis for its weak oncogenicity. KRASQ61H/L/R-mutant pancreatic ductal adenocarcinoma (PDAC) cell lines exhibited KRAS-dependent growth and, as observed with KRASG12-mutant PDAC, were susceptible to concurrent inhibition of ERK-MAPK signaling and of autophagy. Our results uncover phenotypic heterogeneity among KRASQ61 mutants and support the potential utility of therapeutic strategies that target KRASQ61 mutant-specific signaling and cellular output.


Figures

Fig. 1.
Fig. 1.. The probability of observing each possible KRASQ61 mutation in tumor samples.
(A) The probability of observing each possible mutation from a single-nucleotide base substitution (SBS) at KRAS Q61 in individual tumor samples. Each point represents a tumor sample and each tumor sample of a given cancer type appears in the box-plot of each possible KRAS mutation (meaning a single tumor sample is represented by a point in each possible KRAS mutation). (B) The expected vs. observed frequencies of KRASQ61 mutations. The frequencies of all possible mutations to codon 61 of KRAS by SBS as predicted by the mutational signatures against the observed frequencies. A χ-squared test was used to detect if there was a difference between the predicted and observed frequency for each allele; triangles indicate where adjusted P ≥ 0.05; circles, where P < 0.05. (C) Representative brightfield images of RIE-1 cells ectopically expressing different KRAS mutations. Images were collected at 10x magnification 3 days after antibiotic selection. χ-squared test and P-values were adjusted for multiple hypothesis testing using the Benjamini–Hochberg method (14)). Scale bar, 500 μm. (D) Anchorage-independent colony formation of RIE-1 cells expressing KRASQ61 mutants. Cells were cultured for seven days in soft agar and developed using AlamarBlue reagent. Representative data is shown and quantified as mean ± S.E.M. from three independent experiments. * P ≤ 0.05 by one-way ANOVA.
Fig. 2.
Fig. 2.. KRASQ61 proteins show distinct biochemical phenotypes.
(A) Quantification of nucleotide exchange rates of recombinant KRASQ61 mutant proteins (amino acids 2-169) in the absence (left) and in the presence of equimolar concentration of the catalytic domain of RASGRP1. Data are mean ± S.E.M. from three or more independent experiments. ** P ≤ 0.01 and *** P ≤ 0.001 by one-way ANOVA. (B) Quantification of pulldown assay for KRAS-GTP levels in RIE-1 cells using CRAF-RBD shown as mean ± S.E.M. of three independent experiments. * P ≤ 0.05 **, P ≤ 0.01, and *** P ≤ 0.001 by one-way ANOVA. Error bars, (C) Ribbon diagram showing X-ray structural overlays of KRASQ61E (teal, 7LZ5) with KRASWT (silver, 4DSO). Proteins were crystallized bound to non-hydrolyzable GMPPCP. The Q61 sidechain is indicated in red and the E61 sidechain is indicated in blue. (D) KRASQ61E NMR chemical shifts resemble KRASWT. 1H-15N HSQC NMR overlay of KRASWT (red) and KRASQ61E (blue) in the GMPPCP-bound (left) and GDP-bound (right) states. Data are representative of two biological replicates. (E) Relative binding affinities of KRASQ61 proteins to select RAS binding (RBD) and association (RA) domains. Values were normalized to KRASWT for each indicated effector. Data are averages from three or more independent experiments.
Fig. 3.
Fig. 3.. RIE-1 cells expressing KRASQ61 mutants demonstrate heterogeneous signaling patterns.
(A) Reverse phase protein array (RPPA) pathway activation analysis of RIE-1 cells. Cell lysates were stained with either phospho-specific (site indicated) or total protein antibodies. Heat map represents four biological replicates for each mutant. RPPA data were log2 transformed and medians are presented normalized to EV RIE-1 cells. Phospho- or total protein levels were arranged by hierarchical clustering. Red, increased signal; blue, decreased signal. (B and C) Box plots of ERK MAPK and PI3K-associated signaling changes from RPPA analysis. Shown are individual replicates for indicated KRAS samples normalized to the EV condition.
Fig. 4.
Fig. 4.. KRASQ61 mutants drive distinct metabolic phenotypes.
(A) Representative images of mitochondrial staining of RIE-1 cells expressing KRASQ61 mutants. Red, Mitotracker Red; blue, DAPI. Scale bar, 50 μm. (B) Representative images of FITC-dextran-labeled macropinosomes of NIH/3T3 cells expressing KRASQ61 mutants (green, FITC-Dextran; blue, DAPI). (C) Quantification of macropinocytosis in NIH/3T3 cells stably expressing KRASWT and mutants. Data are representative and, where quantified, mean ± S.E.M. from three independent experiments. * P ≤ 0.05, ** P ≤ 0.01, and *** P ≤ 0.001 by one-way ANOVA.
Fig. 5.
Fig. 5.. KRASQ61E induces unique effects on the actin cytoskeleton and cell motility.
(A and B) Representative immunofluorescence images of F-actin stained with phalloidin (A, green) and corresponding quantification of normalized F-actin signal (B) in NIH/3T3 cells ectopically expressing KRASG12D, KRASQ61H or KRASQ61E. Cells were plated on glass coverslips coated with 10 μg/mL fibronectin. Scale bar, 50 μm. Data are representative of >20 cells per condition and quantified as mean ± S.E.M. from three independent experiments. ** P ≤ 0.01 by t-test. (C and D) Representative immunofluorescence images of the focal adhesion marker vinculin (C, in red) and corresponding quantification of normalized vinculin signal (D) of NIH/3T3 cells expressing KRASWT or mutant proteins. Scale bar, 50 μm. Data are representative of > 20 cells per condition and shown as mean ± S.E.M. from three independent experiments. ** P ≤ 0.01 by t-test. (E) Quantification of average cell area of NIH/3T3 cells as in panels (A and C). Data are representative of >20 cells per condition and shown as mean ± S.E.M. from three independent experiments. ** P ≤ 0.01 by t-test. (F and G) Random cell migration patterns showing total distance migrated (F) and average velocity (G) of NIH/3T3 cells expressing KRASWT or mutant proteins. Cells were plated on glass coverslips coated with 10 μg/mL fibronectin and monitored for 16 hours. Data are representative of >10 cells per condition and shown as mean ± S.E.M. from three independent experiments. * P ≤ 0.05 and ** P ≤ 0.01 by t-test. (H) Quantification of adhesion of NIH/3T3 cells to fibronectin-coated dishes. Cells were trypsinized, labeled with CellTracker Green viability dye for 10 min and allowed to rest for 30 min before plating. Percentage attached was normalized to total cells plated. Data shown are mean ± S.E.M. of three independent experiments. * P ≤ 0.05 by t-test.
Fig. 6.
Fig. 6.. Dependence of PDAC cell lines on KRASQ61 mutants with respect to growth, signaling and mitochondrial morphology.
(A) Anchorage-dependent colony formation of KRASQ61-mutant PDAC cell lines after silencing using a non-specific (NS) and two KRAS-targeting siRNAs. Cells were cultured for seven days and stained with crystal violet. (B) Quantification of colony formation described in (A). Data are mean ± S.E.M. from four independent experiments. * P ≤ 0.05, ** P ≤ 0.01, and *** P ≤ 0.001 by one-way ANOVA with Dunnett’s post-test. (C) Immunoblot analysis of the knockdown of KRAS protein levels and of effector signaling to ERK and MYC after transfection with KRAS siRNA. Blots are representative of three independent biological replicates. (D) Changes in mitochondrial morphology detected with Mitotracker Green in Pa02C PDAC cells after siRNA-mediated KRAS knockdown compared to controls (scrambled siRNA). Images are representative of three independent experiments. Scale bar, 50 μm. (E) Cellular dependency on KRAS or MYC expression as determined by CRISPR gene knockout (CERES scores, DepMap) in KRAS-mutant pancreas, colon, and lung cancer cell lines. Each dot represents an individual cell line with a KRASQ61 or non-Q61 activating oncogenic mutation (data file S1). The more negative a value, the greater dependency on KRAS or MYC expression. Data are mean ± SD; P values from unpaired t-test.
Fig. 7.
Fig. 7.. Response of KRASQ61-mutant PDAC cell lines to combined inhibition of ERK MAPK cascade and autophagy.
(A) PDAC cell lines were stably infected with a lentiviral construct encoding mCherry-EGFP-LC3B and then treated with SCH772984 (ERKi, 1 μM) or DMSO for 24 hours. Fluorescence intensities of mCherry and EGFP were monitored using FACS analysis, and autophagic index is plotted, indicating the ratio of the median fluorescence of mCherry to EGFP. Data are the average of three independent biological replicates. (B) Cell viability of KRASQ61-mutant PDAC cell lines co-treated with SCH772984 (ERKi) and chloroquine (CQ) as assessed by CellTiter Glo. Data are representative of three independent experiments.

Comment in

References

    1. Prior IA, Hood FE, Hartley JL, The Frequency of Ras Mutations in Cancer. Cancer Res. 80, 2969–2974 (2020). - PMC - PubMed
    1. Hobbs GA, Der CJ, Rossman KL, RAS isoforms and mutations in cancer at a glance. J Cell Sci. 129, 1287–1292 (2016). - PMC - PubMed
    1. Papke B, Der CJ, Drugging RAS: Know the enemy. Science. 355, 1158–1163 (2017). - PubMed
    1. Cox AD, Fesik SW, Kimmelman AC, Luo J, Der CJ, Drugging the undruggable RAS: Mission possible? Nat Rev Drug Discov. 13, 828–851 (2014). - PMC - PubMed
    1. Prior IA, Lewis PD, Mattos C, A comprehensive survey of Ras mutations in cancer. Cancer Res. 72, 2457–2467 (2012). - PMC - PubMed

Publication types