. 2022 Sep 6;61(17):1743-1756.
doi: 10.1021/acs.biochem.2c00104. Epub 2022 Aug 9.

N-Terminal Acetylation of α-Synuclein Slows down Its Aggregation Process and Alters the Morphology of the Resulting Aggregates

Affiliations

N-Terminal Acetylation of α-Synuclein Slows down Its Aggregation Process and Alters the Morphology of the Resulting Aggregates

Rosie Bell et al. Biochemistry. .

Abstract

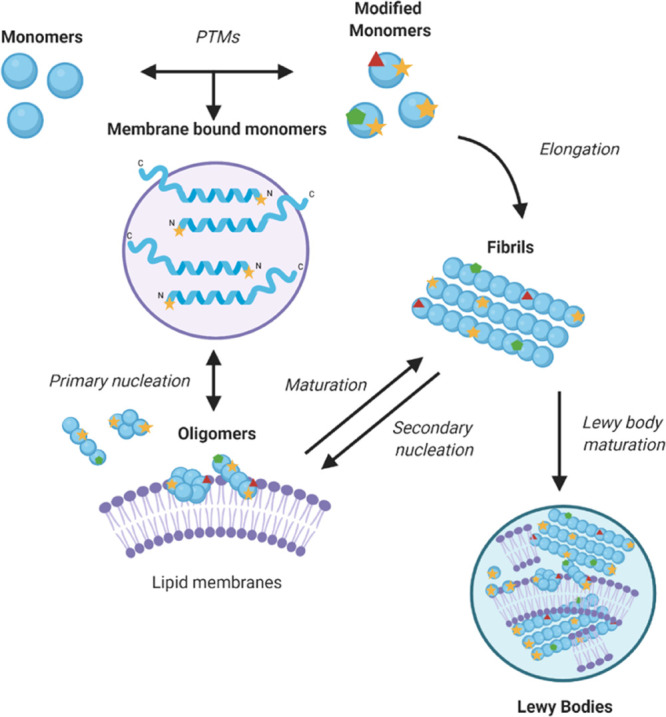
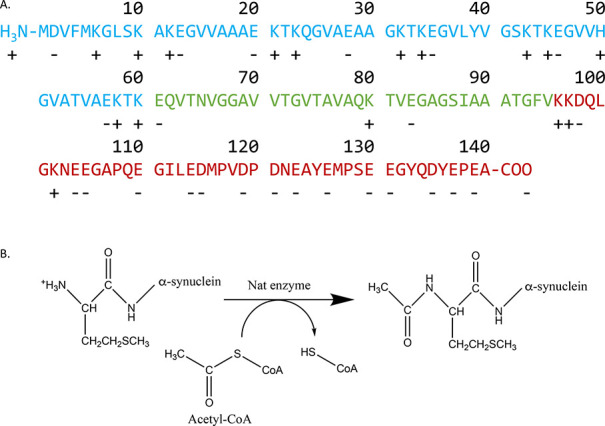
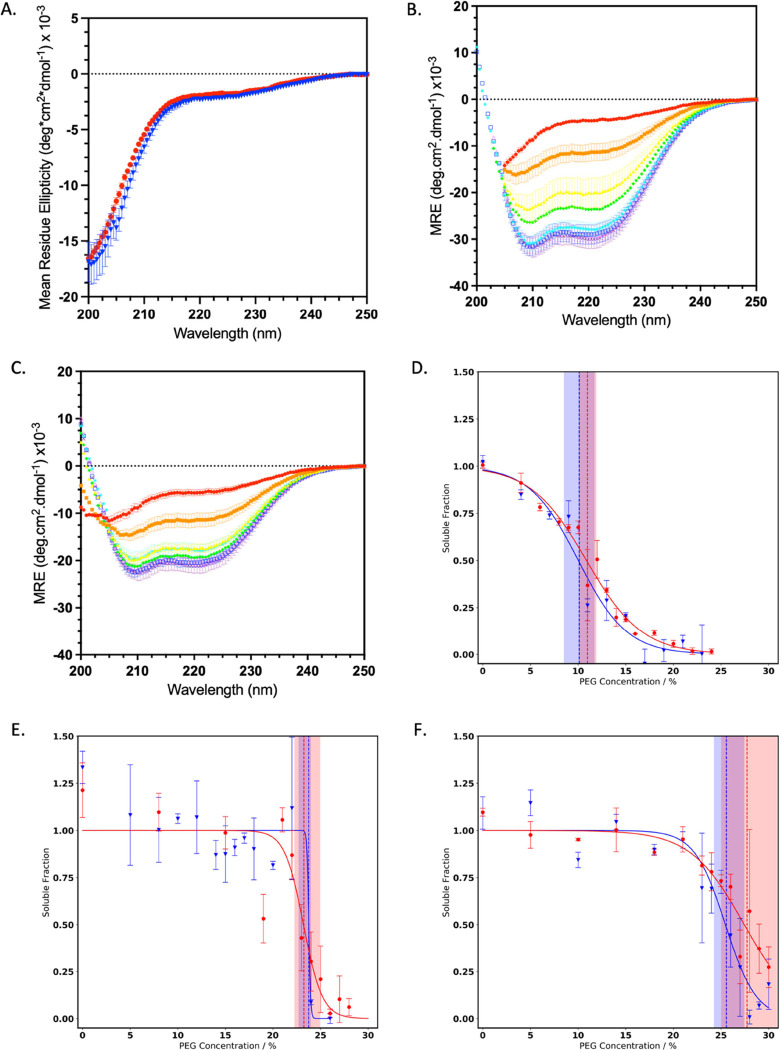
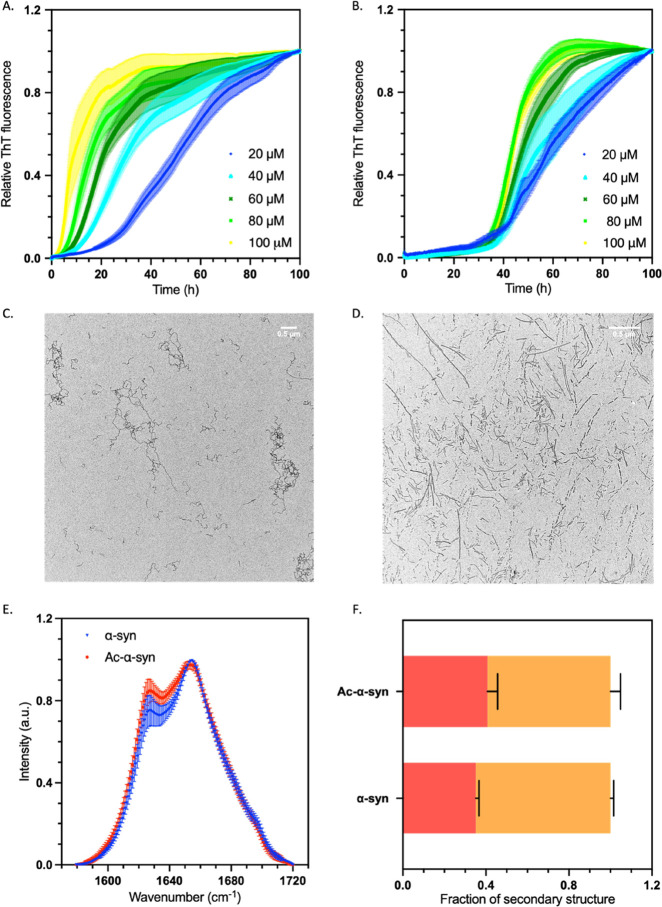
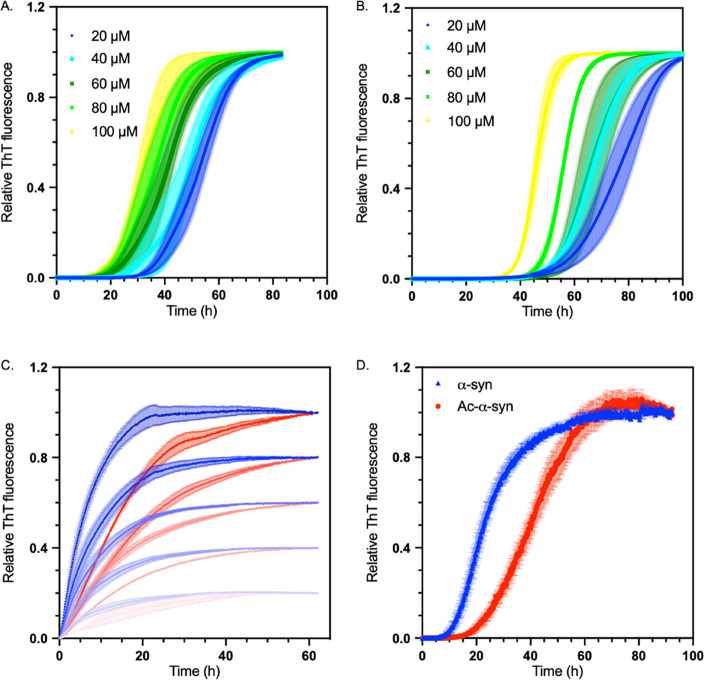
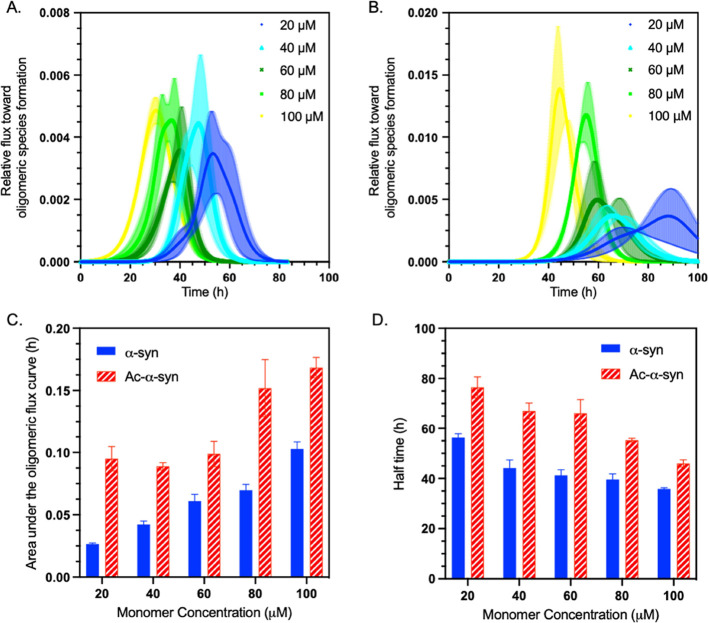
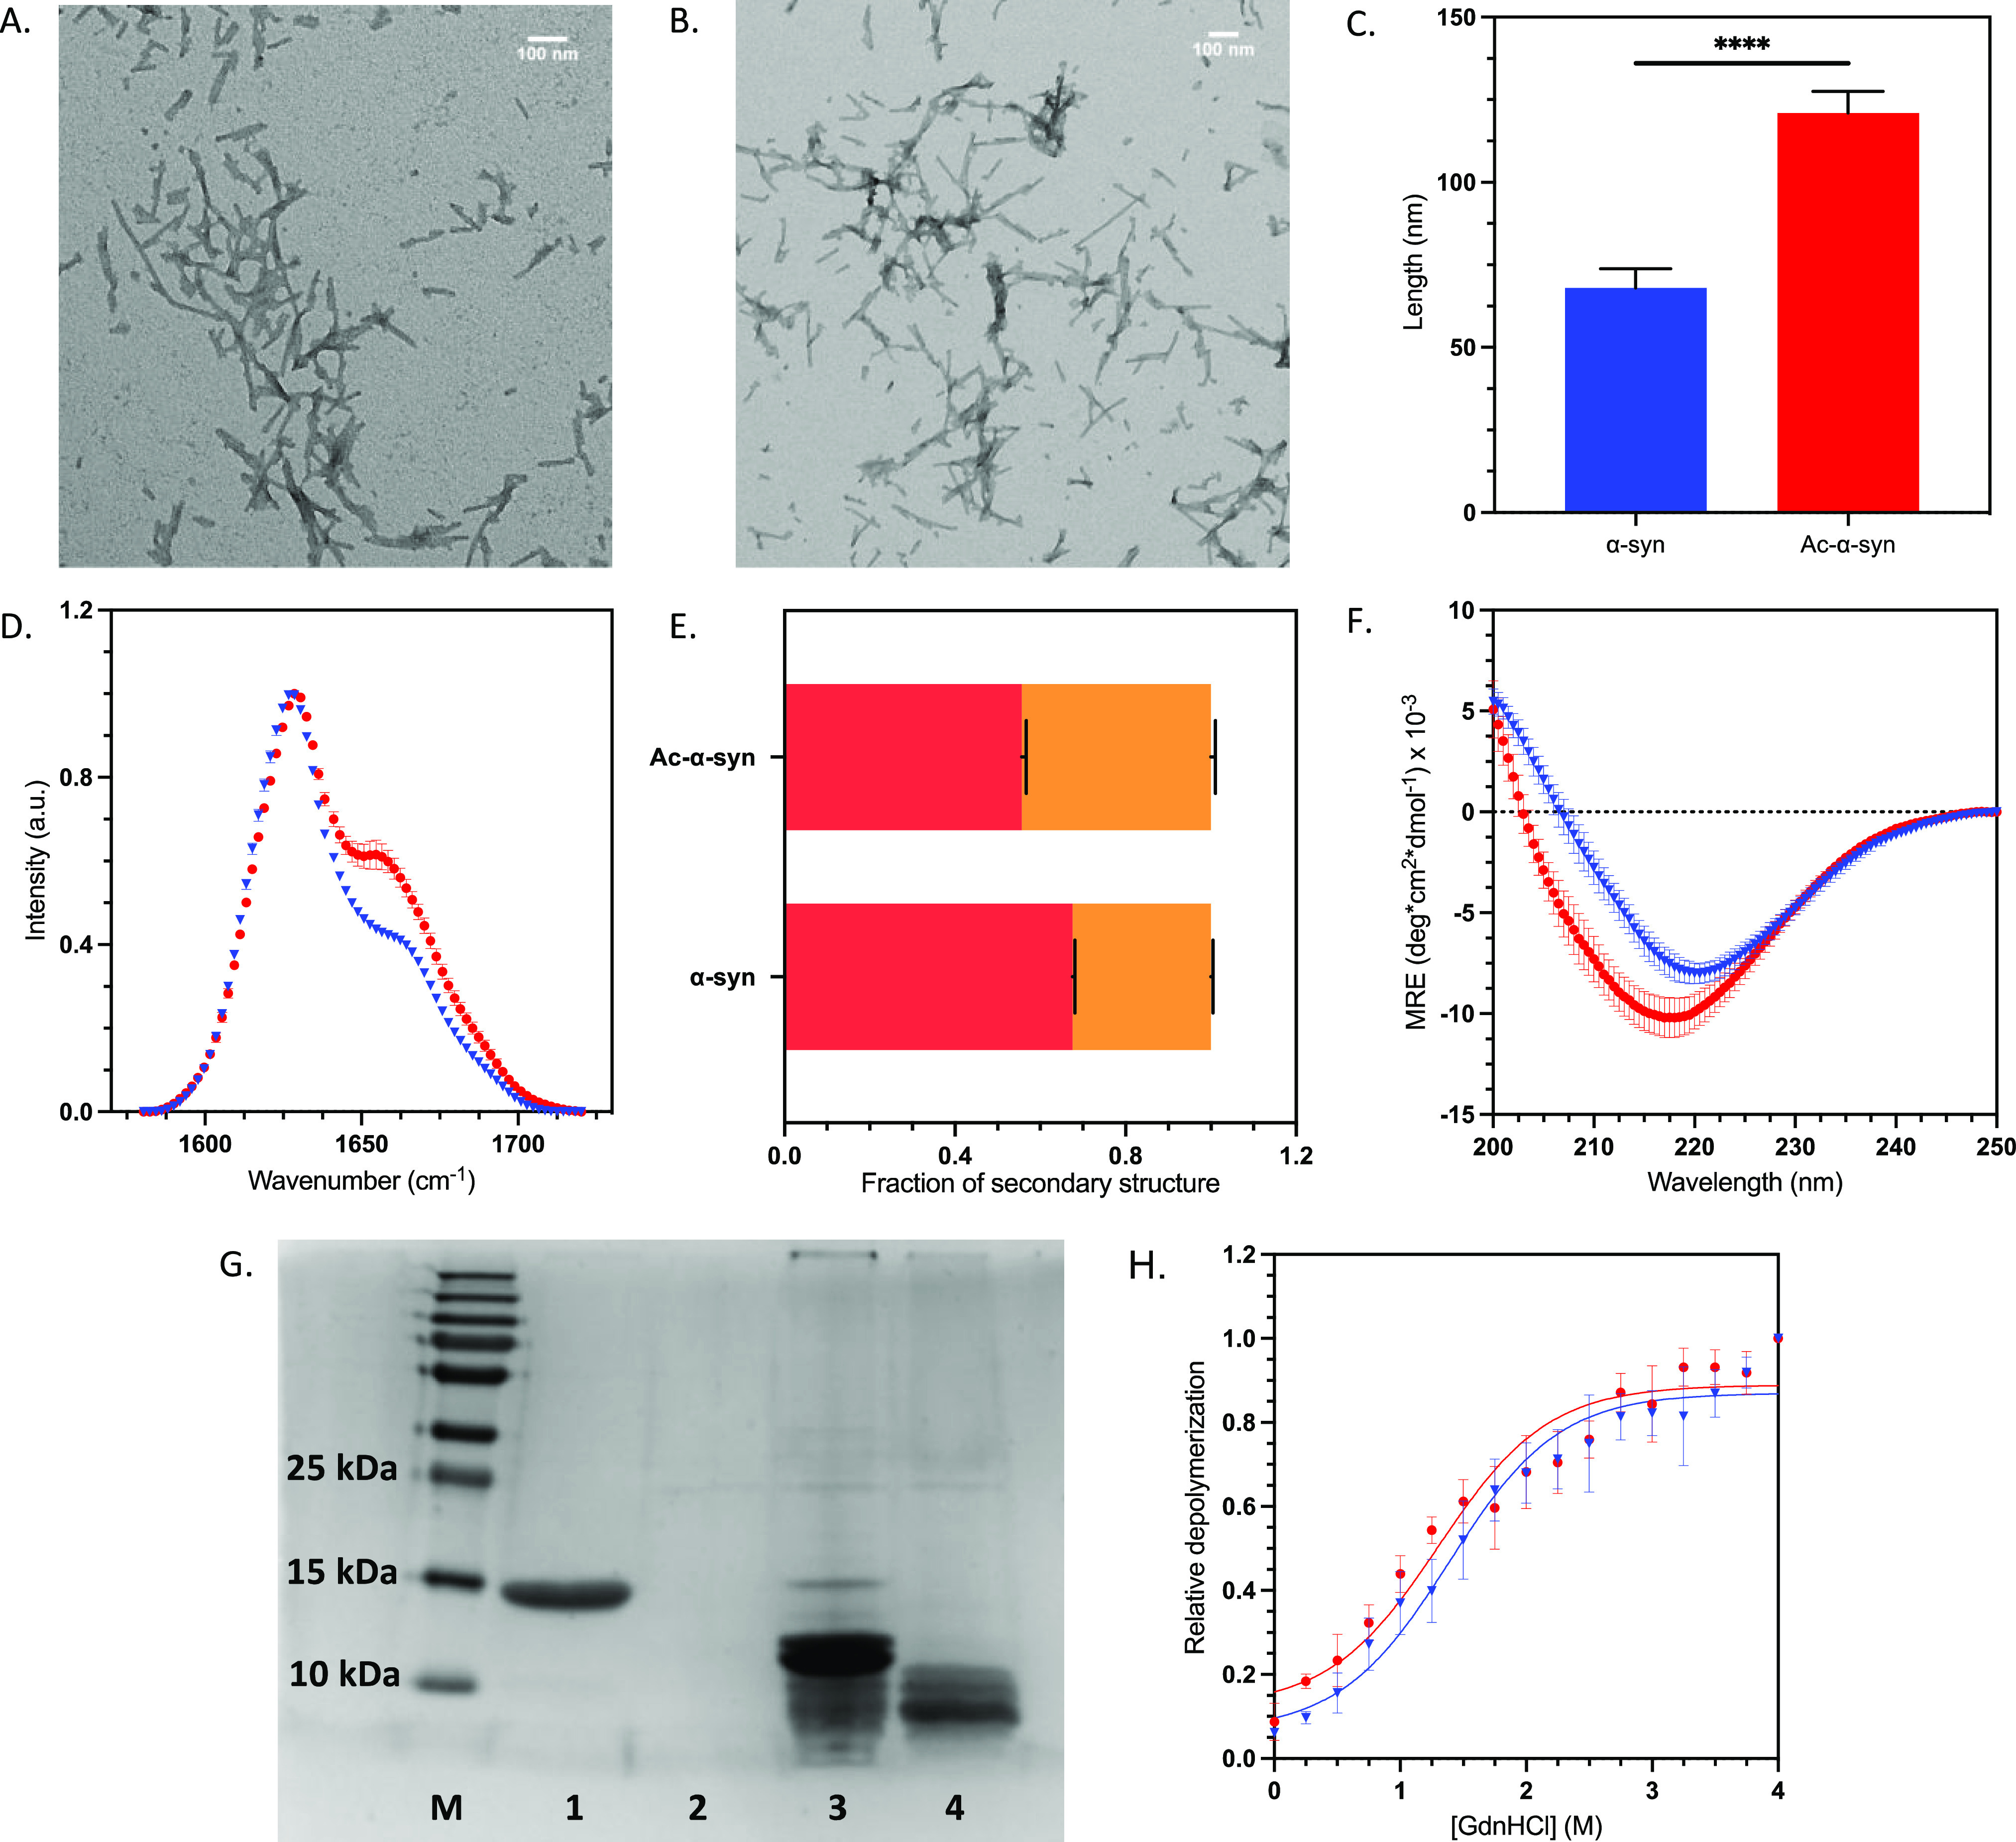
Parkinson's disease is associated with the aberrant aggregation of α-synuclein. Although the causes of this process are still unclear, post-translational modifications of α-synuclein are likely to play a modulatory role. Since α-synuclein is constitutively N-terminally acetylated, we investigated how this post-translational modification alters the aggregation behavior of this protein. By applying a three-pronged aggregation kinetics approach, we observed that N-terminal acetylation results in a reduced rate of lipid-induced aggregation and slows down both elongation and fibril-catalyzed aggregate proliferation. An analysis of the amyloid fibrils produced by the aggregation process revealed different morphologies for the acetylated and non-acetylated forms in both lipid-induced aggregation and seed-induced aggregation assays. In addition, we found that fibrils formed by acetylated α-synuclein exhibit a lower β-sheet content. These findings indicate that N-terminal acetylation of α-synuclein alters its lipid-dependent aggregation behavior, reduces its rate of in vitro aggregation, and affects the structural properties of its fibrillar aggregates.


Conflict of interest statement

The authors declare no competing financial interest.

Figures

Figure 1
Figure 1
Model of α-synuclein aggregation. As α-synuclein does not readily aggregate spontaneously, it has been proposed that lipid membranes are the site of the primary nucleation events that initiate the process of α-synuclein aggregation in vivo. At first, monomers nucleate to form small disordered oligomeric species, which then either dissociate and return to the monomeric pool or grow into amyloid aggregates., The process of Lewy body formation may involve such aggregates and lipid membranes.,
Figure 2
Figure 2
Amino acid sequence of α-synuclein and N-terminal acetylation. (A) Primary sequence of α-synuclein. The N-terminal region (residues 1–60) is shown in blue, the non-amyloid-β component (NAC, residues 61–95) in green, and the negatively charged unstructured C-terminal domain (residues 96–140) in red; positively charged residues are indicated by a + and negatively charged ones by a −. (B) N-terminal acetylation of the −1 Met of α-synuclein. This post-translational modification is carried out by a N-terminal acetyltransferase enzyme. N-terminal acetylation leads to the loss of a positive charge at the N-terminus of α-synuclein.
Figure 3
Figure 3
Structural properties and the solubility of monomeric α-synuclein are only slightly affected by N-terminal acetylation. (A) Far UV CD spectra of non-acetylated α-synuclein (blue triangle) and N-terminal acetylated α-synuclein (red dot) monomers; error bars represent the standard error of the mean (SEM) with n = 3 (B, C) CD spectra of non-acetylated α-synuclein (B) and acetylated α-synuclein (C), in the presence of increasing concentrations of DMPS: 0.1 mM (red), 0.25 mM (orange), 0.5 mM (yellow), 0.75 mM (green), 1 mM (cyan), 1.5 mM (blue), 2 mM (lilac), and 3 mM (purple); MRE, and error bars represent the SEM with n = 3. (D–F) Solubility of monomeric α-synuclein was measured by incubation with increasing concentrations of PEG at pH 4.8 (D), pH 6.5 (E), and pH 7 (F) for non-acetylated α-synuclein (blue) and acetylated α-synuclein (red). The dashed lines represent the PEG1/2 value (which is correlated with the solubility) with confidence intervals represented by shaded areas; error bars indicate the standard error of the mean (SEM).
Figure 4
Figure 4
N-terminal acetylation delays the lipid-induced aggregation of α-synuclein. (A, B) Representative time course of a lipid-induced aggregation assay of non-acetylated (A) and acetylated α-synuclein (B); error bars represent the SEM of three repeats. Data were normalized to the end-point ThT fluorescence values for each reaction. Increasing initial concentrations of α-synuclein monomers added to the reaction are shown: 20 μM (dark blue), 40 μM (light blue), 60 μM (dark green), 80 μM (light green), and 100 μM (yellow). Aggregation conditions were as follows: 20 mM NaPO4 buffer, pH 6.5, 100 μM DMPS; error bars represent the SEM with n = 3. (C, D) TEM images at 6.5 k magnification of the end point of the aggregation reaction from panels A and B, respectively; the scale bar represents 500 nm. (E) Normalized FTIR spectra of isolated aggregation end products of non-acetylated (blue triangles) and acetylated α-synuclein (red circles); error bars represent the SEM with n = 3. (F) Deconvolution of the FTIR spectra into secondary structural content for non-acetylated and acetylated α-synuclein, β-sheet shown in red and α-helix/disordered shown in orange; error bars represent SEM of n = 3.
Figure 5
Figure 5
N-terminal acetylation delays secondary processes and fibril elongation of α-synuclein (A) Representative time courses of surface-catalyzed fibril amplification of the non-acetylated α-synuclein monomer seeded by non-acetylated α-synuclein fibrils. (B) Representative time courses of surface-catalyzed fibril amplification of the acetylated α-synuclein monomer seeded by acetylated α-synuclein fibrils. (A, B) Data were normalized to the end-point ThT fluorescence values for each reaction. Increasing initial concentrations of α-synuclein monomers added to the reaction are shown: 20 μM (dark blue), 40 μM (light blue), 60 μM (dark green), 80 μM (light green), and 100 μM (yellow). Aggregation conditions were as follows: 20 mM NaPO4 buffer, pH 4.8, 50 nM seeds, under quiescent conditions; error bars represent SEM, over three replicates. (C) Representative time courses of fibril elongation of the non-acetylated α-synuclein monomer seeded with non-acetylated α-synuclein fibril (blue) and acetylated α-synuclein monomer seeded with acetylated α-synuclein fibril (red). Increasing concentrations are represented by increasing color, with 20 μM represented as the lightest and 40, 60, 80, and 100 μM as the darkest. Aggregation conditions were as follows: 20 mM NaPO4 buffer, pH 6.5, 2.5 μM seeds, under quiescent conditions at 37 °C. (D) Analysis of aggregation in an unseeded shaking reaction of non-acetylated α-synuclein (blue triangle) and acetylated α-synuclein (red dot); error bars represent the SEM with n = 3.
Figure 6
Figure 6
N-terminal acetylation of α-synuclein increases the oligomer populations generated during aggregation. (A, B) Relative flux toward oligomeric species formation (Phi) of non-acetylated (A) and acetylated α-synuclein (B) generated from surface-catalyzed fibril amplification data in Figure 5; error bars represent the SEM with n = 3. (C) Area under the curve (Phi AUC) for non-acetylated (blue) and acetylated α-synuclein (red) as a function of monomer concentration; error bars represent the SEM with n = 3. (D) Half time of the surface-catalyzed fibril amplification reactions for non-acetylated (blue) and acetylated α-synuclein (red) as a function of monomer concentration; error bars represent the SEM with n = 3.
Figure 7
Figure 7
N-terminal acetylation alters the morphology and secondary structure, but not the stability, of α-synuclein fibrils. (A, B) TEM images of F1 α-synuclein fibrils at 14.5 k magnification non-acetylated (A) and acetylated α-synuclein (B) with scale bars of 100 nm (upper right corners). (C) Average length of preformed fibrils (PFFs) calculated by TEM image analysis. The statistical significance was assessed by an unpaired T-test. (D) Normalized FTIR F1 fibrils: non-acetylated α-synuclein (blue triangle) and acetylated α-synuclein (red dot); error bars represent SEM of n = 3. (E) Deconvolution of the FTIR spectra into secondary structural elements. β-sheet shown in red and α-helix/disordered in orange. (F) Far UV CD spectra of F1 fibrils: non-acetylated α-synuclein (blue triangle) and acetylated α-synuclein (red dot); error bars represent SEM of n = 3, MRE = mean residue ellipticity. (G) SDS-PAGE gel of proteinase K (PK) digests. Lanes are as follows: (M) PageRuler plus protein ladder, (1) non-acetylated α-synuclein monomer, (2) α-synuclein monomer +0.05 mg/mL PK, (3) non-acetylated α-synuclein fibrils +0.05 mg/mL PK, (4) acetylated α-synuclein fibrils +0.05 mg/mL PK. (H) Depolymerization curve using GdnHCl as a denaturant; the concentration of the soluble fraction was measured to observe fibril depolymerization of non-acetylated α-synuclein (blue triangle) and acetylated α-synuclein (red dot); error bars represent SEM of n = 3. Data were normalized to the end-point soluble protein concentration at the highest denaturant concentration.
Figure 8
Figure 8
N-terminal acetylation does not modify the cytotoxicity of α-synuclein fibrils and fibril fragments. (A, B) Relative end-point fluorescence intensity of Calcein AM and a live cell dye expressed in arbitrary fluorescence units, in the presence of Triton X-100 (orange) or PBS (green) or when incubated with at 0.3–0.003 μM sonicated fibrils (PFFs) of non-acetylated α-synuclein (blue) and acetylated (Ac) α-synuclein (red) for (A) 24 h and (B) 48 h. (A) All treatments showed significantly different fluorescence levels to Triton X 100 treated cells (p < 0.05). However, a significant difference was not found between any other treatments (p > 0.05). (B) All treatments, showed significantly different fluorescence levels to buffer only control cells (p < 0.05). However, a significant difference was not found between acetylated and non-acetylated preformed sonicated fibril (PFF) treatments (p > 0.05). (C) Relative fluorescence intensity of PI expressed in arbitrary fluorescence units, a dead cell detecting dye, in the presence of Triton X-100 (orange) or PBS (green) or when incubated with at 0.3–0.003 μM sonicated fibrils (PFFs) formed from non-acetylated α-synuclein (blue) and acetylated (Ac) α-synuclein (red) for 24 h. * Indicates a p value of 0.01; other pairwise comparisons showed no significant differences (p > 0.05).
Figure 9
Figure 9
Comparison of the levels of reactive oxygen species (ROS) in the presence of fibrils and fibril fragments formed by non-acetylated and acetylated α-synuclein. (A) Median end-point DHR relative fluorescence intensity. (B) Median end-point MTDR relative fluorescence intensity (A and B) when incubated with 0.3 or 0.03 μM of sonicated fibrils (PFFs) formed from non-acetylated-α-synuclein (blue) and acetylated-α-synuclein (red) for 30 min or with carbonyl cyanide 3-chlorophenylhydrazone (CCCP, orange), an inducer of oxidative stress, or menadione (yellow), a mitochondrial membrane potential decreasing agent for 30 min. Relative fluorescence is expressed in arbitrary fluorescence units. (A) All treatments were significantly different from DHR only (p values < 0.03); (B) all treatments were significantly different from MTDR only (p values < 0.0001). However, no significant difference was found between acetylated and non-acetylated PFF treatments in A and B (p > 0.05). For both, error bars represent SEM for n = 3.

References

    1. Simon D. K.; Tanner C. M.; Brundin P. Parkinson Disease Epidemiology, Pathology, Genetics, and Pathophysiology. Clin. Geriatr. Med. 2020, 36, 1–12. 10.1016/j.cger.2019.08.002. - DOI - PMC - PubMed
    1. Ray Dorsey E.; Elbaz A.; Nichols E.; Abd-Allah F.; Abdelalim A.; Adsuar J. C.; Ansha M. G.; Brayne C.; Choi J. Y. J.; Collado-Mateo D.; Dahodwala N.; Do H. P.; Edessa D.; Endres M.; Fereshtehnejad S. M.; Foreman K. J.; Gankpe F. G.; Gupta R.; Hankey G. J.; Hay S. I.; Hegazy M. I.; Hibstu D. T.; Kasaeian A.; Khader Y.; Khalil I.; Khang Y. H.; Kim Y. J.; Kokubo Y.; Logroscino G.; Massano J.; Ibrahim N. M.; Mohammed M. A.; Mohammadi A.; Moradi-Lakeh M.; Naghavi M.; Nguyen B. T.; Nirayo Y. L.; Ogbo F. A.; Owolabi M. O.; Pereira D. M.; Postma M. J.; Qorbani M.; Rahman M. A.; Roba K. T.; Safari H.; Safiri S.; Satpathy M.; Sawhney M.; Shafieesabet A.; Shiferaw M. S.; Smith M.; Szoeke C. E. I.; Tabarés-Seisdedos R.; Truong N. T.; Ukwaja K. N.; Venketasubramanian N.; Villafaina S.; Weldegwergs K. G.; Westerman R.; Wijeratne T.; Winkler A. S.; Xuan B. T.; Yonemoto N.; Feigin V. L.; Vos T.; Murray C. J. L. Global, regional, and national burden of Parkinson’s disease, 1990–2016: a systematic analysis for the Global Burden of Disease Study 2016. Lancet Neurol. 2018, 17, 939–953. 10.1016/S1474-4422(18)30295-3. - DOI - PMC - PubMed
    1. Ferreira M.; Massano J. An updated review of Parkinson’s disease genetics and clinicopathological correlations. Acta Neurol. Scand. 2017, 135, 273–284. 10.1111/ane.12616. - DOI - PubMed
    1. Deng H.; Wang P.; Jankovic J. The genetics of Parkinson disease. Ageing Res. Rev. 2018, 42, 72–85. 10.1016/j.arr.2017.12.007. - DOI - PubMed
    1. Spillantini M. G.; Schmidt M. L.; Lee V. M.; Trojanowski J. Q.; Jakes R.; Goedert M. a -Synuclein in Lewy bodies. Nature 1997, 388, 839–840. 10.1038/42166. - DOI - PubMed

Publication types