

An Overfeeding-Induced Obesity Mouse Model Reveals Necessity for Sin3a in Postnatal Peak β-Cell Mass Acquisition
- PMID: 35944274
- PMCID: PMC9630089
- DOI: 10.2337/db22-0306
An Overfeeding-Induced Obesity Mouse Model Reveals Necessity for Sin3a in Postnatal Peak β-Cell Mass Acquisition
Abstract
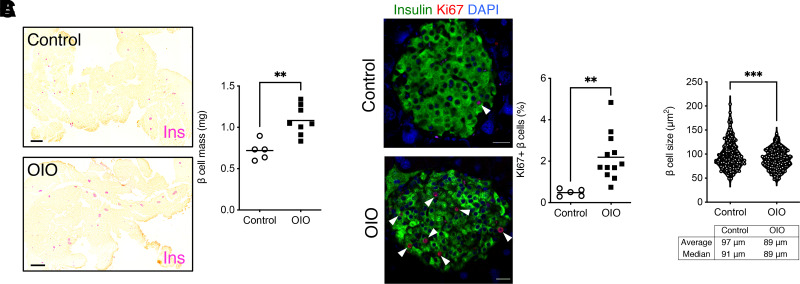
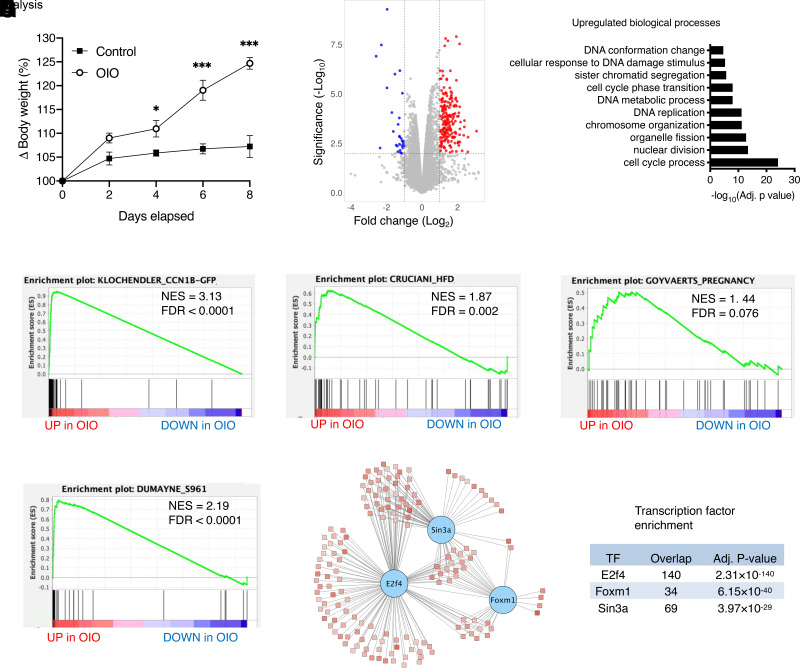
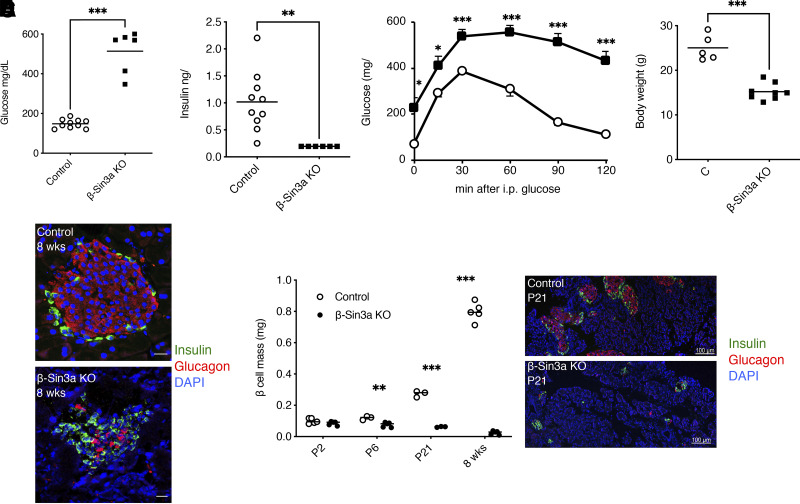
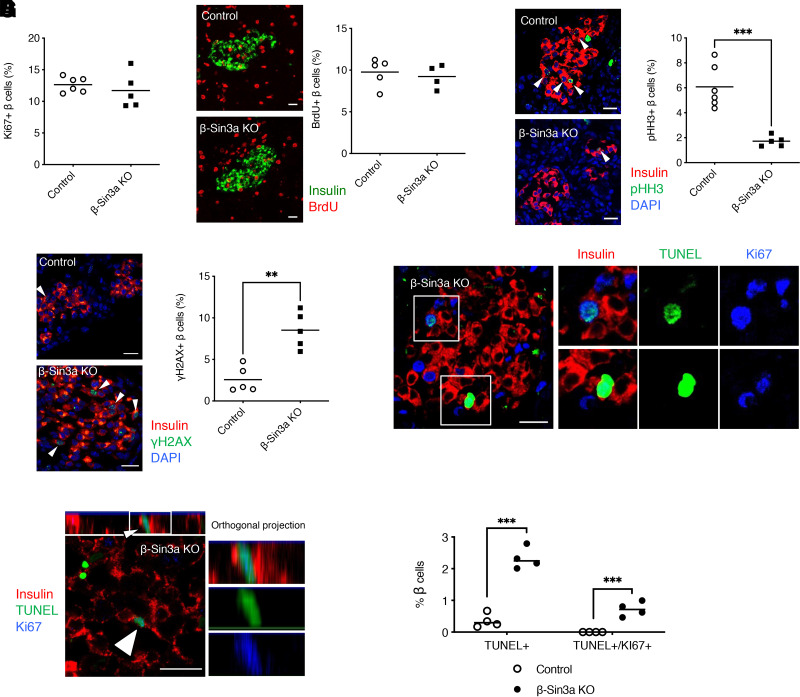
The increase of functional β-cell mass is paramount to maintaining glucose homeostasis in the setting of systemic insulin resistance and/or augmented metabolic load. Understanding compensatory mechanisms that allow β-cell mass adaptation may allow for the discovery of therapeutically actionable control nodes. In this study, we report the rapid and robust β-cell hyperplasic effect in a mouse model of overfeeding-induced obesity (OIO) based on direct gastric caloric infusion. By performing RNA sequencing in islets isolated from OIO mice, we identified Sin3a as a novel transcriptional regulator of β-cell mass adaptation. β-Cell-specific Sin3a knockout animals showed profound diabetes due to defective acquisition of postnatal β-cell mass. These findings reveal a novel regulatory pathway in β-cell proliferation and validate OIO as a model for discovery of other mechanistic determinants of β-cell adaptation.
© 2022 by the American Diabetes Association.
Figures
Similar articles
-
Characterization of Signaling Pathways Associated with Pancreatic β-cell Adaptive Flexibility in Compensation of Obesity-linked Diabetes in db/db Mice.Mol Cell Proteomics. 2020 Jun;19(6):971-993. doi: 10.1074/mcp.RA119.001882. Epub 2020 Apr 7. Mol Cell Proteomics. 2020. PMID: 32265294 Free PMC article.
-
Insulin resistance causes increased beta-cell mass but defective glucose-stimulated insulin secretion in a murine model of type 2 diabetes.Diabetologia. 2006 Jan;49(1):90-9. doi: 10.1007/s00125-005-0045-y. Epub 2005 Dec 15. Diabetologia. 2006. PMID: 16362284
-
SGLT2 deletion improves glucose homeostasis and preserves pancreatic beta-cell function.Diabetes. 2011 Mar;60(3):890-8. doi: 10.2337/db10-1328. Diabetes. 2011. PMID: 21357472 Free PMC article.
-
NRF2 is required for neonatal mouse beta cell growth by maintaining redox balance and promoting mitochondrial biogenesis and function.Diabetologia. 2024 Mar;67(3):547-560. doi: 10.1007/s00125-023-06071-7. Epub 2024 Jan 11. Diabetologia. 2024. PMID: 38206362 Free PMC article.
-
Cellular Senescence in Diabetes Mellitus: Distinct Senotherapeutic Strategies for Adipose Tissue and Pancreatic β Cells.Front Endocrinol (Lausanne). 2022 Mar 31;13:869414. doi: 10.3389/fendo.2022.869414. eCollection 2022. Front Endocrinol (Lausanne). 2022. PMID: 35432205 Free PMC article. Review.
Cited by
-
Endocrine disruptors in plastics alter β-cell physiology and increase the risk of diabetes mellitus.Am J Physiol Endocrinol Metab. 2023 Jun 1;324(6):E488-E505. doi: 10.1152/ajpendo.00068.2023. Epub 2023 May 3. Am J Physiol Endocrinol Metab. 2023. PMID: 37134142 Free PMC article. Review.
-
Protection against overfeeding-induced weight gain is preserved in obesity but does not require FGF21 or MC4R.Nat Commun. 2024 Feb 8;15(1):1192. doi: 10.1038/s41467-024-45223-0. Nat Commun. 2024. PMID: 38331907 Free PMC article.
References
-
- Dor Y, Brown J, Martinez OI, Melton DA. Adult pancreatic beta-cells are formed by self-duplication rather than stem-cell differentiation. Nature 2004;429:41–46 - PubMed
-
- Van de Casteele M, Leuckx G, Cai Y, et al. . Partial duct ligation: β-cell proliferation and beyond. Diabetes 2014;63:2567–2577 - PubMed
