. 2022 Aug 8;40(8):865-878.e6.
doi: 10.1016/j.ccell.2022.07.004.

Pan-cancer integrative histology-genomic analysis via multimodal deep learning

Affiliations

Pan-cancer integrative histology-genomic analysis via multimodal deep learning

Richard J Chen et al. Cancer Cell. .

Abstract

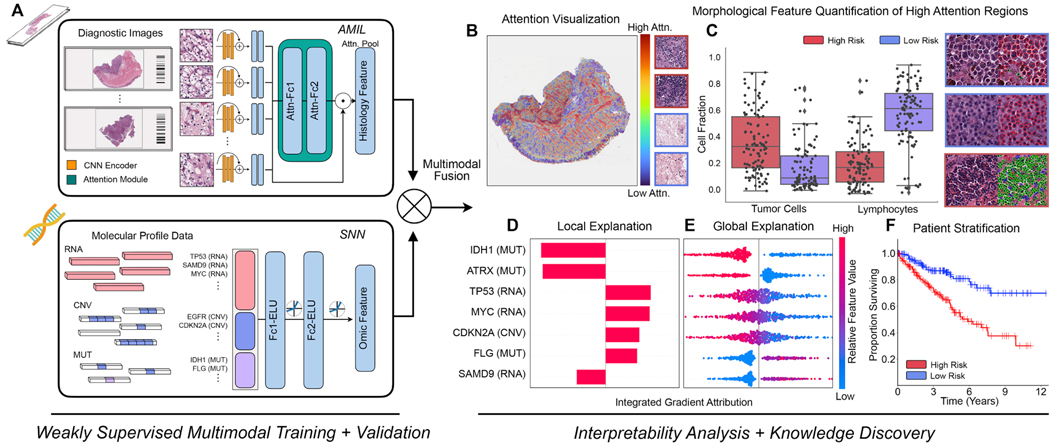
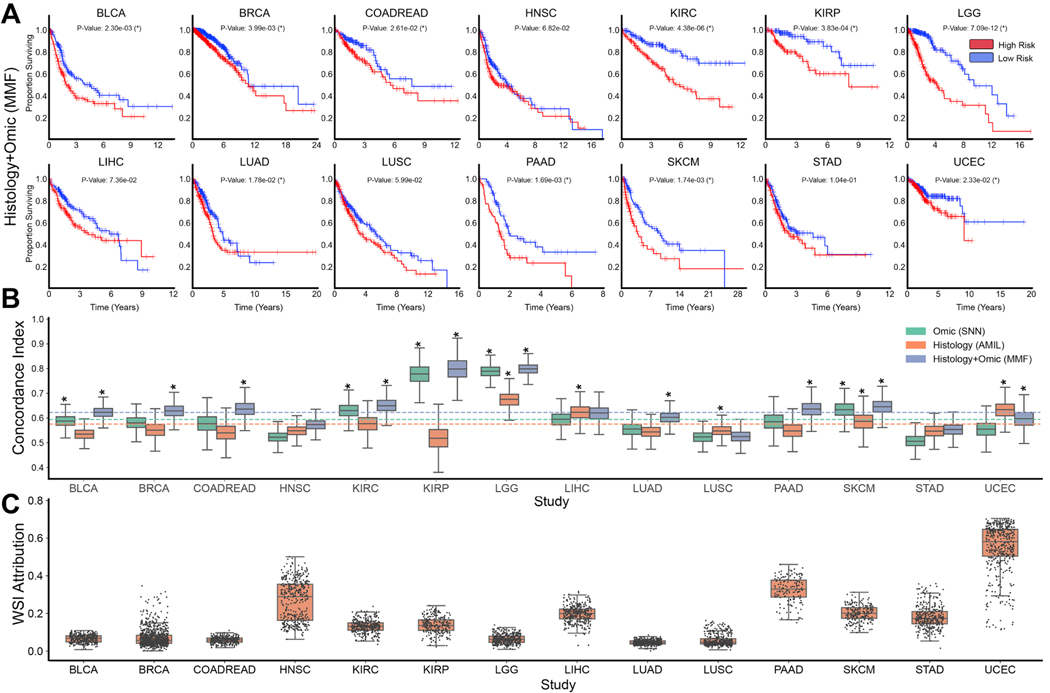
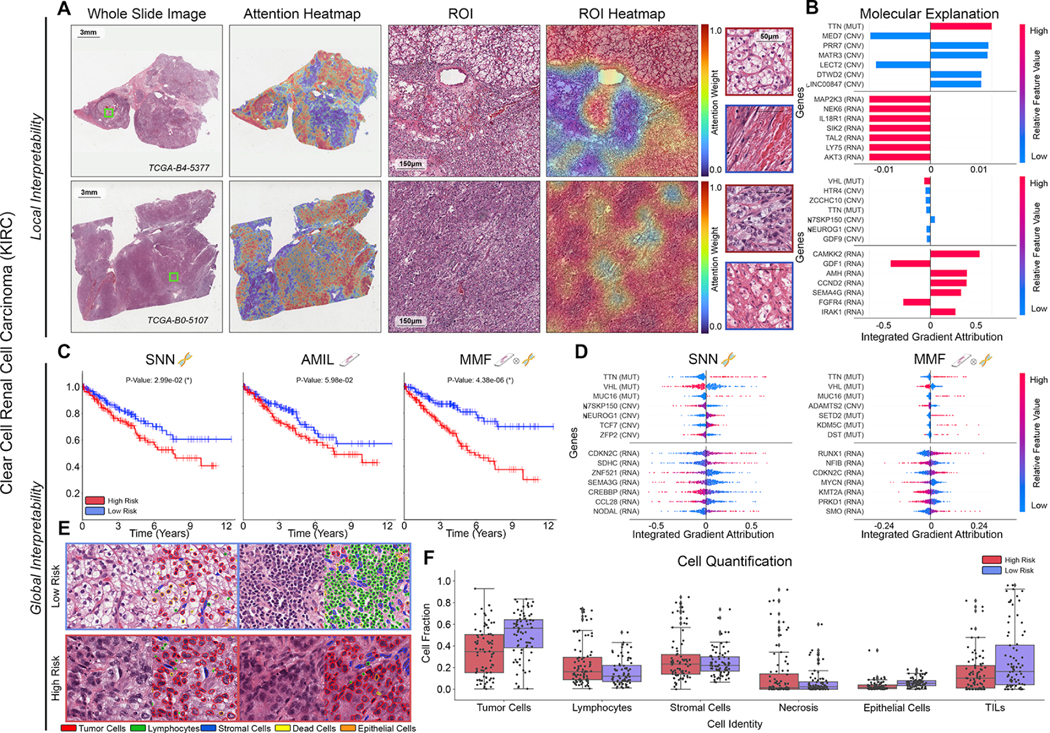
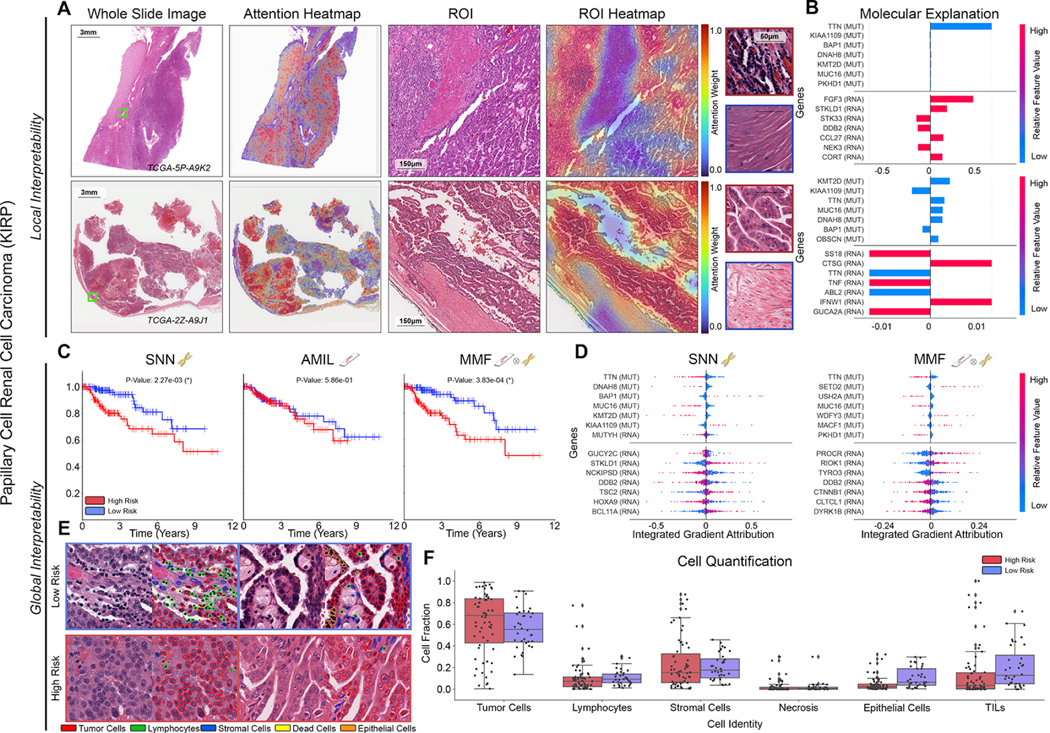
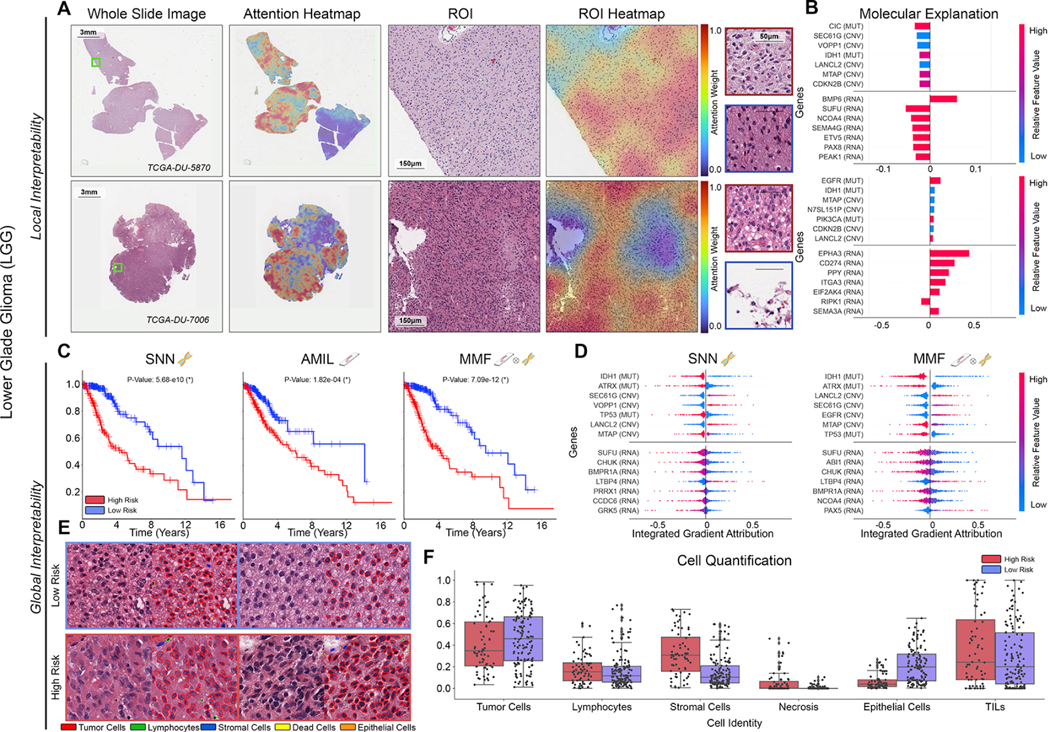
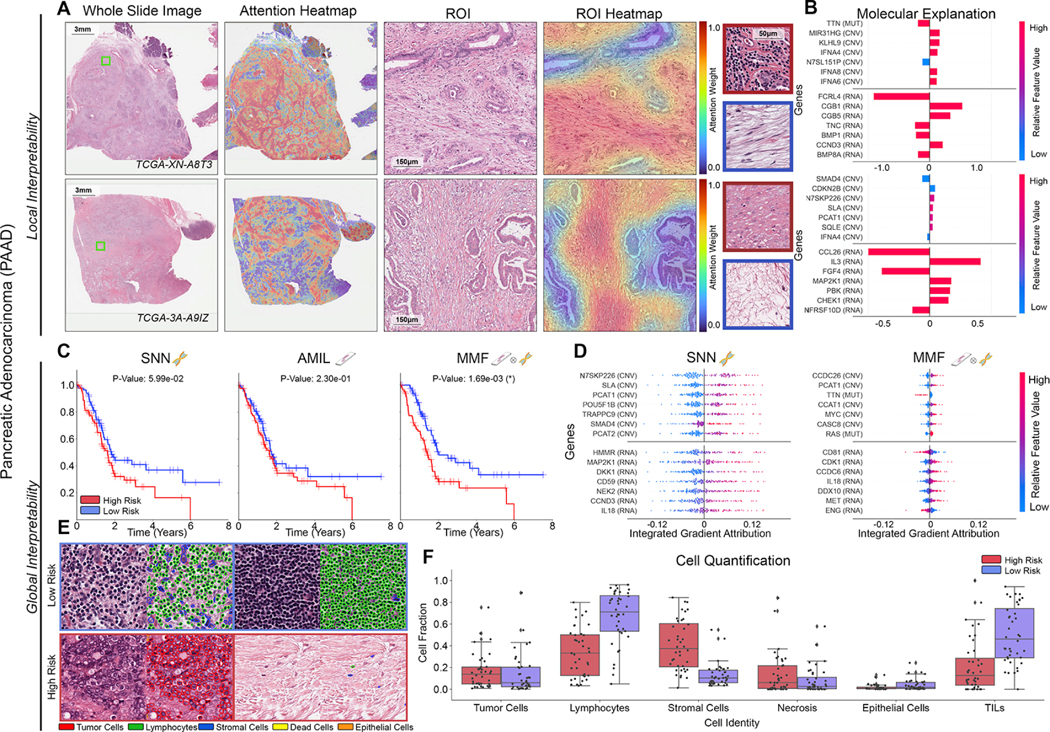
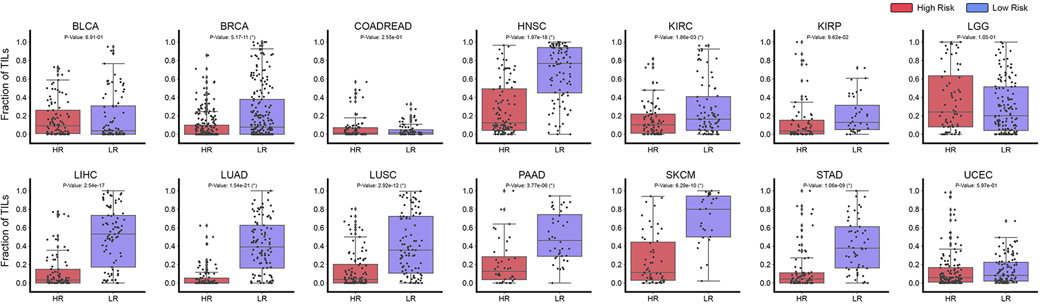
The rapidly emerging field of computational pathology has demonstrated promise in developing objective prognostic models from histology images. However, most prognostic models are either based on histology or genomics alone and do not address how these data sources can be integrated to develop joint image-omic prognostic models. Additionally, identifying explainable morphological and molecular descriptors from these models that govern such prognosis is of interest. We use multimodal deep learning to jointly examine pathology whole-slide images and molecular profile data from 14 cancer types. Our weakly supervised, multimodal deep-learning algorithm is able to fuse these heterogeneous modalities to predict outcomes and discover prognostic features that correlate with poor and favorable outcomes. We present all analyses for morphological and molecular correlates of patient prognosis across the 14 cancer types at both a disease and a patient level in an interactive open-access database to allow for further exploration, biomarker discovery, and feature assessment.

Keywords: artificial intelligence; biomarker discovery; cancer prognosis; computational pathology; data fusion; deep learning; digital pathology; multimodal integration; multimodal prognostic models; pan-cancer.


Conflict of interest statement

Declaration of interests R.J.C. and F.M. are inventors on a patent that has been filed corresponding multimodal data fusion using deep learning. The authors declare no other competing interests.

Figures

Figure 1:
Figure 1:. Pathology-Omic Research Platform for Integrative Survival Estimation (PORPOISE) Workflow.
A. Patient data in the form of digitized high-resolution FFPE H&E histology glass slides (known as WSIs) with corresponding molecular data are used as input in our algorithm. Our multimodal algorithm consists of three neural network modules together: 1) an attention-based multiple instance learning (AMIL) network for processing WSIs, 2) a self-normalizing network (SNN) for processing molecular data features, and 3) a multimodal fusion layer that computes the Kronecker Product to model pairwise feature interactions between histology and molecular features. B. For WSIs, per-patient local explanations are visualized as high-resolution attention heatmaps using attention-based interpretability, in which high attention regions (red) in the heatmap correspond to morphological features that contribute to the model’s predicted risk score. C. Global morphological patterns are extracted via cell quantification of high attention regions in low- and high-risk patient cohorts. D. For molecular features, per-patient local explanations are visualized using attribution-based interpretability in Integrated Gradients. E. Global interpretability for molecular features is performed via analyzing the directionality, feature value and magnitude of gene attributions across all patients. F. Kaplan-Meier analysis is performed to visualize patient stratification of low- and high-risk patients for individual cancer types. See also Table S1.
Figure 2:
Figure 2:. Model performances of PORPOISE and understanding impact of multimodal training.
A. Kaplan-Meier analysis of patient stratification of low- and high-risk patients via MMF across all 14 cancer types. Low- and high-risks are defined by the median 50% percentile of hazard predictions via MMF. Logrank test was used to test for statistical significance in survival distributions between low- and high-risk patients (with * marked if P-Value < 0.05). B. c-Index performance of SNN, AMIL and MMF in each cancer type in a five-fold cross-validation (n=5,720). Horizontal line for each model shows average c-Index performance across all cancer types. Box plots correspond to c-indices of 1000 bootstrap replicates on the aggregated risk predictions. C. Distribution of WSI attribution across 14 cancer types. Each dot represents the proportion of feature attribution given to the WSI modality input compared to molecular feature input. Attributions were computed on the aggregated risk predictions in each disease model. See also Figure S1-S3, S11, S12 Table S1-S3.
Figure 3:
Figure 3:. Quantitative performance, local model explanation, and global interpretability analyses of PORPOISE on clear cell renal cell carcinoma (KIRC).
A. For KIRC (n=345), high attention for low-risk cases (top, n=80) tends to focus on classic clear cell morphology while in high-risk cases (bottom, n=80), high attention often corresponds to areas with decreased cytoplasm or increased nuclear to cytoplasmic ratio. B. Local gene attributions for the corresponding low-risk (top) and high-risk (bottom) cases. C. Kaplan–Meier curves for omics-only (left, “SNN”), histology-only (center, “AMIL”) and multimodal fusion (right, “MMF”), showing improved separation using MMF. D. Global gene attributions across patient cohorts according to unimodal interpretability (left, “SNN”), and multimodal interpretability (right, “MMF”). SNN and MMF were both able to identify immune-related and prognostic markers such as CDKN2C and VHL in KIRC. MMF additionally attributes to other immune-related / prognostic genes such as RUNX1 and NFIB in KIRC. E. Exemplar high attention patches from low-risk (top) and high-risk (bottom) cases with corresponding cell labels. F. Quantification of cell types in high attention patches for each disease overall, showing increased tumor and TIL presence. See also Figure S2-11, Table S4.
Figure 4:
Figure 4:. Quantitative performance, local model explanation, and global interpretability analyses of PORPOISE in papillary renal cell carcinoma (KIRP).
A. For KIRP (n=253), low-risk cases (top, n=36) often have high attention paid to complex and curving papillary architecture while for high-risk cases (bottom, n=63), high attention is paid to denser areas of tumor cells. B. Local gene attributions for the corresponding low-risk (top) and high-risk (bottom) cases. C. Kaplan–Meier curves for omics-only (left, “SNN”), histology-only (center, “AMIL”) and multimodal fusion (right, “MMF”), showing improved separation using MMF. D. Global gene attributions across patient cohorts according to unimodal interpretability (left, “SNN”), and multimodal interpretability (right, “MMF”). SNN and MMF were both able to identify prognostic markers such as BAP1 in KIRP. MMF additionally attributes to other immune-related / prognostic genes such as PROCR and RIOK1 in KIRP. E. Exemplar high attention patches from low-risk (top) and high-risk (bottom) cases with corresponding cell labels. F. Quantification of cell types in high attention patches for each disease overall, showing increased epithelial cell and TIL presence. See also Figure S2-11, Table S4.
Figure 5:
Figure 5:. Quantitative performance, local model explanation, and global interpretability analyses of PORPOISE on lower-grade gliomas (LGG).
A. For LGG (n=404), high attention for low-risk cases (top, n=133) tends to focus on dense regions of tumor cells, while in high-risk cases (bottom, n=68), high attention focuses on both dense regions of tumor cells and areas of vascular proliferation. B. Local gene attributions for the corresponding low-risk (top) and high-risk (bottom) cases. C. Kaplan–Meier curves for omics-only (left, “SNN”), histology-only (center, “AMIL”) and multimodal fusion (right, “MMF”), demonstrating improvement in patient stratification in MMF. D. Global gene attributions across patient cohorts according to unimodal interpretability (left, “SNN”), and multimodal interpretability (right, “MMF”). SNN and MMF were both able to identify immune-related and prognostic markers such as IDH1, ATRX, EGFR, and CDKN2B in LGG. E. High attention patches from low-risk (top) and high-risk (bottom) cases with corresponding cell labels, showing oligodendroglioma and astrocytoma subtypes respectively. F. Quantification of cell types in high attention patches for each disease overall, with statistical significance for increased necrosis in high-risk patients. See also Figure S2-11, Table S4.
Figure 6:
Figure 6:. Quantitative performance, local model explanation, and global interpretability analyses of PORPOISE on pancreatic adenocarcinoma (PAAD).
A. For PAAD (n=160), high attention for low-risk cases (top, n=40) tends to focus on stroma-contained dispersed glands and aggregates of lymphocytes, while in high-risk cases (bottom, n=40), high attention focuses on tumor-associated and myxoid stroma. B. Local gene attributions for the corresponding low-risk (top) and high-risk (bottom) cases from a and g. C. Kaplan–Meier curves for omics-only (left, “SNN”), histology-only (center, “AMIL”) and multimodal fusion (right, “MMF”), demonstrating SNN and AMIL showing poor separation of patients with low survival, with better stratification following multimodal integration. D. Global gene attributions across patient cohorts according to unimodal interpretability (left, “SNN”), and multimodal interpretability (right, “MMF”). SNN and MMF were both able to identify immune-related and prognostic markers such as IL8, EGFR, and MET in PAAD. MMF additionally shifts attribution to other immune-related / prognostic genes such as CD81, CDK1, and IL9. E. High attention patches from low-risk (top) and high-risk (bottom) cases with corresponding cell labels. F. Quantification of cell types in high attention patches for each disease overall, showing increased lymphocyte and TIL presence in low-risk patients, as well as increased necrosis presence in PAAD. See also Figure S2-11, Table S4.
Figure 7:
Figure 7:. Tumor Infiltrating Lymphocyte Quantification in Patient Risk Groups.
TIL quantification in high attention regions of predicted low- (BLCA n=90, BRCA n=220, COADREAD n=74, HNSC n=96, KIRC n=80, KIRP n=36, LGG n=133, LIHC n=85, LUAD n=105, LUSC n=97, PAAD n=40, SKCM n=29, STAD n=53, UCEC=104) and high-risk patient cases (BLCA n=93, BRCA n=223, COADREAD n=80, HNSC n=103, KIRC n=80, KIRP n=63, LGG n=68, LIHC n=84, LUAD n=89, LUSC n=103, PAAD n=40, SKCM n=55, STAD n=78, UCEC=125) across 14 cancer types. For each patient, the top 1% of scored high attention regions (512 × 512 40× image patches) were segmented and analyzed for tumor and immune cell presence. Image patches with high tumor-immune co-localization were indicated as positive for TIL presence (and negative otherwise). Across all patients, the fraction of high attention patches containing TIL presence was computed and visualized in the box plots. A two-sample t-test was computed for each cancer type to test the if the means of the TIL fraction distributions of low- and high-risk patients had a statistically significant difference (with * marked if P-Value < 0.05).

Comment in

References

    1. Abdelmoula WM, Balluff B, Englert S, Dijkstra J, Reinders MJ, Walch A, McDonnell LA and Lelieveldt BP, (2016). Data-driven identification of prognostic tumor subpopulations using spatially mapped t-SNE of mass spectrometry imaging data. Proceedings of the National Academy of Sciences, 113(43), pp.12244–12249. 10.1073/pnas.1510227113 - DOI - PMC - PubMed
    1. AbdulJabbar K, Raza SEA, Rosenthal R, Jamal-Hanjani M, Veeriah S, Akarca A, Lund T, Moore DA, Salgado R, Al Bakir M. and Zapata L, (2020). Geospatial immune variability illuminates differential evolution of lung adenocarcinoma. Nature Medicine, 26(7), pp.1054–1062. 10.1038/s41591-020-0900-x - DOI - PMC - PubMed
    1. Amin MB, Greene FL, Edge SB, Compton CC, Gershenwald JE, Brookland RK, Meyer L, Gress DM, Byrd DR and Winchester DP, (2017). The eighth edition AJCC cancer staging manual: continuing to build a bridge from a population‐ based to a more “personalized” approach to cancer staging. CA: a cancer journal for clinicians, 67(2), pp.93–99. 10.3322/caac.21388 - DOI - PubMed
    1. Bai H, Harmancı AS, Erson-Omay EZ, Li J, Coşkun S, Simon M, Krischek B, Özduman K, Omay SB, Sorensen EA and Turcan Ş, (2016). Integrated genomic characterization of IDH1-mutant glioma malignant progression. Nature genetics, 48(1), pp.59–66. 10.1038/ng.3457 - DOI - PMC - PubMed
    1. Baltrušaitis T, Ahuja C. and Morency LP, (2018). Multimodal machine learning: A survey and taxonomy. IEEE transactions on pattern analysis and machine intelligence, 41(2), pp.423–443. 10.1109/tpami.2018.2798607 - DOI - PubMed

Publication types