. 2022 Oct:64:101562.
doi: 10.1016/j.molmet.2022.101562. Epub 2022 Aug 6.

The mitochondrial NAD kinase functions as a major metabolic regulator upon increased energy demand

Affiliations

The mitochondrial NAD kinase functions as a major metabolic regulator upon increased energy demand

Hyunbae Kim et al. Mol Metab. 2022 Oct.

Abstract

Objective: The mitochondrial nicotinamide adenine dinucleotide (NAD) kinase (MNADK) mediates de novo mitochondrial NADP biosynthesis by catalyzing the phosphorylation of NAD to yield NADP. In this study, we investigated the function and mechanistic basis by which MNADK regulates metabolic homeostasis.

Methods: Generalized gene set analysis by aggregating human patient genomic databases, metabolic studies with genetically engineered animal models, mitochondrial bioenergetic analysis, as well as gain- and loss- of-function studies were performed to address the functions and mechanistic basis by which MNADK regulates energy metabolism and redox state associated with metabolic disease.

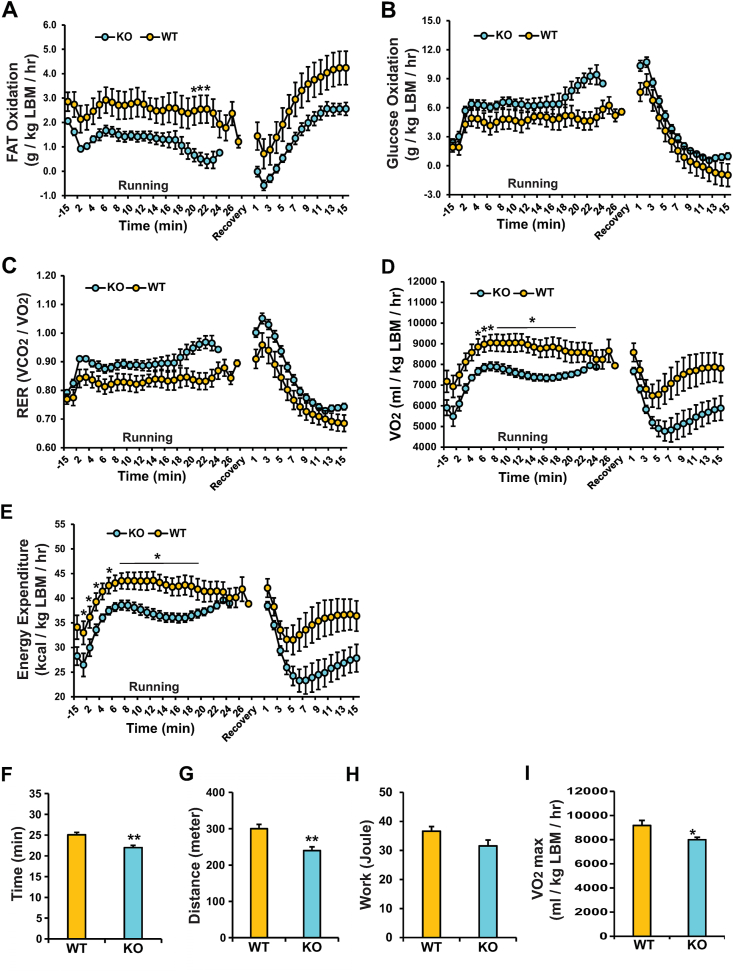
Results: Human MNADK common gene variants or decreased expression of the gene are significantly associated with the occurrence of type-2 diabetes, non-alcoholic fatty liver disease (NAFLD), or hepatocellular carcinoma (HCC). Ablation of the MNADK gene in mice led to decreased fat oxidation, coincident with increased respiratory exchange ratio (RER) and decreased energy expenditure upon energy demand triggered by endurance exercise or fasting. On an atherogenic high-fat diet (HFD), MNADK-null mice exhibited hepatic insulin resistance and glucose intolerance, indicating a type-2 diabetes-like phenotype in the absence of MNADK. MNADK deficiency led to a decrease in mitochondrial NADP(H) but an increase in cellular reactive oxygen species (ROS) in mouse livers. Consistently, protein levels of the major metabolic regulators or enzymes were decreased, while their acetylation modifications were increased in the livers of MNADK-null mice. Feeding mice with a HFD caused S-nitrosylation (SNO) modification, a posttranslational modification that represses protein activities, on MNADK protein in the liver. Reconstitution of an SNO-resistant MNADK variant, MNADK-S193, into MNADK-null mice mitigated hepatic steatosis induced by HFD.

Conclusion: MNADK, the only known mammalian mitochondrial NAD kinase, plays important roles in preserving energy homeostasis to mitigate the risk of metabolic disorders.

Keywords: Acetylation; Diabetes; Energy metabolism; MNADK; Metabolic transcription factors; Mitochondrial metabolism; NADK2.


Figures

Figure 1
Figure 1
Human MNADK gene variants or decreased expression are associated with T2DM, NAFLD, and HCC. (A) Human MNADK common gene variants are associated with major metabolic phenotypes or disorders. Human MNADK gene variants and their association with metabolic phenotypes are determined by generalized gene-set analysis based on the Common Metabolic Diseases Knowledge Portal (CMDKP) comprising of 271 datasets and 330 traits (https://hugeamp.org/). (B) Levels of MNADK mRNAs in livers of human patients with NAFLD (n = 40 control, 32 advanced NAFLD), based on the datasets of mRNA microarray with human NAFLD or control patient liver biopsy samples (GSE49541 dataset). (C) Levels of MNADK mRNAs in livers of human patients with HCC (n = 10 control, 81 HCC), based on the datasets of mRNA microarray database with the liver biopsy samples from human HCC or non-tumor control patients (GSE62232). The mean relative intensity based on the mRNA microarray database for each gene is shown. Data are presented as mean ± SEM. Mean values were compared by unpaired 2-tailed Student's t-test. ∗, P < 0.05; ∗∗, P < 0.001).
Figure 2
Figure 2
MNADK-KO mice are prone to metabolic syndrome. MNADK-KO and WT control mice were fed with the atherogenic HFD for 3 weeks before being subjected to metabolic phenotyping. (A-B) ITT (insulin 1 mU/g body weight after 4h fasting) and GTT (glucose 1.5 g/kg body weight after 14h fasting) with MNADK-KO and WT mice (n = 6). Data are presented as mean ± SEM. Mean values were compared by unpaired 2-tailed Student's t-test. , P < 0.05. (C-D) The area under curve (AUC) for GTT and ITT of MNADK-KO and WT control mice. The Integrate module in the software Origin (OriginLab, Northampton, MA) was used to calculate the AUC. (E) Serum levels of insulin of MNADK-KO and WT mice (n = 6). (F) Gains of weights, including body weight (BW), fat mass, and lean mass, of MNADK-KO and WT mice, determined by calculating the increases of body composition mass of the mice after 3-week HFD vs before HFD. Data are presented as mean ± SEM (n = 6). , P < 0.05. (G) 24h-food intake of MNADK-KO and WT control mice.
Figure 3
Figure 3
MNADK-KO mice display decreased fat oxidation along with increased RER and decreased energy expenditure in response to endurance exercise. (A) Fat oxidation, (B) carbohydrate/glucose oxidation, (C) RER, (D) VO2, (E) energy expenditure, (F–I) running time (F), distance (G), work joule (H) and VO2max (I) during an exhaustive treadmill running test for MNADK-KO and WT control mice after HFD, determined by indirect calorimetry using CLAMS. The animals ran on the treadmill, and VO2 and VCO2 were monitored continuously. Exhaustion was qualified by a mouse sitting on the shocker for 5 s, at which the shocker was shut off, the treadmill schedule was stopped, and 15 min of recovery data were recorded. VO2max was defined as a plateau of the oxygen uptake despite increasing running speed. VO2 and VCO2 values were normalized to lean body mass (LBM). n = 6 WT or 4 KO male mice. ∗P ≤ 0.05. Data are presented as mean ± SEM.
Figure 4
Figure 4
MNADK-KO mice exhibit decreased fat oxidation but increased RER in response to fasting. (A) Fat oxidation, (B) carbohydrate/glucose oxidation (C) RER, and (D) energy expenditure (EE) in the HFD-fed MNADK-KO and WT control mice determined by indirect calorimetry using CLAMS. The graphs show quantifications of fat oxidation, carbohydrate oxidation, RER, and energy expenditure in MNADK-KO and WT mice during the nighttime (6 PM–6 AM) and daytime (6 AM–6 PM) under feeding or in response to fasting challenge. Data are presented as mean ± SEM (n = 6 WT or 4 KO male mice). ∗∗P ≤ 0.01. (E-J) Mitochondrial bioenergetic profiling of MNADK-KO and WT mouse primary hepatocytes. The mitochondrial bioenergetic profiles of hepatocytes were determined by measuring oxygen consumption rate (OCR) using XFe96 Seahorse technology. Mito Stress Test was performed using a sequential injection of oligomycin (1.5 μM), FCCP (1 μM), and rotenone/Antimycin (1 μM each). Basal mitochondrial OCR was normalized by subtracting non-mitochondrial OCR obtained after adding rotenone/Antimycin; R/A, rotenone/Antimycin. Basal OCR (F), Maximal OCR (G), spare respiratory capacity calculated as percentages (H), proton leak OCR (I), and ATP-linked OCR (J) are determined. Seahorse data are presented as mean ± SEM (n = 9–12). ∗∗P ≤ 0.01, ns, non-significant.
Figure 5
Figure 5
MNADK deficiency leads to decreased mitochondrial NADP(H) levels and MNADK activity, increased cellular ROS, and decreased protein levels of metabolic regulators in mouse livers under the atherogenic HFD for 3 weeks. (A) Levels of mitochondrial and cytosolic NADP(H) in the livers of MNADK-KO and WT mice under normal chow (NC). Data are presented as mean ± SEM. ∗∗p ≤ 0.01 (n = 6). (B) Levels of mitochondrial and cytosolic NADP(H) in the livers of WT mice under NC or atherogenic HFD. ∗P ≤ 0.05 (n = 6). (C) Activities of MNADK in the livers of WT mice under NC or HFD. ∗∗p ≤ 0.01 (n = 6). (D) Levels of ROS, determined by DHE staining, in the livers of MNADK-KO and WT control mice under NC or HFD. (E) [GSH] levels and [GSH]/[GSSG] ratios in the livers of MNADK-KO and WT mice under NC or HFD (n = 3–5 mice per group). [GSH] and [GSH]/[GSSG] ratios were determined by [GSH]/[GSSG] ratio detection assay kit (Abcam, Inc.) (F-G) Levels of CREBH (precursor and activated forms), PPARα, PGC1α, SIRT1, SIRT3, NAMPT, MNADK, and GAPDH in the livers of MNADK-KO and WT control mice under NC or HFD, determined by Western blot analyses. The graphs show the fold changes of individual protein levels, determined by Western blot densitometry, in MNADK-KO or WT control mouse livers under NC or HFD. Fold change of the normalized protein levels was calculated by comparing to the level in one of WT mice under NC. The bars denote mean ± SEM (n = 3 experimental replicates). ∗P ≤ 0.05, ∗∗P ≤ 0.01.
Figure 6
Figure 6
MNADK deficiency leads to increased acetylation but decreased protein levels of metabolic regulators in mouse livers. (A) Levels of mitochondrial and cytosolic NAD(H) in the livers of WT mice under normal chow (NC) or atherogenic HFD. Data are presented as mean ± SEM. ∗P ≤ 0.05 (n = 6). (B) Levels of NAD(H) in the livers of MNADK-KO and WT mice. ∗∗p ≤ 0.01 (n = 6). (C) Acetylated and total protein levels of PPARα, PGC1α, and CREBH in the livers of MNADK-KO and WT control mice under normal chow (NC) or HFD, determined by Western blot analyses. The representative images were shown. (D) The graphs show the fold changes of individual acetylated or total protein levels of PPARα, PGC1α, and CREBH, determined by Western blot densitometry, in MNADK-KO or WT mouse livers under NC or HFD. Fold change of the normalized protein levels was calculated by comparing to the level in one of WT mice under NC. The bars denote mean ± SEM (n = 3 experimental replicates). ∗P ≤ 0.05, ∗∗P ≤ 0.01.
Figure 7
Figure 7
HFD compromises MNADK by S-nitrosylation (SNO) modification of the protein in mouse livers. (A) The conserved SNO site within the diacylglycerol kinase catalytic domain of MNADK proteins across the species. (B) 3-D structure of human MNADK. NAD+ (sticks) binds to the catalytic pocket (PDB code: 7N29) [65]. Red denotes the conserved region RSEGHLCLPVRYT, where the Cysteine residue that undergoes SNO is highlighted with green. (C-D) Quantitative staining of S-nitrosylated MNADK protein in NC–or HFD-fed mouse livers. Representative images (63 × ) of staining for SNO (green fluorescence) and MNADK (red fluorescence) in the livers from NC- and HFD-fed mice were shown. Panel C shows the quantification of colocalizations (co-efficiency) of SNO-MNADK in the livers of NC- and HFD-fed mice. ∗P < 0.05 (n = 6). (E) Levels of MNADK in the livers of WT mice under NC or HFD, determined by Western blot analyses. The graphs show the fold changes of total MNADK protein, determined by Western blot densitometry, in WT mouse livers under NC or HFD. The bars denote mean ± SEM (n = 3). ∗P ≤ 0.05. (F) Domain structure and mutation of SNO-resistant human MNADK variant. DAGK, diacylglycerol kinase domains. (G) Expression levels of MNADK in the livers of MNADK-KO mice intravenously injected with AAV8 expressing GFP, MNADK-WT, or MNADK-S193, determined by Western blot analysis. (H–I) Oil-red O staining (H) and hepatic TG and FA enzymatic assays (I) with liver tissues of HFD-fed MNADK-KO mice receiving AAV8-MNADK-WT or AAV8-MNADK-S193. Data are presented as mean ± SEM. ∗p ≤ 0.05; ∗∗P ≤ 0.01. (For interpretation of the references to color/colour in this figure legend, the reader is referred to the Web version of this article.)
Figure 8
Figure 8
S-nitrosylation (SNO) modification of MNADK protein represents a suppressive regulation of MNADK activity in primary hepatocytes. (A) Expression of MNADK in the primary hepatocytes isolated from WT mice intravenously administrated with AAV8 expressing MNADK-WT or MNADK-S193 for 2 weeks, determined by Western blot analysis. Mouse primary hepatocytes expressing LacZ were included as the control. (B–F) Mitochondrial bioenergetic profiling of primary hepatocytes from WT mice administered with AAV8 expressing MNADK-WT and the SNO-resistant form of MNADK, MNADK-S193, respectively, for 2 weeks, and then subjected to profiling of mitochondrial bioenergetics, within 24-h in vitro culture, by analyzing oxygen consumption rates (OCR) using XFe96 Seahorse technology. Mito Stress Test was performed using a sequential injection of oligomycin (1.5 μM), FCCP (1 μM), and rotenone/Antimycin (1 μM each). Basal mitochondrial OCR was normalized by subtracting non-mitochondrial OCR obtained after adding rotenone/Antimycin; R/A, rotenone/Antimycin. Basal OCR (C), Maximal OCR (D), spare OCR (E), and ATP-linked OCR (F) are determined. Seahorse data are presented as mean ± SEM (n = 12). ∗∗P ≤ 0.01. (G-K) Mitochondrial bioenergetic profiling of primary hepatocytes from WT mice transduced with AAV8 expressing MNADK-WT (WT) or MNADK-S193 (S193) after the treatment of a combination of palmitate (PA) (200 μM) and TGFβ1 (10 ng/mL) for 24 h. Seahorse data are presented as mean ± SEM (n = 12). ∗P ≤ 0.05; ns, non-significant. (L) Levels of TG in mouse primary hepatocytes expressing MNADK-WT or MNADK-S193 treated with PA (200 μM) plus TGFβ1 (10 ng/mL) in the presence or absence of 1400W (40 μM) for 24 h Data are presented as mean ± SEM (n = 3 replicates). ∗P ≤ 0.05.
Figure 9
Figure 9
Illustration of the pathways by which MNADK regulates energy metabolism through controlling mitochondrial NADP(H) and cellular ROS. T2DM, type-2 diabetes mellitus; NAFLD, non-alcoholic fatty liver disease; HCC, hepatocellular carcinoma.

Similar articles

Cited by

References

    1. Williamson D.H., Lund P., Krebs H.A. The redox state of free nicotinamide-adenine dinucleotide in the cytoplasm and mitochondria of rat liver. Biochemical Journal. 1967;103(2):514–527. - PMC - PubMed
    1. Imai S., Armstrong C.M., Kaeberlein M., Guarente L. Transcriptional silencing and longevity protein Sir2 is an NAD-dependent histone deacetylase. Nature. 2000;403(6771):795–800. - PubMed
    1. Houten S.M., Denis S., Te Brinke H., Jongejan A., van Kampen A.H., Bradley E.J., et al. Mitochondrial NADP(H) deficiency due to a mutation in NADK2 causes dienoyl-CoA reductase deficiency with hyperlysinemia. Human Molecular Genetics. 2014;23(18):5009–5016. - PubMed
    1. Circu M.L., Aw T.Y. Reactive oxygen species, cellular redox systems, and apoptosis. Free Radical Biology and Medicine. 2010;48(6):749–762. - PMC - PubMed
    1. Pollak N., Niere M., Ziegler M. NAD kinase levels control the NADPH concentration in human cells. Journal of Biological Chemistry. 2007;282(46):33562–33571. - PubMed

Publication types