. 2023 Mar;72(3):522-534.
doi: 10.1136/gutjnl-2021-326550. Epub 2022 Aug 9.

Molecular heterogeneity and commonalities in pancreatic cancer precursors with gastric and intestinal phenotype

Affiliations

Molecular heterogeneity and commonalities in pancreatic cancer precursors with gastric and intestinal phenotype

Sven-Thorsten Liffers et al. Gut. 2023 Mar.

Abstract

Objective: Due to the limited number of modifiable risk factors, secondary prevention strategies based on early diagnosis represent the preferred route to improve the prognosis of pancreatic ductal adenocarcinoma (PDAC). Here, we provide a comparative morphogenetic analysis of PDAC precursors aiming at dissecting the process of carcinogenesis and tackling the heterogeneity of preinvasive lesions.

Design: Targeted and whole-genome low-coverage sequencing, genome-wide methylation and transcriptome analyses were applied on a final collective of 122 morphologically well-characterised low-grade and high-grade PDAC precursors, including intestinal and gastric intraductal papillary mucinous neoplasms (IPMN) and pancreatic intraepithelial neoplasias (PanIN).

Results: Epigenetic regulation of mucin genes determines the phenotype of PDAC precursors. PanIN and gastric IPMN display a ductal molecular profile and numerous similarly regulated pathways, including the Notch pathway, but can be distinguished by recurrent deletions and differential methylation and, in part, by the expression of mucin-like 3. Intestinal IPMN are clearly distinct lesions at the molecular level with a more instable genotype and are possibly related to a different ductal cell compartment.

Conclusions: PDAC precursors with gastric and intestinal phenotype are heterogeneous in terms of morphology, genetic and epigenetic profile. This heterogeneity is related to a different cell identity and, possibly, to a different aetiology.

Keywords: gene expression; gene mutation; pancreatic pathology; pancreatic tumours; pre-malignancy - GI tract.


Conflict of interest statement

Competing interests: None declared.

Figures

Figure 1
Figure 1
Intraductal precursors of pancreatic cancer: morphology and genetics. (A) Morphology and immunohistochemistry: PanIN and gastric IPMN are distinguished according to morphology and size and display an identical immunohistochemical profile with diffuse positivity for MUC5AC and no expression of MUC1 and MUC2. Intestinal IPMN are clearly distinct lesions, both on the morphological and immunohistochemical level, characterised by positivity for MUC2 and MUC5AC. H&E and immunohistochemistry (see ‘Materials and methods’ section; scale bar=200 µm). (B) Targeted-next-generation sequencing analysis: low-grade and high-grade PanIN, gastric IPMN and intestinal IPMN were included in the analysis. Cases with a concomitant PDAC are indicated with a black square and those with associated PDACs are marked in addition with a white X. Labelled mutations represent pathogenic mutations according to the ClinVar database and/or the American College of Medical Genetics and Genomics guidelines with an allele frequency of ≥3%. Red squares represent missense mutations, grey squares are nonsense mutations and blue squares are frameshift mutations. Empty squares indicate absence of pathogenic mutations. Analysis was performed using a 21-gene custom panel on the S5 Ion Torrent platform (Phred score ≥30, coverage ≥500). IPMN, intraductal papillary mucinous neoplasms; MUC1, mucin 1; MUC2, mucin 2; MUC5AC, mucin 5; PanIN, pancreatic intraepithelial neoplasias; PDAC, pancreatic ductal adenocarcinoma.
Figure 2
Figure 2
Copy number variation (CNV) in PanIN, gastric and intestinal IPMN. CNVs were detected in PanIN and IPMN over the whole-genome by low-coverage sequencing. Regions in red show copy number gains and regions in blue represent copy number losses. (A) PanIN (n=11, 9 low-grade and 2 high-grade) do not possess repeated or larger regions of CNV; (B) gastric IPMN (n=13, 9 low-grade and 4 high-grade lesions) reveal three distinct repeated regions of copy number loss at chromosome 6, 9 and 18; (C) intestinal IPMN (n=4, 2 low-grade and 2 high-grade) had the highest frequency of chromosomal alterations. The broad genomic alterations generally involve entire chromosomes and are mostly located on chromosome 7, 8, 12, 18 and 20 (dark grey background=high-grade lesions, light grey background=low-grade lesions; log2 value, threshold±0.2). IPMN, intraductal papillary mucinous neoplasms; PanIN, pancreatic intraepithelial neoplasias.
Figure 3
Figure 3
DNA methylation profiling of normal pancreas cells and PDAC precursor lesions. (A) Multidimensional scaling based on the 5000 most variable CpG probes. (B) Scatter plots showing pairwise comparisons of methylated probes between indicated precursor lesions and cell types. Significantly hypermethylated probes (delta beta ≥0.2; adjusted p value ≤0.05) are coloured in red and hypomethylated (delta beta ≤−0.2; adjusted p value ≤0.05) in blue, respectively. (C) KEGG pathway enrichment analysis of differentially methylated probes between IPMN and PanIN. (D) Phylogenetic tree displaying the relationship between precursor lesions and pancreatic cell types based on DNA methylation data. ABC, ATP-binding cassette; ECM, extracellular matrix; gIPMN, gastric IPMN; iIPMN, intestinal IPMN; IPMN, intraductal papillary mucinous neoplasms; PanIN, pancreatic intraepithelial neoplasias; PDAC, pancreatic ductal adenocarcinoma; TRP, transient receptor potential.
Figure 4
Figure 4
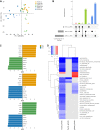
Transcriptomics-based comparative analysis of precursor lesions. (A) Principal component analysis with the 500 most variable genes displaying a precursor-specific clustering. (B) Upset plot summarised the differentially expressed genes between the three precursors. (C) The precursor-specific activation of transcription factors detected by VIPER analysis based on group-wise comparisons. (D) Single sample gene set enrichments analysis indicates precursor-specific activation of hallmark of cancer gene sets from the MSigDB collection. gIPMN, gastric IPMN; iIPMN, intestinal IPMN; IPMN, intraductal papillary mucinous neoplasms; NES, normalised enrichment score; PanIN, pancreatic intraepithelial neoplasias.
Figure 5
Figure 5
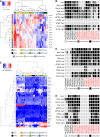
Identification of different precursor subtype-specific markers. (A) Hierarchical clustering of RNA sequencing data based on published marker genes for distinct normal pancreas cell populations. (B) Mean CpG methylation of all TFF3 annotated probes. CpGs located in the coding region are coloured in red (unmethylated: mean β-value <0.4; intermediate: mean β-value >0.4 and <0.6; methylated: mean β-value >0.6). (C) Hierarchical clustering displaying the expression of genes involved in the Mucin type O-glycan biosynthesis and mucins expressed in precursor lesions. (D, E) Mean CpG methylation of the first 20 MUC2 (D) and MUCL3 (E) annotated probes. CpGs located in the coding region are coloured in red (unmethylated: mean β-value <0.4; intermediate: mean β-value >0.4 and <0.6; methylated: mean β-value >0.6). gIPMN, gastric IPMN; iIPMN, intestinal IPMN; IPMN, intraductal papillary mucinous neoplasms; PanIN, pancreatic intraepithelial neoplasias; PDAC, pancreatic ductal adenocarcinoma; TFF3, trefoil factor 3.
Figure 6
Figure 6
Model of development of pancreatic cancer precursors. KRAS mutations induce a gastric phenotype characteristic of mostly peripherally located lesions, such as PanIN and gastric IPMN, which are additionally Notch-dependent. Recurrent deletions occur only in gastric IPMN. These share a very similar mucin profile with PanIN, but they can be distinguished to some extent by different MUCL3 expression, with lack of expression arguing against gastric IPMN. Further stimuli, such as exogenous factors related to a different microenvironment and possibly acting on a minor MUC5B-positive ductal cell population, induce an intestinal phenotype, driven by KRAS and/or GNAS mutations, with differential regulation of the mucin type O-glycan biosynthesis, expression of MUC2, CDX2 and TFF3 and recurrent amplifications. Mixed phenotypes and/or a transition from a gastric to an intestinal phenotype may also occur. CNV, copy number variation; IPMN, intraductal papillary mucinous neoplasms; MUC1, mucin 1; MUC2, mucin 2; MUC5AC, mucin 5; PanIN, pancreatic intraepithelial neoplasias; TFF3, trefoil factor 3.

References

    1. American Cancer Society . Cancer facts & figures. Atlanta, 2020. - PMC - PubMed
    1. Kleeff J, Korc M, Apte M, et al. Pancreatic cancer. Nat Rev Dis Primers 2016;2:16022. 10.1038/nrdp.2016.22 - DOI - PubMed
    1. Balachandran VP, Łuksza M, Zhao JN, et al. Identification of unique neoantigen qualities in long-term survivors of pancreatic cancer. Nature 2017;551:512–6. 10.1038/nature24462 - DOI - PMC - PubMed
    1. Stark AP, Sacks GD, Rochefort MM, et al. Long-Term survival in patients with pancreatic ductal adenocarcinoma. Surgery 2016;159:1520–7. 10.1016/j.surg.2015.12.024 - DOI - PMC - PubMed
    1. Strobel O, Lorenz P, Hinz U, et al. Actual five-year survival after upfront resection for pancreatic ductal adenocarcinoma. Ann Surg 2022;275:962–71. 10.1097/SLA.0000000000004147 - DOI - PubMed

Publication types