. 2022 Oct;34(41):e2204957.
doi: 10.1002/adma.202204957. Epub 2022 Sep 9.

Massively Parallel Selection of NanoCluster Beacons

Affiliations

Massively Parallel Selection of NanoCluster Beacons

Yu-An Kuo et al. Adv Mater. 2022 Oct.

Abstract

NanoCluster Beacons (NCBs) are multicolor silver nanocluster probes whose fluorescence can be activated or tuned by a proximal DNA strand called the activator. While a single-nucleotide difference in a pair of activators can lead to drastically different activation outcomes, termed polar opposite twins (POTs), it is difficult to discover new POT-NCBs using the conventional low-throughput characterization approaches. Here, a high-throughput selection method is reported that takes advantage of repurposed next-generation-sequencing chips to screen the activation fluorescence of ≈40 000 activator sequences. It is found that the nucleobases at positions 7-12 of the 18-nucleotide-long activator are critical to creating bright NCBs and positions 4-6 and 2-4 are hotspots to generate yellow-orange and red POTs, respectively. Based on these findings, a "zipper-bag" model is proposed that can explain how these hotspots facilitate the formation of distinct silver cluster chromophores and alter their chemical yields. Combining high-throughput screening with machine-learning algorithms, a pipeline is established to design bright and multicolor NCBs in silico.

Keywords: NanoCluster Beacons; fluorescent nanomaterials; high-throughput screening; next-generation sequencing; silver nanoclusters.


Conflict of interest statement

Competing interests

The authors declare no competing interests.

Figures

Figure 1.
Figure 1.
Massively parallel selection of NanoCluster Beacons (NCBs) using MiSeq chips. A) The interactions between a silver nanocluster (AgNC, left) and a proximal guanine-rich activator (middle) activate the fluorescence of AgNC by hundreds to thousands fold, creating an activated NCB (right). Here, a common C55 nanocluster (NC) probe is used for NCB selection and optimization. G15 is the canonical activator for yellow-orange NCB. B) C55 NC probe before and after activation by G15 activator, under UV excitation (365 nm). C) Workflow of our high-throughput NCB selection on a next-generation sequencing chip (NGS; MiSeq, Illumina). After sequencing a library of activators (> 12,000) on the MiSeq chip, unwanted adapter sequence above the activator was cleaved by a restriction enzyme. The Alexa488-tagged fiducial marker probes and the C55 probes were then injected into the chip to hybridize with the PhiX markers and the library, and imaged sequentially under an epi-fluorescence microscope. A custom bioinformatics and imaging processing pipeline was employed to identify activator sequences behind each activated NCB spot. After ranking all activators based on their median intensity (baseline corrected) on the chip surface, we could clearly differentiate strong activators from weak ones in the yellow-orange (Ex/Em: 535/50, 605/70 nm) and red (Ex/Em: 620/60, 700/75 nm) emission channels. Here G15 and G12 were the standards (the known best NCBs) for the yellow-orange and red NCB comparisons, respectively. G15 and G12 were both ranked within top 7% among the yellow-orange and red NCBs in library_1. D) Twenty activators from the 827 activators that were brighter than G12 (ranked 828th) and twenty activators from the 11,458 activators that were darker than G12 were investigated in test tubes using traditional florometry. The MiSeq results were 85% accurate in both true positive (TP) and true negative (TN) selections. Definition of the improvement ratio can be found in the methods. E) 2D spectra of the four representative NCBs in the yellow-orange (orange dashed box) and red (white dashed box) emission channels. Through florometry characterization, we found yAct1 2.03-fold brighter than G15 and rAct1 2.94-fold brighter than G12. Intensities were calculated based on a volumetric integral shown in Figure S2. F) Plate-reader images acquired using yellow-orange (top) and red (bottom) excitation/emission filter sets, and the sequences of the four representative bright NCBs.
Figure 2.
Figure 2.
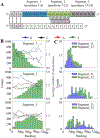
Influence of activator mutations on red NCB brightness. A) Schematic of NCB construct and definition of nucleobase positions in the activator. B) Histograms of the brightness rankings corresponding to the mutated segments and the average numbers of the 4 nucleobases in the mutated segments. The library_1 results clearly indicated that, to make a bright NCB, segment_2 (the middle 6 nucleobases, positions 7–12) prefers the canonical G-rich sequence, as randomizing segment_2 (while keeping segment_1 and _3 canonical) leads to many low-ranking NCBs in both emission channels. Each histogram here contained 4,096 activators. C) Stacked histograms further demonstrated that segment_22 (positions 10–12) is more important than segment_21 (positions 7–9) in creating bright red NCBs.
Figure 3.
Figure 3.
Substitution hotspots to generate polar opposite twins (POTs) revealed by MiSeq chip selection. A) Schematic of the zipper bag model. The blue box represents the “zipper” location (e.g., positions 4–6 for yellow-orange POTs) and the gray box represents the “bag” location (i.e., the critical zone at positions 7–12). When the zipper does not seal well, the bag is leaky, thus leading to a low chemical yield and dimmer NCB. B) Plate-reader images acquired using yellow-orange (top) and red (bottom) excitation/emission filter sets and the sequences of the representative POTs. Large differences in fluorescence enhancement ratios were seen in these twin NCBs (C55+yPOT5 vs. C55+yPOT6 for yellow-orange channel, and C55+rPOT5 vs. C55+rPOT6 for red channel), making them POTs. yPOT5: CAGTGAGGTGGGGTGGGG; yPOT6: CAGTCAGGTGGGGTGGGG; rPOT5: AATCCTGGTGGGGTGGGG; rPOT6: AATTCTGGTGGGGTGGGG. C) 2D spectra of the representative POTs in the yellow-orange (orange dashed box) and red (white dashed box) emission channels. D) Heat maps of the top 2,000 twin NCB pairs in library_1. Here the x-axis and the y-axis represent bright to dark conversion in these twin NCBs. These heat maps clearly indicated that the nucleobases in positions 4–6 are critical for creating yellow-orange POTs, while the positions 2–4 are critical for creating red POTs. E) The POT difference ratios of five representative yellow-orange (left) and red (right) pairs of POTs in the two emission channels. Through fluorometry characterization, the yPOT5-yPOT6 pair and the rPOT5-rPOT6 pair were identified as the most extreme yellow-orange and red POTs, respectively, reaching POT difference ratios as high as 31 and 9. Definition of the POT difference ratio can be found in the methods. Error bars: mean ± s.d. in logarithmic scale, with 3 repeats for each pair of POTs.
Figure 4.
Figure 4.
In silico design of bright yellow-orange and red NCBs based on machine learning results. A) From the chip selection results, we labeled the top 30% NCBs as ‘bright’ class and the bottom 30% as ‘dark’ class. The sequence features of these selected NCBs were then extracted by MERCI and selected by Weka. The resulting feature vectors thus defined the location of individual activators in the high-dimensional space. Several machine learning models were tested for activator classification, among which the logistic regression had the best performance. B) Forty new activators were designed in silico and tested by fluorometry. Using 640 nm as the cutoff, the stacked histogram of NCB emission peaks showed two color bands. While three out of the 20 yellow-orange NCB candidates (y-o NCBs) showed low emission (enhancement ratio less than 66, Table S11 and Table S12B) or red emission (achieving 85% test-tube validation accuracy), five out of the 20 red NCB candidates showed either low emission (enhancement ratio less than 145, Table S10 and Table S12A) or yellow-orange emission peak. Hatched bars represent the failed designs with low emission. Empty bars represent the failed designs with wrong emission peaks. Dashed vertical line represents 640 nm. C) Plate-reader images acquired using yellow-orange (top) and red (bottom) excitation/emission filter sets, and the activator sequences of the two successfully predicted NCBs.

Similar articles

Cited by

References

    1. Kobayashi H, Ogawa M, Alford R, Choyke PL, Urano Y, Chem Rev 2010, 110, 2620; - PMC - PubMed
    2. Chinen AB, Guan CM, Ferrer JR, Barnaby SN, Merkel TJ, Mirkin CA, Chem Rev 2015, 115, 10530. - PMC - PubMed
    1. Rajendran M, Ellington AD, Nucleic Acids Res 2003, 31, 5700. - PMC - PubMed
    1. Yeh HC, Sharma J, Han JJ, Martinez JS, Werner JH, Nano Letters 2010, 10, 3106. - PubMed
    1. Obliosca JM, Babin MC, Liu C, Liu YL, Chen YA, Batson RA, Ganguly M, Petty JT, Yeh HC, ACS Nano 2014, 8, 10150. - PMC - PubMed
    1. Yeh H-C, Sharma J, Han JJ, Martinez JS, Werner JH, IEEE Nanotechnology Magazine 2011, 5, 28.

LinkOut - more resources