

Tracing the origin of Severe acute respiratory syndrome coronavirus-2 (SARS-CoV-2): A systematic review and narrative synthesis
- PMID: 35945190
- PMCID: PMC9538017
- DOI: 10.1002/jmv.28060
Tracing the origin of Severe acute respiratory syndrome coronavirus-2 (SARS-CoV-2): A systematic review and narrative synthesis
Abstract
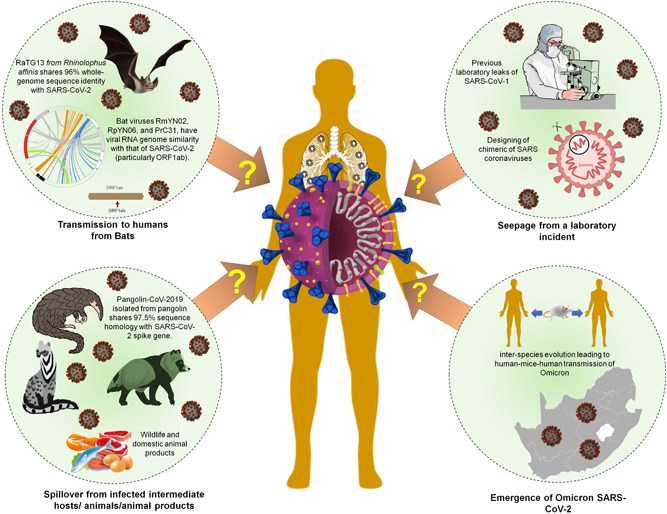
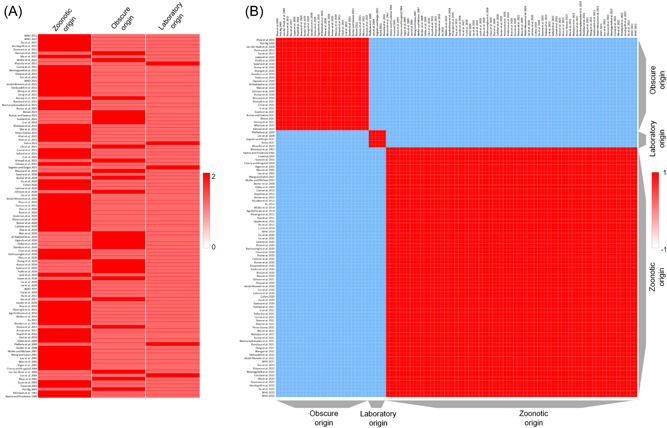
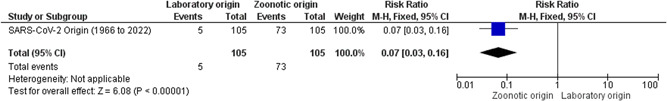
The aim of the study was to trace and understand the origin of Severe acute respiratory syndrome coronavirus 2 (SARS-CoV-2) through various available literatures and accessible databases. Although the world enters the third year of the coronavirus disease 2019 pandemic, health and socioeconomic impacts continue to mount, the origin and mechanisms of spill-over of the SARS-CoV-2 into humans remain elusive. Therefore, a systematic review of the literature was performed that showcased the integrated information obtained through manual searches, digital databases (PubMed, CINAHL, and MEDLINE) searches, and searches from legitimate publications (1966-2022), followed by meta-analysis. Our systematic analysis data proposed three postulated hypotheses concerning the origin of the SARS-CoV-2, which include zoonotic origin (Z), laboratory origin (L), and obscure origin (O). Despite the fact that the zoonotic origin for SARS-CoV-2 has not been conclusively identified to date, our data suggest a zoonotic origin, in contrast to some alternative concepts, including the probability of a laboratory incident or leak. Our data exhibit that zoonotic origin (Z) has higher evidence-based support as compared to laboratory origin (L). Importantly, based on all the studies included, we generated the forest plot with 95% confidence intervals (CIs) of the risk ratio estimates. Our meta-analysis further supports the zoonotic origin of SARS/SARS-CoV-2 in the included studies.
Keywords: COVID-19; MERS-CoV; SARS-CoV; SARS-CoV-2; laboratory incidence; origin; zoonotic.
© 2022 Wiley Periodicals LLC.
Conflict of interest statement
The authors declare no conflict of interest.
Figures
Similar articles
-
An updated review of the scientific literature on the origin of SARS-CoV-2.Environ Res. 2022 Dec;215(Pt 1):114131. doi: 10.1016/j.envres.2022.114131. Epub 2022 Aug 28. Environ Res. 2022. PMID: 36037920 Free PMC article. Review.
-
Human and novel coronavirus infections in children: a review.Paediatr Int Child Health. 2021 Feb;41(1):36-55. doi: 10.1080/20469047.2020.1781356. Epub 2020 Jun 25. Paediatr Int Child Health. 2021. PMID: 32584199 Review.
-
The SARS-CoV-2 origin dilemma: Zoonotic transfer or laboratory leak?Bioessays. 2022 Jan;44(1):e2100189. doi: 10.1002/bies.202100189. Epub 2021 Nov 22. Bioessays. 2022. PMID: 34812505 Free PMC article.
-
Use of a risk assessment tool to determine the origin of severe acute respiratory syndrome coronavirus 2 (SARS-CoV-2).Risk Anal. 2024 Aug;44(8):1896-1906. doi: 10.1111/risa.14291. Epub 2024 Mar 15. Risk Anal. 2024. PMID: 38488186
-
Outcome of coronavirus spectrum infections (SARS, MERS, COVID-19) during pregnancy: a systematic review and meta-analysis.Am J Obstet Gynecol MFM. 2020 May;2(2):100107. doi: 10.1016/j.ajogmf.2020.100107. Epub 2020 Mar 25. Am J Obstet Gynecol MFM. 2020. PMID: 32292902 Free PMC article.
Cited by
-
Systematic In-Silico Evaluation of the Diagnostic Impact of Mpox Genome Variants in the Current Outbreak.Mol Diagn Ther. 2023 Mar;27(2):275-280. doi: 10.1007/s40291-022-00629-8. Epub 2022 Dec 10. Mol Diagn Ther. 2023. PMID: 36495397 Free PMC article.
-
Pyridine Derivatives as Potential Inhibitors for Coronavirus SARS-CoV-2: A Molecular Docking Study.Bioinform Biol Insights. 2023 Jan 6;17:11779322221146651. doi: 10.1177/11779322221146651. eCollection 2023. Bioinform Biol Insights. 2023. PMID: 37038549 Free PMC article.
References
-
- World Health Organization (WHO) . WHO Coronavirus (COVID‐19) Dashboard. Accessed February 28, 2022. https://covid19.who.int/
-
- Padhi A, Kumar S, Gupta E, Saxena SK. Laboratory diagnosis of novel coronavirus disease 2019 (COVID‐19) infection. In: Saxena S. K., ed. Coronavirus Disease 2019 (COVID‐19): Epidemiology, Pathogenesis, Diagnosis, and Therapeutics. Springer; 2020:95‐107. 10.1007/978-981-15-4814-7_9 - DOI
Publication types
MeSH terms
LinkOut - more resources
Full Text Sources
Medical
Miscellaneous
