. 2022 Aug 9;13(8):696.
doi: 10.1038/s41419-022-05126-8.

Genetic alterations of Keap1 confers chemotherapeutic resistance through functional activation of Nrf2 and Notch pathway in head and neck squamous cell carcinoma

Affiliations

Genetic alterations of Keap1 confers chemotherapeutic resistance through functional activation of Nrf2 and Notch pathway in head and neck squamous cell carcinoma

Syed S Islam et al. Cell Death Dis. .

Abstract

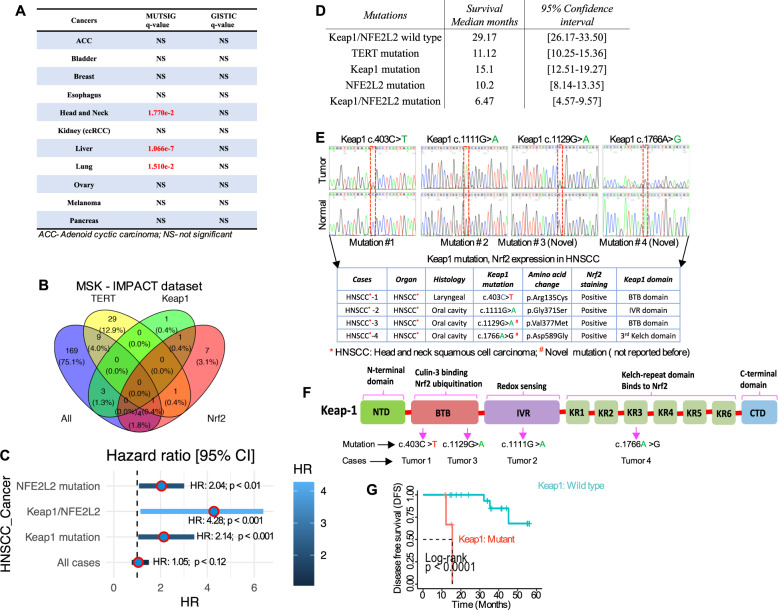
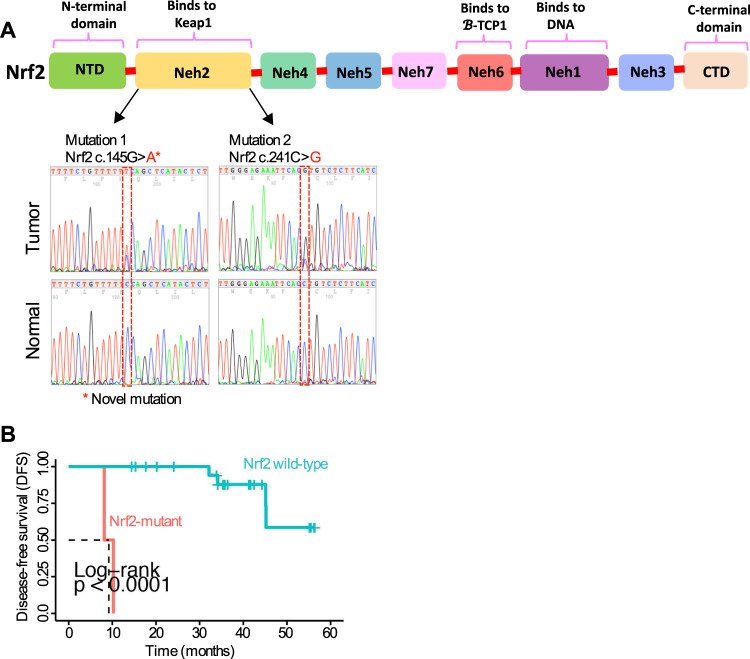
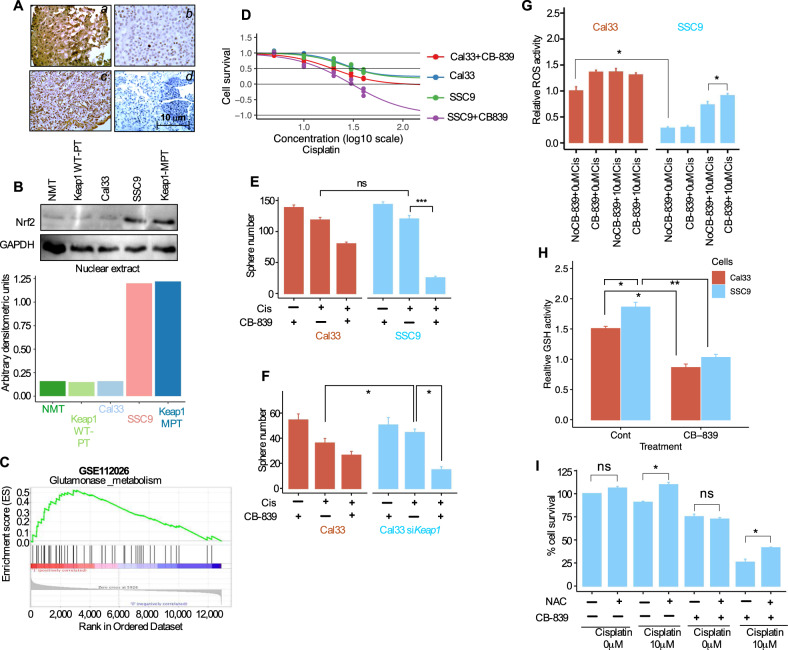
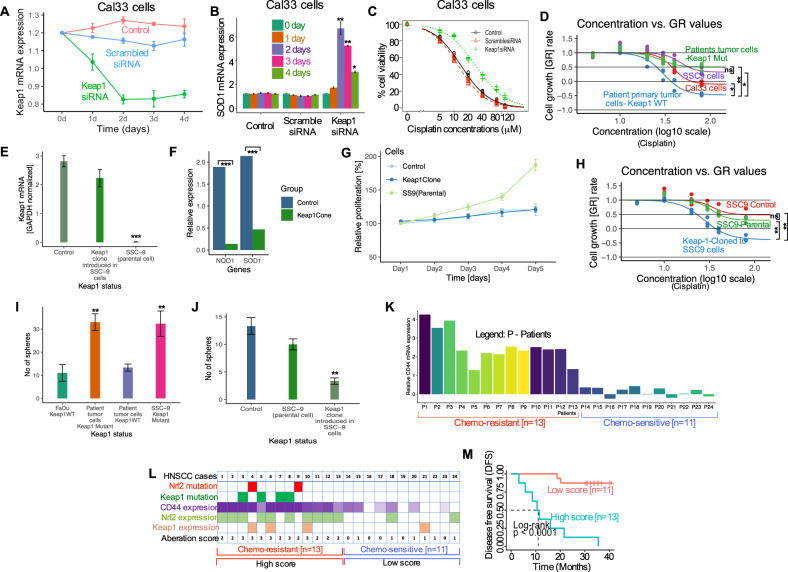
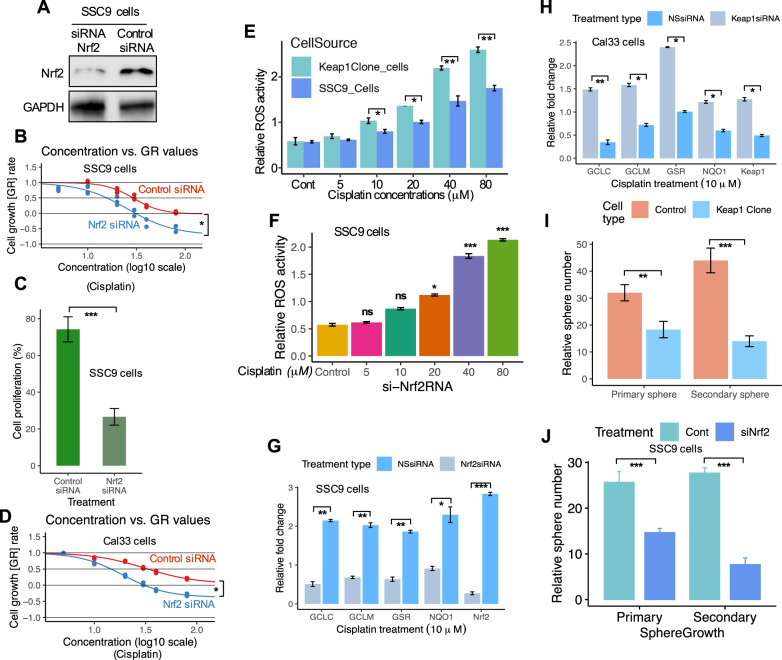
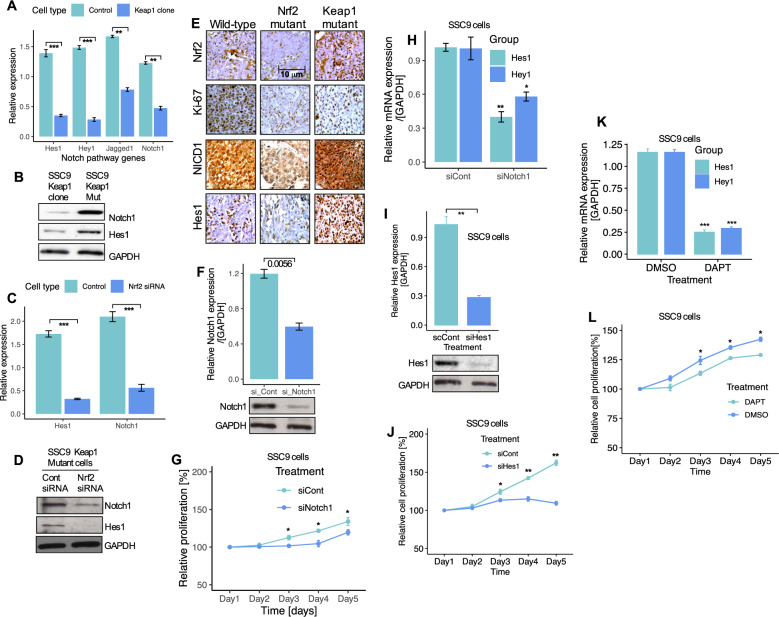
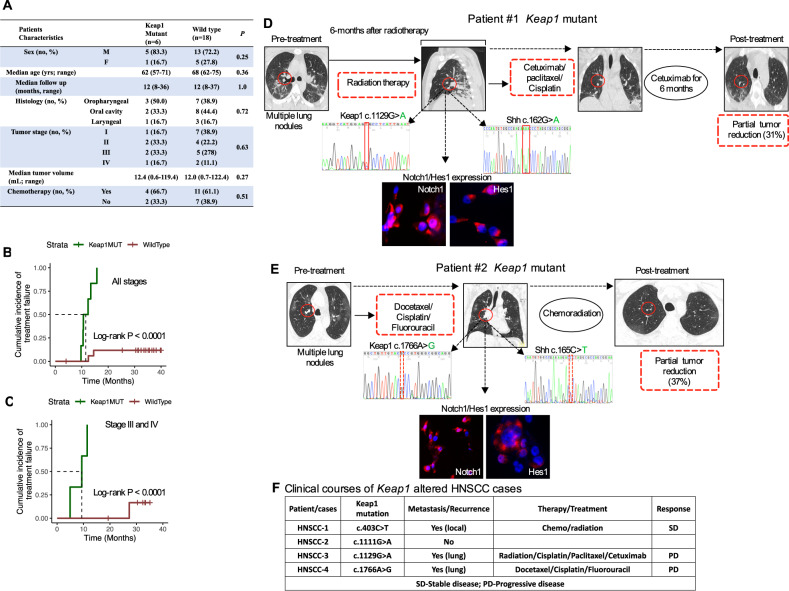
Keap1 mutations regulate Nrf2 activity and lead to chemoresistance in cancers. Yet the underlying molecular mechanisms of chemoresistance are poorly explored. By focusing and genotyping head and neck squamous cell carcinoma (HNSCC) that had available pathologic and clinical data, we provide evidence that Keap1 displays frequent alterations (17%) in HNSCC. Functional loss of Keap1 results in significant activation of Nrf2 and promotes cancer cell growth, proliferation, and elevated cancer stem cell (CSCs) self-renewal efficiency and resistance to oxidative stress. Furthermore, decreased Keap1 activity in these cells increased nuclear accumulation of Nrf2 and activation of the Notch pathway, causing enhanced transcriptional alterations of antioxidants, xenobiotic metabolism enzymes, and resistance to chemotherapeutic treatment. Limiting the Nrf2 activity by either Keap1 complementation or by Nrf2 silencing increased the sensitivity to chemotherapy in Keap1-mutated cells and repressed the CSC self-renewal activity. Our findings suggest that Keap1 mutations define a distinct disease phenotype and the Keap1-Nrf2 pathway is one of the leading molecular mechanisms for clinical chemotherapeutic resistance. Targeting this pathway may provide a potential and attractive personalized treatment strategy for overcoming chemotherapeutic resistance conferred by Keap1 mutations.


Conflict of interest statement

The authors declare no competing interests.

Figures

Fig. 1
Fig. 1. Keap1/NFE2L2 (Nrf2) mutations predict shorter overall survival in patients with HNSCC.
A Alterations of the Keap1 gene in major cancer types from TCGA database. B Venn diagram indicates the number of patients with head and neck cancer in the MISK-IMPACT database that is wild-type for the mutation (green), mutant for TERT (yellow), mutant for Keap1(light blue), and mutant for Nrf2 (purple) (n = 186). C Multivariate Cox regression analysis for each indicated variable was performed. D The risk ratio of overall survival corresponds to each indicated variable. Nrf2 (P < 0.01), Keap1/Nrf2 (p < 0.001) and Keap1 (p < 0.001) mutations are independently identified as significant covariate for overall survival. The table indicates the overall survival across each group with a 95% confidence interval. E Electropherogram depicting Keap1 mutation sequence analysis for HNSCC. The top part shows the detection of the Keap1 mutations identified in HNSCC patients’ tumors and the bottom part shows the non-cancerous normal individuals’ Keap1 sequence. The table below shows the details of each patient and amino acid changes and corresponding Nrf2 positivity. F Schematic diagram of conserved domain showing the structure of Keap1 protein and the location of each mutation within Keap1 protein. NTD N-terminal domain (amino acids), BTB broad complex-Tramtrack-Bric-a-brack, IVR intervening regions, KR Kelch repeat. G Kaplan–Meier disease-free survival analysis curve of Keap1 wild-type and Keap1 mutant HNSCC patients (n = 24; 4-Keap1 mutant and 20- Keap1 wild-type patient) (Log-rank p < 0.0001).
Fig. 2
Fig. 2. Keap1 mRNA expression and concurrent Keap1/Nrf2 mutations in Nrf2 immunopositive HNSCC tumors.
A Electropherogram depicting Nrf2 mutation sequence analysis for head and neck cancer. The top part shows the locations of each mutation within the Nrf2 protein. The bottom part shows the detection of Nrf2 mutation identified in HNSCC patients’ tumors in non-cancerous normal individuals in the Nrf2 sequence. B Kaplan–Meier disease-free survival analysis curve of Nrf2 wild-type and mutant HNSCC patients (n = 24, 2-Nrf2 mutant and 22 Nrf2 wild-type patient) (Log-rank p < 0.0001).
Fig. 3
Fig. 3. The biological effect of Keap1 mutations and Nrf2 overexpression in altered HNSCC tumor cells.
A Immunohistochemical assessment of Nrf2 expression in HNSCC tumor tissues. Part ‘a’ shows the strong nuclear and cytoplasmic Nrf2 expression in the Keap1 mutated patient (patient #3). Part ‘b’ and ‘c’ shows comparatively weaker cytoplasmic and nuclear Nrf2 expression in Keap1-wild-type tissue. Part ‘d’ show negative Nrf2 staining in adjacent normal tissue. B Immunoblot analysis of Nrf2 from nuclear protein in patient’s tumor cells, HNSCC cell lines, and non-malignant tissue. (bottom: Quantification of Nrf2 protein band density after normalizing with GAPDH). NMT: Non-malignant tissue; Keap1-WT-PT: Keap1 wild-type patient tumor; Keap1-MPT: Keap1 mutant patient tumor. C Gene set enrichment analysis (GSEA) of previously defined glutamine metabolism signature using RNA-seq data from GSE112026 data set. D Cell survival of Cal33 (Keap1 wild-type) and SSC9 (Keap1 mutant) cells with or without CB-839 (100 nM, 24-hour pre-treatment) and cisplatin (n = 3). Results were normalized with untreated cells. E Relative number of Spheres of Cal33-Keap1 wild-type and Keap1-mutant SSC9 cells with or without CB-839 (100 nM, 24-hour pre-treatment) and cisplatin (n = 3, 10 μM, n = 3, ***P < 0.001). F Relative number of Spheres of Keap1 wild-type Cal33 cells with or without knockdown of Keap1 by Keap1 specific siRNA in the presence or absence of CB-839 (n = 3, 100 nM, 24-hour pre-treatment) and cisplatin (10 μM, n = 3, *P < 0.05). G Intracellular reactive oxygen (ROS) levels measured by DCFDA intensity via FACS in Cal33 (Keap1 wild-type) and SSC9 (Keap1 mutant) cells with or without CB-839 and cisplatin treatment (n = 3, 10 μM, *P < 0.05). Results were normalized with untreated cells. H GHS (Glutathione) activity analysis of Cal33 (Keap1 wild-type) and SSC9 (Keap1 mutant) cells with or without CB-839 (n = 3, 10 μM, *P < 0.05, **P < 0.01). I Cell survival of SSC9 Keap1 mutant cells treated in the absence or presence of cisplatin (10 μM) or CB-839 and with or without NAC (n = 3, P < 0.05).
Fig. 4
Fig. 4. Loss of Keap1 increases the Nrf2 transcriptional activity, increase cancer stem cell characteristics, and predictor of chemotherapeutic outcome in patients with HNSCC.
A Cal33 cells were transfected with siRNA against Keap1, scrambled, and control for 96 h. Keap1 mRNA was assessed by quantitative RT-PCR. Results expressed as fold-change. B Cal33 cells were transfected as described in A and SOD1 mRNA was assessed by quantitative RT-PCR. C Cells were treated with Keap1 siRNA to knock down the Keap1 gene and assessed the cell viability 72 h after cisplatin treatment in the indicated concentrations in Cal33 cells. Data presented as mean SD of triplicate experiments. D Cell survival at 72 h after cisplatin treatment of indicated HNSCC patient’s primary tumor and HNSCC cell lines (*P < 0.05, **P < 0.01). E qRT-PCR analysis of Keap1 expression in control, Keap1 expressing SSC9 clone and parental SSC9 cells (***P < 0.001). F qRT-PCR analysis of Nrf2 target genes SOD1 and NQO1 in control, Keap1 expressing clone, and parental SSC9 cells (***P < 0.001). G Cell proliferation activity of Keap1 expressing clone, control, and parental SSC9 cells. H Cell survival at 72 h after cisplatin treatment in parental SCC9, mock-transfected and Keap1-expressing clones. I Relative number of tumorspheres generated by the indicated patient’s tumor cells and cell lines. J Relative number of tumorspheres in parental SCC9, mock-transfected, and Keap1-expressing clone (**P < 0.01). K Expression of CD44 in cisplatin-resistant (n = 13) and cisplatin-sensitive (n = 11) HNSCC patients. L Summary of the results for the CD44 expression analysis in the presence of Keap1 or Nrf2 mutations and/or Keap1 or Nrf2 protein expression in each case (n = 24). The number of aberrations in each case was represented as the aberration scores (0, 1, 2, and 3) and all 24 cases were assigned into two groups based on the aberration scores: a “high score group” (n = 13 as aberration score 2 and 3) and low score group (n = 11 as aberration score 1, and 0). M Kaplan–Meier disease-free survival curve for 24 patients was generated according to the aberration score. The high score group was significantly associated with shorter disease-free survival (Log-rank p < 0.0001).
Fig. 5
Fig. 5. Knockdown of Nrf2 in Keap1 defective cells leads to activation of ROS-mediated stress pathway and enhances the chemosensitivity.
A Nrf2 expression in SSC9 cells transfected with control or Nrf2-siRNA. GAPDH was shown as a control. B Cell survival at 72 h after cisplatin treatment in control and Nrf2-siRNA-treated SSC9 cells. C Cell proliferation of SSC9 cells after treatment with control and Nrf2-siRNA. D Cell survival at 72 h after cisplatin treatment in control or Nrf2-siRNA-treated Cal33 cells. E Intracellular ROS level measured by DCFDA staining of SSC9 and Keap1-expressing clone cells. F Intracellular ROS level measured by DCFDA staining of SSC9 cells under the treatment of Nrf2-siRNA and cisplatin. G Silencing of Nrf2 in cisplatin-treated SSC9 cells and analysis of Nrf2-dependent genes. H Inhibition of Keap1 expression by Keap1-siRNA in Cal33 cells and analysis of Nrf2-dependent genes. I Analysis of a relative number of spheres generated in primary and secondary sphere cultures in SSC9 and Keap1 clone cells. J Analysis of a relative number of spheres generated in primary and secondary sphere cultures in Nrf2 knockdown SSC9 cells. Each experiment was repeated in triplicates. Data presents as mean ± SEM (*P < 0.05; **P < 0.01, ***P < 0.001).
Fig. 6
Fig. 6. Nrf2 regulates Notch signaling in HNSCC cells.
A Expression of Notch1 and Notch target genes mRNA in control and Keap1-expressing SSC9 clone cells. B Expression of Notch1 and Hes1 proteins in Keap1-mutant and Keap1-expressing SSC9 cells. C Notch1 and Hes1 mRNA and, D protein expression after Nrf2 knockdown in SSC9 cells. E Immunohistochemistry staining and expression of Nrf2, Ki67, Notch1, and Hes1 in HNSCC clinical samples from wild-type, Nrf2, and Keap1 mutant patients tumor tissues. F Notch1 expression in non-targeting control and Notch1 siRNA-treated SSC9 cells G Cell proliferation of SSC9 cells after knockdown of Notch1 by siRNA. H Relative mRNA expression of Hes1 and Hey1 after Notch1 knockdown in SSC9 cells. I Hes1 mRNA expression and, J Cell proliferation after knockdown of Hes1 siRNA in SSC9 cells. K Effects of Notch inhibitor DAPT and, L Assessment of cell growth after treating the cells with Notch inhibitor DAPT for 5-days. The mRNA expression levels were calculated and normalized relative to GAPDH. All experiments were run in triplicate and compared with the control group. Data presents as mean ± SEM (**P < 0.01, ***P < 0.001).
Fig. 7
Fig. 7. Combination therapy with cetuximab, paclitaxel, and cisplatin led to a partial response in a patient with Keap1 mutant advanced-stage metastatic HNSCC.
A Clinical characteristic of head and neck cancer patient cohort treated with chemotherapy and analyzed for Keap1 and Nrf2 mutation by Sanger sequencing. B, C Association Keap1 mutations and local treatment failure in patients with HNSCC treated with chemotherapy. B Patient cohort and, C Stage III–IV patients who were treated with chemotherapy. D, E Tumor progression in an index patient with lung metastasis was associated with the identification of Keap1 and Shh mutations and tumors from index patients with Keap1 mutant strongly expressed Notch1 and Hes1. In both cases, patients with Keap1 mutations achieved a partial response to 31% and 37% reduction, respectively, in the metastatic lung region upon treatment with two lines of chemoradiation/cetuximab (patient case #1) and three cycles of TPE (docetaxel, cisplatin, and fluorouracil (TPF) followed by chemoradiation with cisplatin treatment (patient case #2). F Clinical courses/outcomes of Keap1 mutant HNSCC patient treated with chemoradiation therapy. SD stable disease, PD progressive disease.

Similar articles

Cited by

References

    1. Sung H, Ferlay J, Siegel RL, Laversanne M, Soerjomataram I, Jemal A, et al. Global cancer statistics 2020: GLOBOCAN estimates of incidence and mortality worldwide for 36 cancers in 185 countries. CA Cancer J Clin. 2021;71:209–49. doi: 10.3322/caac.21660. - DOI - PubMed
    1. Chow LQM. Head and neck cancer. N. Engl J Med. 2020;382:60–72. doi: 10.1056/NEJMra1715715. - DOI - PubMed
    1. López-Verdín S, Lavalle-Carrasco J, Carreón-Burciaga RG, Serafín-Higuera N, Molina-Frechero N, González-González R, et al. Molecular markers of anticancer drug resistance in head and neck squamous cell carcinoma: a literature review. Cancers. 2018;10:376. doi: 10.3390/cancers10100376. - DOI - PMC - PubMed
    1. Drinberg V, Bitcover R, Rajchenbach W, Peer D. Modulating cancer multidrug resistance by sertraline in combination with a nanomedicine. Cancer Lett. 2014;354:290–8. doi: 10.1016/j.canlet.2014.08.026. - DOI - PubMed
    1. Lawrence MS, Sougnez C, Lichtenstein L, Cibulskis K, Lander E, Gabriel SB, et al. Comprehensive genomic characterization of head and neck squamous cell carcinomas. Nature. 2015;517:576–82. doi: 10.1038/nature14129. - DOI - PMC - PubMed

MeSH terms

Substances