

Transferability of genetic loci and polygenic scores for cardiometabolic traits in British Pakistani and Bangladeshi individuals
- PMID: 35945198
- PMCID: PMC9363492
- DOI: 10.1038/s41467-022-32095-5
Transferability of genetic loci and polygenic scores for cardiometabolic traits in British Pakistani and Bangladeshi individuals
Abstract
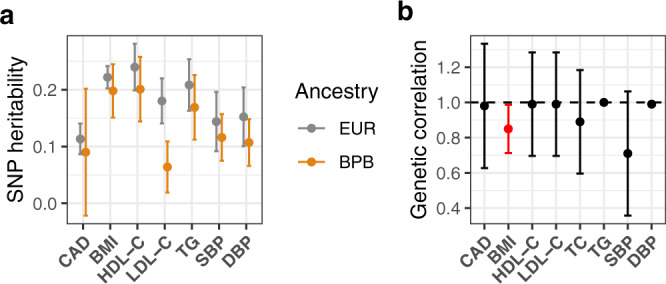
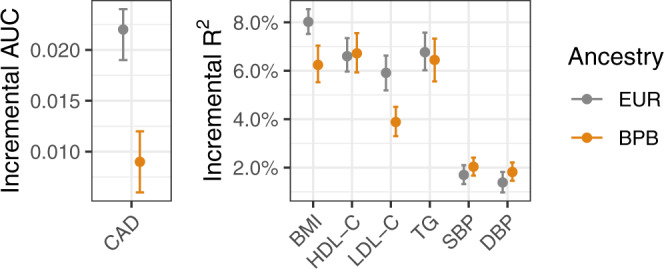
Individuals with South Asian ancestry have a higher risk of heart disease than other groups but have been largely excluded from genetic research. Using data from 22,000 British Pakistani and Bangladeshi individuals with linked electronic health records from the Genes & Health cohort, we conducted genome-wide association studies of coronary artery disease and its key risk factors. Using power-adjusted transferability ratios, we found evidence for transferability for the majority of cardiometabolic loci powered to replicate. The performance of polygenic scores was high for lipids and blood pressure, but lower for BMI and coronary artery disease. Adding a polygenic score for coronary artery disease to clinical risk factors showed significant improvement in reclassification. In Mendelian randomisation using transferable loci as instruments, our findings were consistent with results in European-ancestry individuals. Taken together, trait-specific transferability of trait loci between populations is an important consideration with implications for risk prediction and causal inference.
© 2022. Crown.
Conflict of interest statement
N.S. is now employed by GlaxoSmithKline. All other authors declare no competing interests.
Figures


Similar articles
-
Mendelian randomization analysis of 37 clinical factors and coronary artery disease in East Asian and European populations.Genome Med. 2022 Jun 14;14(1):63. doi: 10.1186/s13073-022-01067-1. Genome Med. 2022. PMID: 35698167 Free PMC article.
-
Common and Rare Genetic Variation in CCR2, CCR5, or CX3CR1 and Risk of Atherosclerotic Coronary Heart Disease and Glucometabolic Traits.Circ Cardiovasc Genet. 2016 Jun;9(3):250-8. doi: 10.1161/CIRCGENETICS.115.001374. Epub 2016 Mar 24. Circ Cardiovasc Genet. 2016. PMID: 27013693 Free PMC article.
-
Genetics of type 2 diabetes and coronary artery disease and their associations with twelve cardiometabolic traits in the United Arab Emirates population.Gene. 2020 Aug 5;750:144722. doi: 10.1016/j.gene.2020.144722. Epub 2020 Apr 30. Gene. 2020. PMID: 32360841
-
Current State and Future of Polygenic Risk Scores in Cardiometabolic Disease: A Scoping Review.Circ Genom Precis Med. 2023 Jun;16(3):286-313. doi: 10.1161/CIRCGEN.122.003834. Epub 2023 Apr 10. Circ Genom Precis Med. 2023. PMID: 37035923
-
Genetics of Coronary Artery Disease.Circ Res. 2016 Feb 19;118(4):564-78. doi: 10.1161/CIRCRESAHA.115.306566. Circ Res. 2016. PMID: 26892958 Review.
Cited by
-
Recent advances in polygenic scores: translation, equitability, methods and FAIR tools.Genome Med. 2024 Feb 19;16(1):33. doi: 10.1186/s13073-024-01304-9. Genome Med. 2024. PMID: 38373998 Free PMC article. Review.
-
Lipid-Associated GWAS Loci Predict Antiatherogenic Effects of Rosuvastatin in Patients with Coronary Artery Disease.Genes (Basel). 2023 Jun 13;14(6):1259. doi: 10.3390/genes14061259. Genes (Basel). 2023. PMID: 37372439 Free PMC article.
-
The Genetic Variants Influencing Hypertension Prevalence Based on the Risk of Insulin Resistance as Assessed Using the Metabolic Score for Insulin Resistance (METS-IR).Int J Mol Sci. 2024 Nov 26;25(23):12690. doi: 10.3390/ijms252312690. Int J Mol Sci. 2024. PMID: 39684400 Free PMC article.
-
Integrating polygenic risk scores in the prediction of type 2 diabetes risk and subtypes in British Pakistanis and Bangladeshis: A population-based cohort study.PLoS Med. 2022 May 19;19(5):e1003981. doi: 10.1371/journal.pmed.1003981. eCollection 2022 May. PLoS Med. 2022. PMID: 35587468 Free PMC article.
-
Widespread recessive effects on common diseases in a cohort of 44,000 British Pakistanis and Bangladeshis with high autozygosity.Am J Hum Genet. 2025 Jun 5;112(6):1316-1329. doi: 10.1016/j.ajhg.2025.03.020. Epub 2025 Apr 29. Am J Hum Genet. 2025. PMID: 40306283 Free PMC article.
References
Publication types
MeSH terms
Grants and funding
- 210561/Z/18/Z/WT_/Wellcome Trust/United Kingdom
- MR/S027297/1/MRC_/Medical Research Council/United Kingdom
- RG/13/13/30194/BHF_/British Heart Foundation/United Kingdom
- MR/S003754/1/MRC_/Medical Research Council/United Kingdom
- WT102627/WT_/Wellcome Trust/United Kingdom
- RE/13/6/30180/BHF_/British Heart Foundation/United Kingdom
- M009017/MRC_/Medical Research Council/United Kingdom
- CSO_/Chief Scientist Office/United Kingdom
- MFE-171279/CIHR/Canada
- BRC-1215-20014/DH_/Department of Health/United Kingdom
- RG/18/13/33946/BHF_/British Heart Foundation/United Kingdom
- WT210561/WT_/Wellcome Trust/United Kingdom
- 206194/WT_/Wellcome Trust/United Kingdom
LinkOut - more resources
Full Text Sources
Medical
