. 2022 Aug 9;13(1):4676.
doi: 10.1038/s41467-022-32316-x.

Repeated genetic adaptation to altitude in two tropical butterflies

Affiliations

Repeated genetic adaptation to altitude in two tropical butterflies

Gabriela Montejo-Kovacevich et al. Nat Commun. .

Abstract

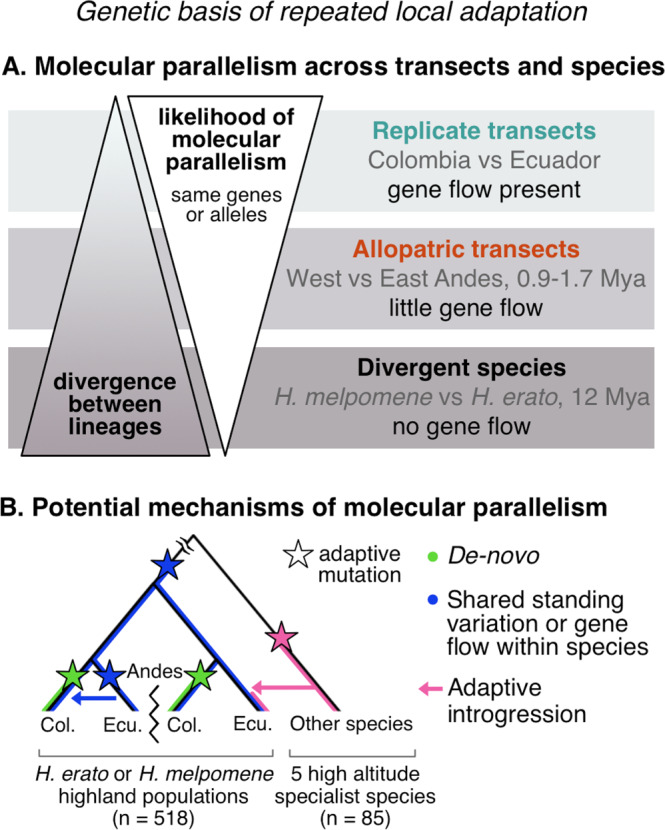
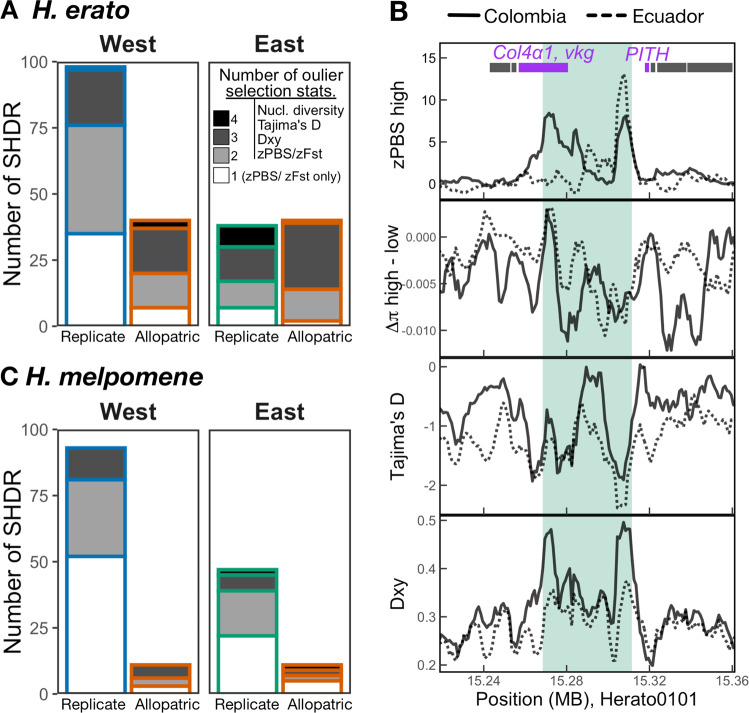
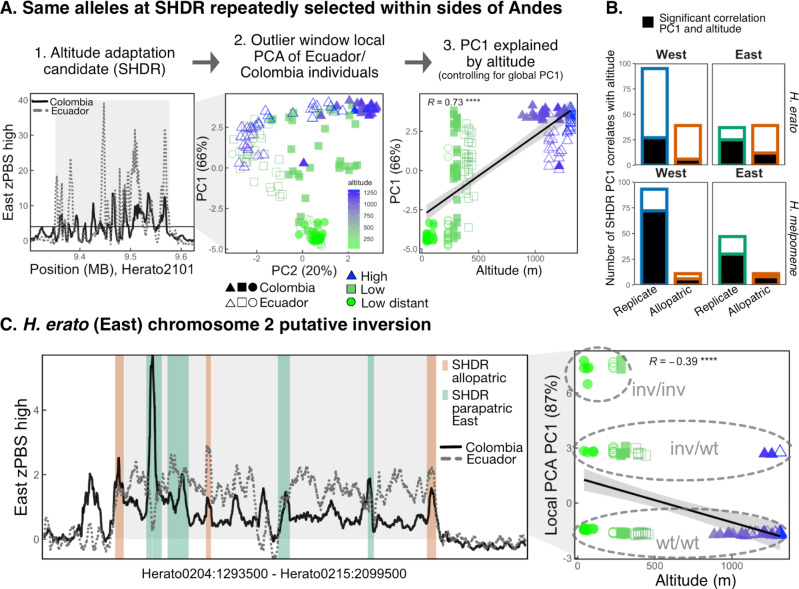
Repeated evolution can provide insight into the mechanisms that facilitate adaptation to novel or changing environments. Here we study adaptation to altitude in two tropical butterflies, Heliconius erato and H. melpomene, which have repeatedly and independently adapted to montane habitats on either side of the Andes. We sequenced 518 whole genomes from altitudinal transects and found many regions differentiated between highland (~ 1200 m) and lowland (~ 200 m) populations. We show repeated genetic differentiation across replicate populations within species, including allopatric comparisons. In contrast, there is little molecular parallelism between the two species. By sampling five close relatives, we find that a large proportion of divergent regions identified within species have arisen from standing variation and putative adaptive introgression from high-altitude specialist species. Taken together our study supports a role for both standing genetic variation and gene flow from independently adapted species in promoting parallel local adaptation to the environment.


Conflict of interest statement

The authors declare no competing interests.

Figures

Fig. 1
Fig. 1. The study of repeated adaptation to the environment and the mechanisms potentially facilitating it.
A We hypothesise that increasing divergence between the lineages under study reduces the likelihood of molecular parallelism (same genes or alleles) underlying repeated adaptation to the environment. In this study, we test this hypothesis by sampling replicate (within sides of the Andes) or allopatric (across sides of the Andes) altitudinal transects of the same species, i.e., connected via gene flow or not (divergence times indicated in Million years ago, Mya), and all replicated in two divergent Heliconius species. B Three main mechanisms can give rise to the genetic variation upon which selection acts repeatedly, giving rise to molecular parallelism: (i) adaptive de-novo mutations independently arise in two or more lineages, (ii) existing shared standing variation is repeatedly selected across lineages or shared via gene flow within species, and (iii) adaptive alleles are shared via gene flow across species (adaptive introgression). We tested for the relative importance of these mechanisms with a range of analyses on the relevant transect comparisons. Illustrative tree including four highland populations from four transects (with the Andes preventing gene flow between replicate transects across sides) of our focal species, either H. erato or H. melpomene, and a lineage of a related high-altitude specialist species from which adaptive introgression is plausible. Sample sizes for the full datasets (including lowland populations when present) are shown in brackets.
Fig. 2
Fig. 2. Sampling design.
A Elevation map of the 30 populations sampled for this study in four geographical transects (Colombia West/East, Ecuador West/East). More details of each population can be found in Supplementary Table 1, number of whole-genome sequences included per altitude and transect is indicated above each map (H. erato, H. melpomene). Source data are provided as a Source Data file and Supplementary Data 1. The black scale bar represents 25 km. Maps and Heliconius subspecies present are depicted per transect (photo credit: C.D.J. McGuire Center for Lepidoptera and Biodiversity, Florida Museum of Natural History; Map data ©2019 Google obtained via RgoogleMaps package), note that only Colombia East has different subspecies in the highlands compared to the lowlands. B Plot depicts trio sampling scheme, with mean altitudinal and geographical distance of the three population types (high, low, low distant) for both species. C Mean genome-wide Population Branch Statistic (PBS) trees averaged across the four transects per species and respective total sample size in brackets. Source data are provided in the Source Data file.
Fig. 3
Fig. 3. Molecular parallelism in PBS/Fst regions of differentiation across eight altitude transects of H. erato and H. melpomene.
A Number of high-differentiation regions per species (HDRs, including ± 50kb buffers), in blue/green if shared across replicate transects within sides of the Andes (SHDR: blue=within West, green=within East) and in red those additionally shared across allopatric transects, i.e. shared across all four transects (also SHDR). Source data are provided in the Source Data file. B Vertical lines represent percentage of outlier windows shared across transects (jackknife resampling confidence intervals as dashed lines), compared to 10,000 simulations (grey distributions). C Density plots of local recombination rate (cM/Mb) for all genomic windows (grey), or for only windows within HDRs (coloured). D, E Patterns of highland-specific differentiation (zPBShigh) across the genome in four transects of H. erato (D) and H. melpomene E. In the two transects where only two populations were sampled zFst is presented. Horizontal dashed line indicates threshold of 4 standard deviations from the mean. HDRs private to one transect are highlighted in dark grey.
Fig. 4
Fig. 4. Signatures of positive selection across shared high differentiation regions (SHDRs).
Number of SHDR with additional outlier selection statistics in H. erato (A) and H. melpomene (C), statistics included were nucleotide diversity difference between highlands and lowlands (Δπ), Tajima’s D, and absolute genetic differentiation (Dxy). Bars are coloured according to whether they are shared between replicate transects within sides of the Andes (blue or green) or across all transects (allopatric, in red). Shading indicates number of statistics that were above 90th percentile of simulations, white = 1 (only zPBS), light grey = 2, dark grey = 3, and black = 4 statistics. Example close-ups of regional zPBS highland values and selection statistic patterns in Eastern SHDR (B; number #005 in Supplementary Figs. 8–10). Each line represents the values for one of the two Eastern transects, solid line is the Colombian transect and dashed in Ecuador. In this example, all three additional selection statistics ranked as outliers among simulations. Green shading highlights the region of the eastern SHDR with zPBShigh > 4.
Fig. 5
Fig. 5. Allele sharing SHDRs and large putative inversion in chromosome 2 of H. erato Eastern transects.
A Example analysis to test whether same alleles underlie SHDRs (here depicted H. erato Eastern SHDR #77). First, outlier windows (zPBS > 4) in either the Eastern Colombia (solid black line) or the Eastern Ecuadorian (dotted grey line) transect are selected (grey panel), and a local PCA with those sites is performed. Then we test whether PC1, the axis explaining most of the variation, is significantly explained by the altitude at which individuals were collected, while controlling for the global PC1 (i.e., neutral population structure). Each point represents an individual, their shape represents transect of origin (Colombia filled, Ecuador empty symbols) and their colour the altitude (m) at which individuals were collected. The solid line represents the best fit of a linear model, with the shaded area showing a confidence bands at 1 standard error and the Pearson correlation coefficient is shown (R, P < 2.2 e−16). B Number of SHDRs where altitude is a significant predictor of local PCA axis 1. C zPBS highland differentiation in Eastern Colombia (solid black line) and Ecuadorian (dotted grey line) transects across a 6.5 Mbp region of H. erato chromosome 2. zPBS lines are regionally smoothed with rolling means of 200 windows, thus some individual outlier windows are higher in value (Fig. 3). SHDRs are shown as vertical segments, coloured by whether they represent SHDRs within Eastern transects (green) or allopatric shared across all transects (red, SHDRs shown in Fig. 3). The solid line represents the best fit of a linear model, with the shaded area showing a confidence bands at 1 standard error. The Pearson correlation coefficient between the putative inversion local PCA PC1 and altitude is shown (****P < 1.8 e−7). Homokaryotes for the wildtype arrangement are named wt/wt, heterokaryotes are inv/wt and inversion homokaryotes are labelled inv/inv. The most common arrangement clustered with the Western transects of H. erato and outgroups of other species in a neighbour-joining tree, and thus was considered the most likely, non-inverted haplotype (wt/wt) (Supplementary Fig. 12).
Fig. 6
Fig. 6. Many SHDRs were sourced from standing variation and putative adaptive introgression from highland-specialist species.
A Tree used to estimate FdM values per 50kb window across the genome in each comparison, which when positive represents excess allele sharing between P2, a highland H. erato or H. melpomene population, and P3, an allopatric highland population of the same species or a sympatric high-altitude specialist species, compared to a lowland population (P2). Colours of P3 populations or species indicate the potential mechanism driving the excess allele sharing, either intraspecific shared ancestral standing variation (blue) or adaptive introgression from closely (orange) or distantly related (yellow) high-altitude specialist species. B Putative donor (P3) high-altitude specialist species. C Excess allele sharing at SHDRs between P3 (putative highland donors, left y axes) and P2 (putative highland recipients, right y axes) across the H. erato (top) or H. melpomene (bottom) comparisons (phylogeny from Kozak et al.),. Left panel shows mean maximum FdM ( ± S.E.) across SHDRs (western SHDRs if the putative recipient was on the West of the Andes, and vice versa) of the Colombian (solid triangles) and Ecuadorian (unfilled triangles) transects. Background mean maximum FdM values were obtained from 1000 block permutations across the genome and shown in grey. Stars represent comparisons where distribution of maximum FdM (excess allele sharing with the highlands) was significantly higher than absolute minimum FdM (excess allele sharing with the lowlands) distribution across all SHDRs (two-sample Kolmogorov-Smirnov tests P < 0.05; significant P-values from top to bottom: 0.00046, 1.6 e−5, 2.0 e−7, 0.00031, 0.007, 2.0−10, 2.6 e−8; Supplementary Figs. 15, 16). Right panels show percentage of SHDRs with evidence of excess allele sharing between P2 and P3, considered significant if they had outlier maximum FdM (> 90th percentile of absolute minimum FdM across all SHDRs). Abbreviations not depicted: era H. erato, mel H. melpomene. Source data are provided in the Source Data file.

References

    1. Booker, T. R., Yeaman, S. & Whitlock, M. C. Global adaptation complicates the interpretation of genome scans for local adaptation. Evol. Lett. 10.1002/evl3.208 (2020). - PMC - PubMed
    1. Stern DL. The genetic causes of convergent evolution. Nat. Rev. Genet. 2013;14:751–764. doi: 10.1038/nrg3483. - DOI - PubMed
    1. Bohutínská, M. et al. Genomic basis of parallel adaptation varies with divergence in Arabidopsis and its relatives. Proc. Natl. Acad. Sci. 118, e2022713118 (2021). - PMC - PubMed
    1. Conte GL, Arnegard ME, Peichel CL, Schluter D. The probability of genetic parallelism and convergence in natural populations. Proc. R. Soc. B Biol. Sci. 2012;279:5039–5047. doi: 10.1098/rspb.2012.2146. - DOI - PMC - PubMed
    1. Martin A, Orgogozo V. The loci of repeated evolution: A catalog of genetic hotspots of phenotypic variation. Evolution. 2013;67:1235–1250. - PubMed

Publication types