. 2022 Aug 9;13(1):4669.
doi: 10.1038/s41467-022-32474-y.

Pro-oxidant response and accelerated ferroptosis caused by synergetic Au(I) release in hypercarbon-centered gold(I) cluster prodrugs

Affiliations

Pro-oxidant response and accelerated ferroptosis caused by synergetic Au(I) release in hypercarbon-centered gold(I) cluster prodrugs

Kui Xiao et al. Nat Commun. .

Abstract

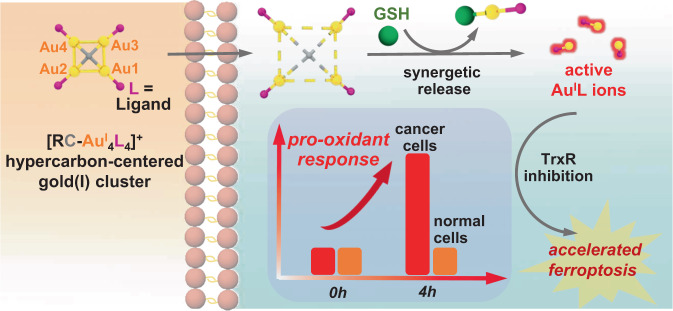
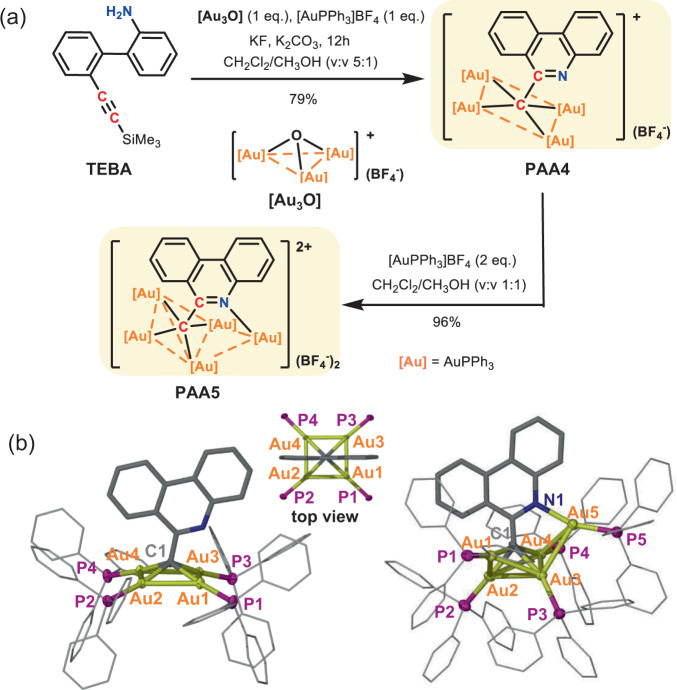
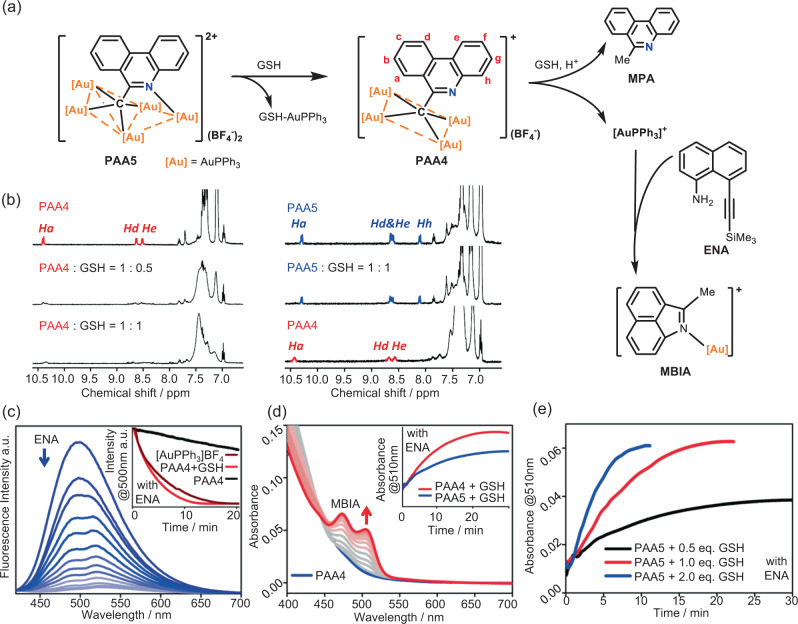
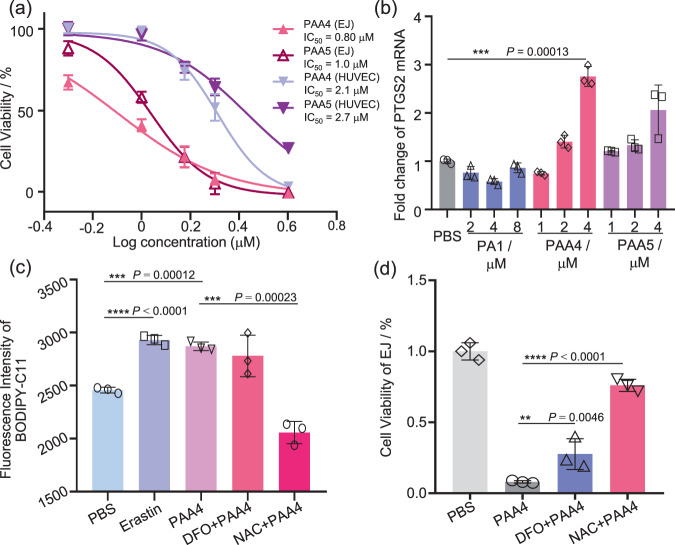
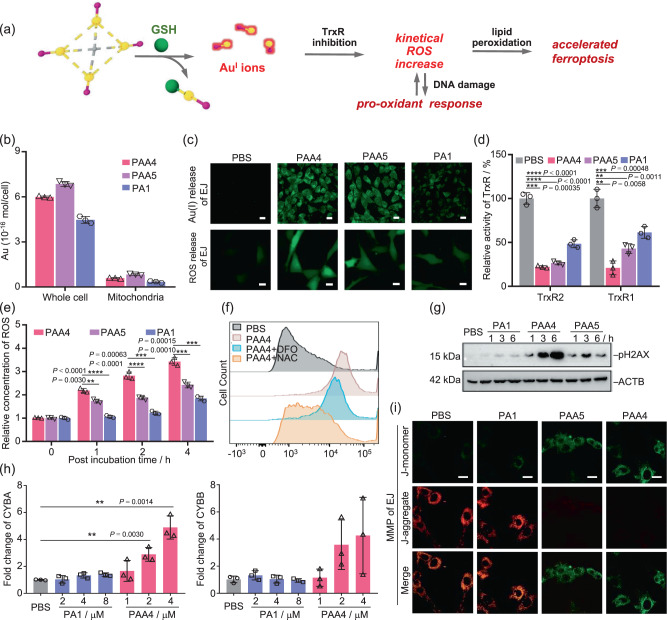
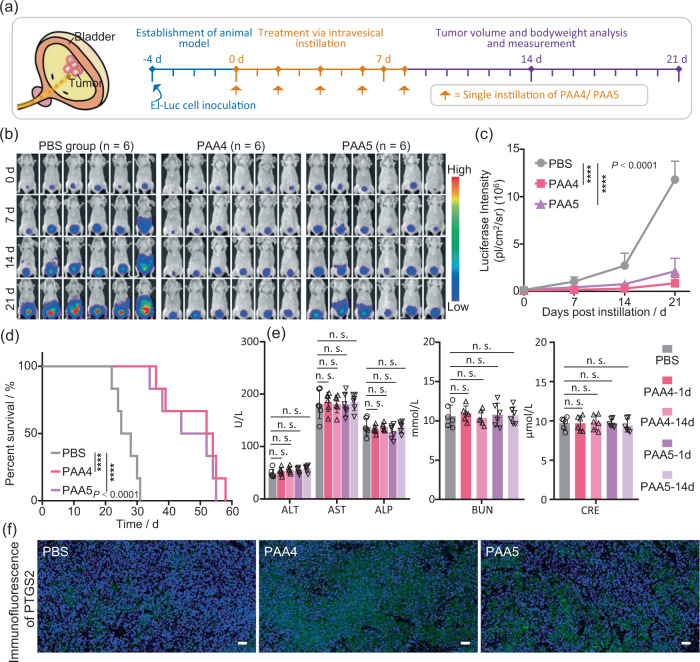
Medicinal applications of gold complexes have recently attracted attention due to their innovative antitumor mechanisms. In this work, two hypercoordinated carbon-centered gold clusters PAA4 and PAA5 are quantitatively synthesized by an intramolecular 6-exo-dig cyclization of polymetalated precursors. The on-bench and in vitro experimental studies demonstrate that the characteristic hypercarbon-tetragold(I) multi-center bonding in PAA4 and PAA5 not only guarantees their stability under common physiological conditions, but also facilitates a glutathione (GSH)-triggered prompt and synergetic release of active Au(I) ions in the GSH-overexpressed and acidic microenvironment of human bladder cancer EJ cells. The instantly massive release of coordination unsaturated Au(I) ions causes the efficient inhibition of thioredoxin reductases and then induces a rapid pro-oxidant response, consequently causing the occurrence of accelerated ferroptosis of EJ cells. As a result, these hypercarbon-centered gold(I) cluster prodrugs show high cytotoxicity to bladder cancer cell lines and thus exhibit a significant inhibition effect towards bladder tumors in vivo. Correlation of the synergetic domino dissociation of carbon-polymetal multi-center bonding in metal clusters with the accelerated ferroptosis of cancer cells provides a strategy for metallo-prodrugs and opens a broader prospect for the biological application of metal cluster compounds.


Conflict of interest statement

The authors declare no competing interests.

Figures

Fig. 1
Fig. 1
Schematic of pharmacological mechanisms of hypercarbon-centered gold(I) cluster prodrugs.
Fig. 2
Fig. 2. Synthesis and crystal structures of PAA4 and PAA5.
a Synthetic procedures for PAA4 and PAA5. b Crystal structures of PAA4 (left) and PAA5 (right). Hydrogen atoms and tetrafluoroborate counter anions are omitted for clarity. Selected bond lengths (Å) and angles (°) in PAA4: Au1-Au2 2.875(1), Au2-Au3 2.811(1), C1-Au1 2.146(4), C1-Au2 2.152(4), ∠Au2-Au1-Au3 89.79(1), ∠Au1-Au2-Au4 90.19(1). PAA5: Au1-Au2 2.954(1), Au1-Au3 2.821(1), Au2-Au3 3.211(1), Au2-Au4 2.829(1), Au3-Au4 2.892(1), Au3-Au5 3.016(1), Au4-Au5 2.989(1), C1-Au1 2.179(9), C1-Au2 2.134(10), C1-Au3 2.165(11), C1-Au4 2.210(10), N1-Au5 2.114(9), ∠Au1-Au2-Au4 96.29(1), ∠Au1-Au3-Au4 97.88(2), ∠Au2-Au1-Au3 67.51(1), ∠Au2-Au4-Au3 68.28(1).
Fig. 3
Fig. 3. Reactivity studies of PAA4 and PAA5 with GSH.
a Schematic reaction procedures of PAA4 and PAA5 with GSH and the ENA-to-MBIA transformation triggered by active Au(I) species. b 1H-NMR spectra monitoring (DMSO-d6:D2O = 9:1, 298 K) on the reaction mixture of PAA4/GSH (left) and PAA5/GSH (right) in different ratios. c Fluorescence spectrum monitoring (λex = 380 nm) on the reaction mixture of PAA4:ENA:GSH = 1:0.5:1 (cPAA4 = 3.3 × 10⁻⁵ M, MeOH:H2O = 1:1, 298 K) in the presence of HBF4 (cHBF4 = 1.0 × 10⁻⁴ M). Inset: Fluorescence variation curves at 500 nm (λex = 380 nm) corresponding to the decrease of ENA (cENA = 1.6 × 10⁻⁵ M) upon its reaction with PAA4 (cPAA4 = 3.3 × 10⁻⁵ M), [AuPPh3]BF4 (1.3 × 10⁻⁴ M), or the mixture of PAA4:GSH = 1:1 (cPAA4 = 3.3 × 10⁻⁵ M). d UV–Vis spectrum monitoring of the reaction mixture of PAA4:ENA:GSH = 1:4:0.5 (cPAA4 = 1.0 × 10⁻⁵ M, DMSO:H2O = 1:1, 298 K). Inset: UV–Vis spectrum monitoring of MBIA generated in the reaction mixtures of PAA4:ENA:GSH = 1:4:0.5 and PAA5:ENA:GSH = 1:4:0.5 (cPAA4 = cPAA5 = 1.0 × 10⁻⁵ M, DMSO:H2O = 1:1, 298 K). e Absorbance variation curves at 510 nm corresponding to the reaction mixtures of PAA5/GSH/ENA in different ratios (cPAA5 = 1.0 × 10⁻⁵ M, cENA = 4.0 × 10⁻⁵ M, DMSO:H2O = 1:1, 298 K). (n = 2 independent experiments).
Fig. 4
Fig. 4. In vitro antitumor activity evaluation of PAA4 and PAA5.
a Cell viability assay of EJ and HUVEC cells treated with PAA4 (IC50 0.8 μM for EJ cells and 2.1 μM for HUVEC cells) and PAA5 (IC50 1.0 μM for EJ cells and 2.7 μM for HUVEC cells) for 24 h. b Changes of PTGS2 mRNA in EJ cells treated by PAA4, PAA5, and PA1 for 6 h. c Fluorescence intensity of lipid peroxidation labeled by BODIPY-C11 in EJ cells. DFO (100 μM) or NAC (3.0 mM) was pretreated 2 h before the PAA4 (4.0 μM, 6 h incubation) treatment. d Rescue effect of DFO (100 μM) or NAC (3.0 mM) on the PAA4-treated (4.0 μM) EJ cell lines. DFO (100 μM) or NAC (3.0 mM) was pretreated 2 h before PAA4 (4.0 μM, 6 h incubation) treatment. Asterisks (*) denote the statistical significance: 0.001< ** P ≤ 0.01, 0.0001< *** P ≤ 0.001, **** P ≤ 0.0001, P values were performed with one-way ANOVA followed by post hoc Tukey’s test. Data were expressed as mean ± SD (n = 3 independent experiments examined over triplicates). Source data are provided as a Source Data file.
Fig. 5
Fig. 5. Mechanistic studies on ferroptosis induced by PAA4 and PAA5.
a Schematic pharmacological pathways of hypercarbon-centered gold(I) cluster. b Content of PAA4, PAA5 and PA1 in the whole EJ cells and cell-extracted mitochondria determined by ICP-MS (cAu(I) clusters = 1.5 μM, cPA1 = 6.0 μM, 4 h incubation). c Release of Au(I) ions monitored by confocal microscopy in the 2,3,6,7-tetrahydro-1H,5H-pyrido[3,2,1-ij]quinolin-8-yl-3-phenylpropiolate stained EJ cells, and ROS release monitored by confocal microscopy in the 2′,7′-dichlorofluorescin diacetate (DCFH-DA, 10.0 μM) stained EJ cells treated with PAA4, PAA5 (1.5 μM, 4 h incubation) and PA1 (6.0 μM, 4 h incubation) relative to the PBS blank trial. Scale bar: 20 mm. Excitation: 488 nm. d TrxR activity inhibition upon the treatment with PAA4, PAA5 (1.5 μM, 4 h incubation) and PA1 (6.0 μM, 4 h incubation) relative to the PBS blank trial. e Time-dependent intracellular ROS change in EJ cells treated by PAA4, PAA5 (1.5 μM, 4 h incubation), and PA1 (6.0 μM, 4 h incubation). The ROS concentration of EJ cells before treatment is referred as the control value. f Flow cytometry analysis of ROS level in EJ cells treated by 2.0 μM PAA4 with or without 2 h pretreatment of DFO (100 μM) and NAC (3.0 mM). ROS was labeled with DCFH-DA (10.0 μM). g Western blot analysis of pH2AX in EJ cells treated by PA1 (8.0 μM), PAA4 (4.0 μM) or PAA5 (4.0 μM) for 1, 3, or 6 h, respectively. (n = 2 independent experiments). h mRNA level analysis of CYBA and CYBB in EJ cells treated by PAA4 or PA1 for 6 h. i Confocal images with the 5,5′,6,6′-tetrachloro-1,1′,3,3′-tetraethyl-imidacarbocyanine (JC-1) assay of EJ cells incubated with PAA4, PAA5 (1.5 μM, 4 h incubation) and PA1 (6.0 μM, 4 h incubation), respectively. Excitation: 488 and 561 nm. Scale bar: 20 mm. Asterisks (*) denote the statistical significance: 0.001< ** P ≤ 0.01, 0.0001< *** P ≤ 0.001, **** P ≤ 0.0001, P values were performed with one-way ANOVA followed by post hoc Tukey’s test. Data were expressed as mean ± SD (n = 3 independent experiments examined over triplicates). Source data are provided as a Source Data file.
Fig. 6
Fig. 6. In vivo antitumor activity evaluation of PAA4 and PAA5 in orthotopic bladder cancer mouse model.
a Left: schematic illustration of intravesical delivery of Au clusters. Right: timeline in treatment and bioluminescence imaging of orthotopic bladder cancer mice. b In vivo bioluminescence images of orthotopic bladder cancer mice at different days after the treatment with PBS, PAA4 and PAA5 (1.5 μM, 100 μL, 60 min). c Quantitative bioluminescence intensity of luciferase in orthotopic bladder tumor. The statistical comparison tumor growth curve was calculated on day 21. d Kaplan–Meier survival curve of EJ orthotopic bladder cancer nude mice. e Blood biochemistry data of the mice after the treatment with Saline, PAA4 and PAA5, respectively, in the aspects of major indicators of liver function including alanine aminotransferase (ALT), aspartate aminotransferase (AST), and alkaline phosphatase (ALP) levels and important indicators of kidney function including the blood urea nitrogen (BUN) and creatinine (CRE) levels. f Immunofluorescence analyses of PTGS2 expression in EJ tumor sections after the treatment with PBS, PAA4 and PAA5. Scale bar: 40 mm. Asterisks (*) denote the statistical significance: ****P ≤ 0.0001, P values were performed with one-way ANOVA followed by post hoc Tukey’s test. Data are presented as the mean ± SD (n = 6 mice in three independent groups from a representative experiment). Source data are provided as a Source Data file.

Similar articles

Cited by

References

    1. Chen X, Kang R, Kroemer G, Tang D. Broadening horizons: The role of ferroptosis in cancer. Nat. Rev. Clin. Oncol. 2021;18:280. doi: 10.1038/s41571-020-00462-0. - DOI - PubMed
    1. Jiang X, Stockwell BR, Conrad M. Ferroptosis: Mechanisms, biology, and role in disease. Nat. Rev. Mol. Cell Biol. 2021;22:266. doi: 10.1038/s41580-020-00324-8. - DOI - PMC - PubMed
    1. Dixon SJ, et al. Ferroptosis: An iron-dependent form of nonapoptotic cell death. Cell. 2012;149:1060. doi: 10.1016/j.cell.2012.03.042. - DOI - PMC - PubMed
    1. Yang WS, Stockwell BR. Ferroptosis: Death by lipid peroxidation. Trends Cell Biol. 2016;26:165. doi: 10.1016/j.tcb.2015.10.014. - DOI - PMC - PubMed
    1. Hanguer MJ, et al. Drug-tolerant persister cancer cells are vulnerable to GPX4 inhibition. Nature. 2017;551:247. doi: 10.1038/nature24297. - DOI - PMC - PubMed

Publication types