. 2022 Aug 9;5(1):800.
doi: 10.1038/s42003-022-03760-8.

PYK2 senses calcium through a disordered dimerization and calmodulin-binding element

Affiliations

PYK2 senses calcium through a disordered dimerization and calmodulin-binding element

Afaque A Momin et al. Commun Biol. .

Abstract

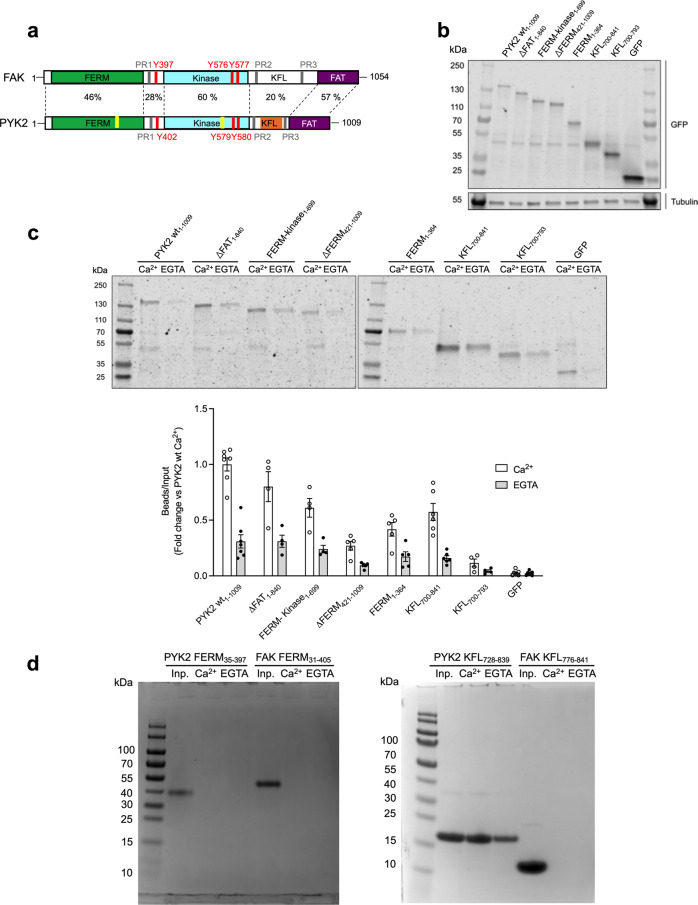
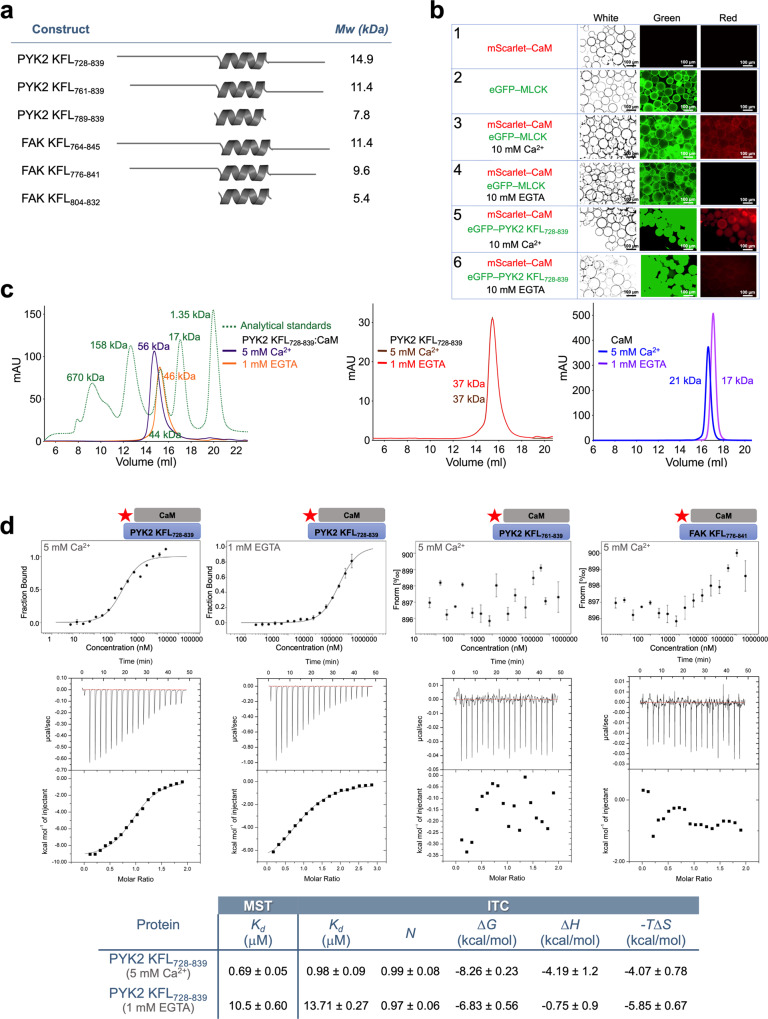
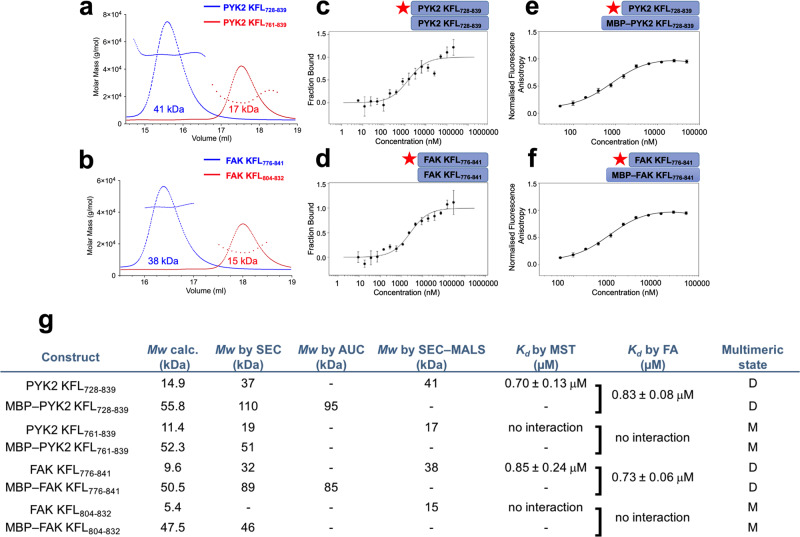
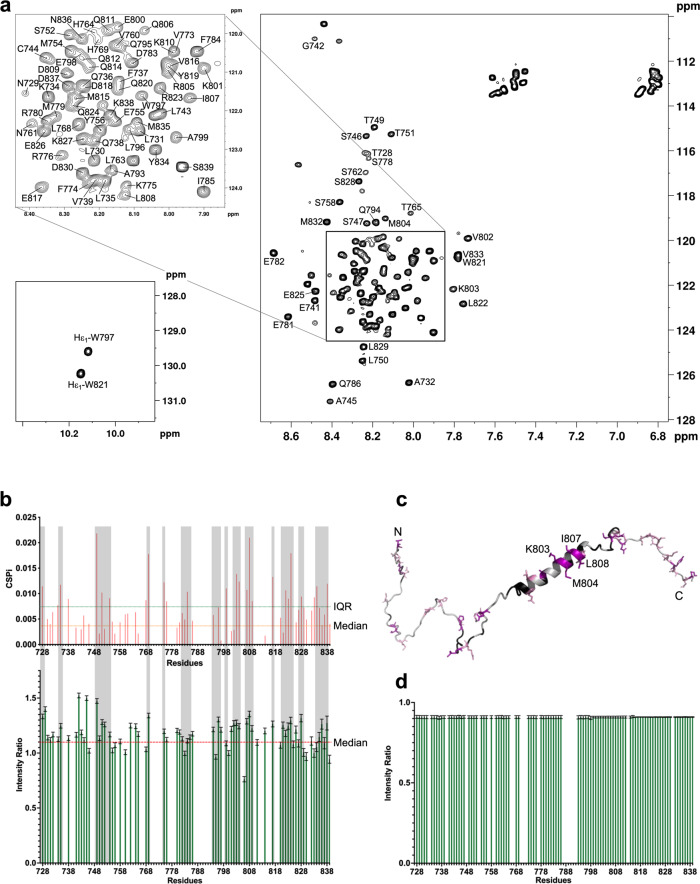
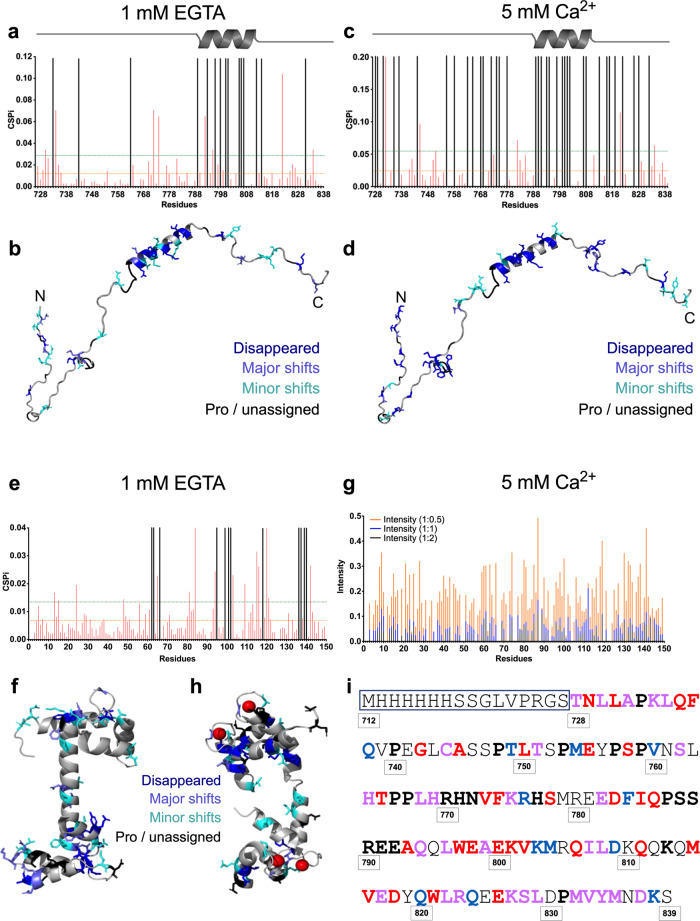
Multidomain kinases use many ways to integrate and process diverse stimuli. Here, we investigated the mechanism by which the protein tyrosine kinase 2-beta (PYK2) functions as a sensor and effector of cellular calcium influx. We show that the linker between the PYK2 kinase and FAT domains (KFL) encompasses an unusual calmodulin (CaM) binding element. PYK2 KFL is disordered and engages CaM through an ensemble of transient binding events. Calcium increases the association by promoting structural changes in CaM that expose auxiliary interaction opportunities. KFL also forms fuzzy dimers, and dimerization is enhanced by CaM binding. As a monomer, however, KFL associates with the PYK2 FERM-kinase fragment. Thus, we identify a mechanism whereby calcium influx can promote PYK2 self-association, and hence kinase-activating trans-autophosphorylation. Collectively, our findings describe a flexible protein module that expands the paradigms for CaM binding and self-association, and their use for controlling kinase activity.


Conflict of interest statement

The authors declare no competing interests.

Figures

Fig. 1
Fig. 1. Identification of the CaM-binding site in PYK2.
a Structural domain arrangement of FAK and PYK2. The FERM, kinase and FAT domains are colour-coded. Flexible linker regions are shown in white. Tyrosines important for kinase activation through phosphorylation are indicated in red. Proline-rich (PR) motifs 1–3 are marked in grey. Previously suggested Ca2+/CaM-binding sites in PYK2 are shown in yellow, and the site determined in this study is in orange. b Representative immunoblot of input fractions of the indicated GFP-tagged PYK2 constructs immunolabelled with GFP and tubulin antibodies. c Top: Representative GFP immunoblot of GFP-PYK2 constructs associated with the CaM Sepharose beads labelled as in b. Bottom: Graphical representation of GFP immunoblot densitometry associated with beads normalised by corresponding input, presented as foldchange using PYK2 WT Ca2+ bead fractions as a reference. Bars correspond to the mean of 4–7 independent experiments, ±SEM. d CaM Sepharose bead assay using recombinant purified FERM domains of PYK2 and FAK (left) and KFL regions of PYK2 and FAK (right). For each construct the input (inp.) and the bead fractions were run in adjacent lanes as indicated.
Fig. 2
Fig. 2. Analysis of the CaM-binding properties of PYK2 KFL.
a Constructs designed for in vitro characterisation of the KFL region in FAK and PYK2. All constructs were expressed and purified in three different variants, namely with a 6xHis, an eGFP or an MBP tag. b Visible immunoprecipitation (VIP) assay. eGFP-fused proteins (green) were bound to GFP–nanobody beads. The CaM-interacting fragment of the myosin light chain kinase (MLCK) was used as positive control. Beads were incubated with mScarlet-fused CaM (mScarlet-CaM), washed and then visualised using white light (White), green light (Green, 488 nm, to visualise eGFP), or red light (Red, 569 nm, to visualise mScarlet). Scale bars are indicated on each panel. c Left—SEC elution profile showing that PYK2 KFL728–839 bound to CaM in the presence (purple) as well as absence (orange) of calcium. The molecular standards are shown in green. The calculated Mw of CaM is 18.5 kDa. Middle and right – SEC elution profiles for purified PYK2 KFL728-839 or CaM with either 5 mM Ca2+ or 1 mM EGTA. d Top—MST-binding assays. Red star indicates that CaM was fluorescently labelled. Middle—ITC data corresponding to the MST interactions, however, with unlabelled CaM injected from the syringe and KFL constructs in the cell. Measured heats (top) and integrated heats (bottom) are shown. Bottom—Summary of MST and ITC results. Kd: dissociation constant; N: stoichiometry; ∆G: change in Gibb’s free energy; ∆H: change in enthalpy; TS: change in entropy * temperature in kelvin. Binding experiments are represented as (mean ± SD, n = 3).
Fig. 3
Fig. 3. PYK2 and FAK KFL dimerise.
a, b SEC-MALS elution profiles on purified proteins. The Mw deduced for each peak is given. The additional lines show the molar mass distribution. c, d MST and e, f fluorescence anisotropy (FA) studies. The red star indicates the fluorescently labelled protein. MBP fusions were used to increase the Mw of the unlabelled molecule in FA. g Summary table, also including data derived from Supplementary Fig. 7a–f). The single square bracket indicates that the Kd in FA was established between fluorescently labelled protein and MBP-fused unlabelled protein. D: dimer; M: monomer. Binding experiments are represented as (mean ± SD, n = 3).
Fig. 4
Fig. 4. Structural characterisation of PYK2 KFL728-839 by NMR.
a [1H-15N] HSQC spectrum of PYK2 KFL728–839 recorded on a Bruker Avance III 950 MHz spectrometer at 25 °C, pH 6.5, on a 250 µM 15N-uniformly labelled sample. Cross-peak assignments are indicated using the one-letter amino acid and number code. The central part of the spectrum is expanded in the insert at the top left. Assignment of tryptophan indole NH proton resonances is represented at the bottom left. b (Top) CSP occurring as a result of diluting [13C,15N] PYK2 KFL728-839 from 100 µM (8 scans) to 10 µM (128 scans), monitored by 2D [1H-15N] HSQC. The orange horizontal line indicates the median threshold for minor shifts and the horizontal green line and shows the interquartile range (IQR) threshold for major shifts. (Bottom) Plot of 2D [1H-15N] HSQC intensity ratios of [13C,15N] PYK2 KFL728-839. The ratios were calculated as 10 µM (128 scans) divided by 100 µM (8 scans). The intensity value at 100 µM was taken as a reference and used to normalise the intensity value at 10 µM to compensate for an overall loss of intensity upon dilution. Red dotted line indicates the median. Grey-shaded zones indicate residue regions where significant CSPs correspond to regions of lower relative intensity (c) CSPs from b were mapped on a representative 3D structure of PYK2 KFL728–839. Major shifts are marked in magenta, minor shifts are coloured in pink and prolines, overlapping and unassigned residues are marked in black. N and C indicate the N-terminal and C-terminal of the molecule. d Plot of 2D [1H-15N] HSQC intensity ratios of [1H,15N] PYK2 KFL728-839. The ratios were calculated as 100 µM (8 scans) measured on 700 MHz divided by 100 µM (8 scans) measured on 950 MHz.
Fig. 5
Fig. 5. NMR mapping of the residues contributing to the CaM–PYK2 KFL association.
CSP analyses of 150 µM [13C,15N] PYK2 KFL728-839 titrated with CaM in the a absence and c presence of Ca2+. Orange and green horizontal lines indicate the threshold for major shifts (∆ppm + 2 std) and minor shifts (∆ppm + 1 std), respectively. Resonances that disappeared are indicated in black. CSPs from a and c are mapped onto a structural representative of PYK2 KFL728-839 in b and d, respectively. Dark blue: residues for which peaks disappeared; slate blue: major shifts; cyan: minor shifts; black: prolines and unassigned residues. N and C indicate the N-terminal and C-terminal of the molecule. e CSP analysis of 150 µM [13C,15N] apo-CaM titrated with PYK2 KFL728–839. Colouring according to a. f Mapping of the data from e onto the 3D structure of apo-CaM (PDB ID 4e53). Colouring according to b. g Plot of peak intensities recorded for 150 µM [13C,15N] Ca2+/CaM titrated with PYK2 KFL728–839 at 10 °C. The intensity value without the binding partner (corresponding to a ratio of 1:0) is taken as a reference and used to normalise the intensity values of subsequent titrations (1:0.5, 1:1, 1:2) to compensate for an overall loss of intensity as the binding partner is added to the solution at increasing concentrations. Intensities per residue are colour-coded by titration ratio as indicated. h Intensity changes from g are mapped onto the 3D structure of CaM (PDB ID 1 × 02) according to dark blue: residues that disappeared at ratio 1:0.5; slate blue: residues with an intensity less than 0.045 at a ratio of 1:0.5; cyan: residues that have an intensity more than 0.045 at 1:0.5 but disappear at 1:1; black: prolines and unassigned residues. Red spheres represent Ca2+. i Sequence of the PYK2 KFL728–839 construct used. The non-natural 6xHis-tag is boxed in blue. Pink residues indicate residues identified as contributing to both dimerisation and CaM binding. Blue residues are those assumed contributing only to dimerisation (based on CSPs), and red residues are those that only contribute to CaM binding (in the absence or presence of Ca2+). Prolines and unassigned residues are marked in bold black. Note that the confidence of the residue mapping is low because of the fuzzy nature of the binding events.
Fig. 6
Fig. 6. Control of PYK2 function through fuzzy CaM-binding and dimerisation of KFL.
a CaM antagonist calmidazolium (Cz, 50 µM) blocks PYK2 Y402 phosphorylation induced by membrane depolarisation in PC12 cells. Depolarisation was induced by isosmotic replacement of 40 mM NaCl by 40 mM KCl in the extracellular medium for 3 min. Graphical representation of PYK2 pY402 over total PYK 2 densitometry for transfected and endogenous PYK2 bands (mean values of 2 replicates). b Dimerisation of PYK2-KFL728–839 in the presence of 10 µM CaM. Experiments were carried out by MST (top) and FA (bottom) in the presence of Ca2+ or EGTA. The fluorescently labelled protein (indicated by a red star) was at a concentration of 50 nM, and the unlabelled protein was serially diluted from a concentration of 100 µM. The condition (Ca2+ or EGTA), and the derived Kd values are noted in the figures. c MST analysis of fluorescently labelled PYK2 KFL728–839 was kept at 50 nM (where it is predominantly monomeric) and titrated with unlabelled PYK2 FERM–kinase. The presence of Ca2+ or EGTA and the Kd are stated. Binding experiments are represented as (mean ± SD, n = 3). d Proposed molecular mechanism. Left: Theoretical model of the closed monomeric PYK2, adopted in the absence of Ca2+ and other specific stimuli. Molecular surfaces of the FERM (green), kinase (cyan) and FAT (magenta) domains are shown. The FERM–kinase association was modelled based on the corresponding FAK fragment (PDB accession 2j0k). PYK2 FAT was docked onto the FERM domain as modelled for FAK in ref. . The flexible linker regions are shown as dashed lines. The position of Y402 is indicated. Right: Theoretical model of the pre-activation Ca2+/CaM-bound PYK2 dimer, modelled on PDB accessions 2j0k and 4ny0. CaM is shown as grey rectangle with the four red dots illustrating the bound Ca2+ ions. Note that the CaM–KFL complex is highly disordered, and not symmetric as shown in this illustration. Colours as in the left panel, but FERM, kinase and FAT domains of the second molecule are coloured in grey.

Similar articles

Cited by

References

    1. Hanks SK, Calalb MB, Harper MC, Patel SK. Focal adhesion protein-tyrosine kinase phosphorylated in response to cell attachment to fibronectin. Proc Natl Acad Sci USA. 1992;89:8487–8491. doi: 10.1073/pnas.89.18.8487. - DOI - PMC - PubMed
    1. Schaller MD, et al. pp125FAK, A structurally distinctive protein-tyrosine kinase associated with focal adhesions. Proc Natl Acad Sci USA. 1992;89:5192–5196. doi: 10.1073/pnas.89.11.5192. - DOI - PMC - PubMed
    1. Schaller MD. Cellular functions of FAK kinases: insight into molecular mechanisms and novel functions. J. Cell Sci. 2010;123:1007–1013. doi: 10.1242/jcs.045112. - DOI - PubMed
    1. Arold ST. How focal adhesion kinase achieves regulation by linking ligand binding, localization and action. Curr. Opin. Struct. Biol. 2011;21:808–813. doi: 10.1016/j.sbi.2011.09.008. - DOI - PMC - PubMed
    1. Hall JE, Fu W, Schaller MD. Focal adhesion kinase: exploring Fak structure to gain insight into function. Int. Rev. Cell Mol. Biol. 2011;288:185–225. doi: 10.1016/B978-0-12-386041-5.00005-4. - DOI - PubMed

Publication types