. 2022 Dec;158(6):545-559.
doi: 10.1007/s00418-022-02145-6. Epub 2022 Aug 9.

SOX2 expression in the pathogenesis of premalignant lesions of the uterine cervix: its histo-topographical distribution distinguishes between low- and high-grade CIN

Affiliations

SOX2 expression in the pathogenesis of premalignant lesions of the uterine cervix: its histo-topographical distribution distinguishes between low- and high-grade CIN

Jobran M Moshi et al. Histochem Cell Biol. 2022 Dec.

Abstract

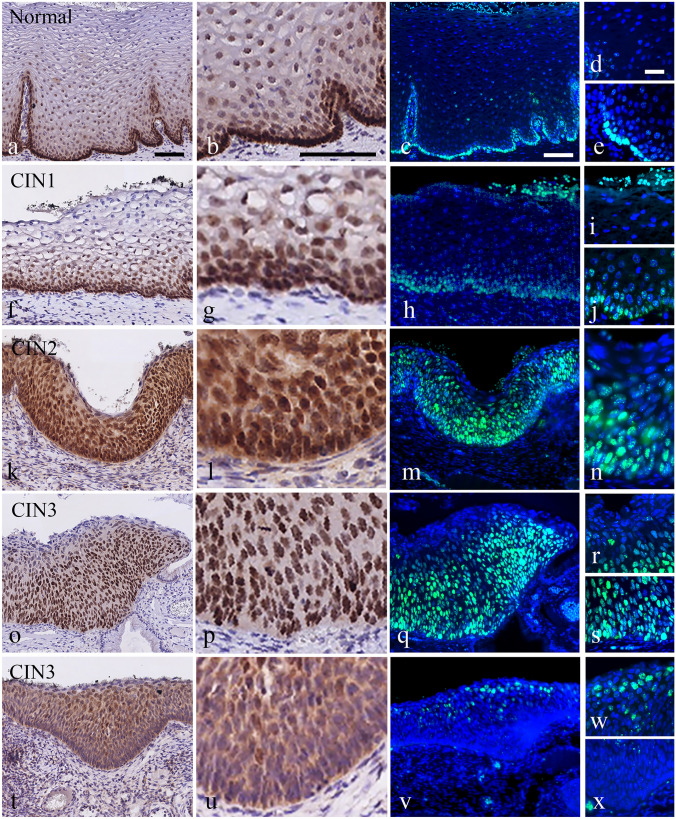
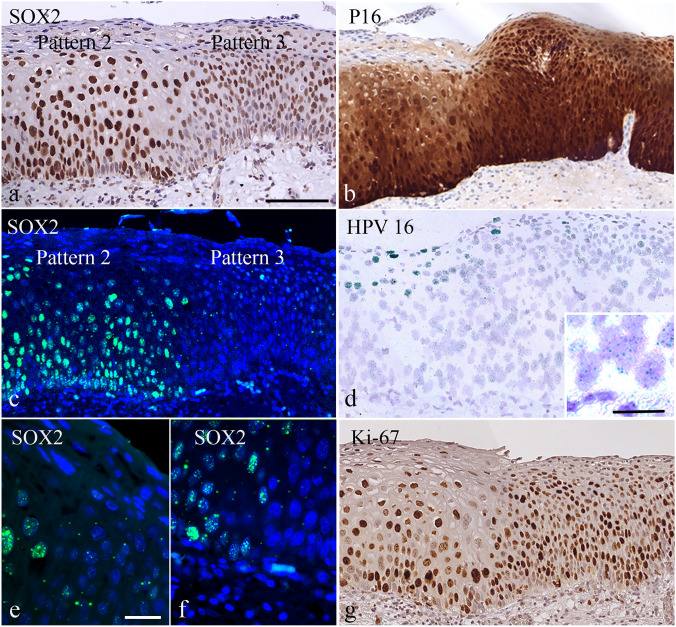
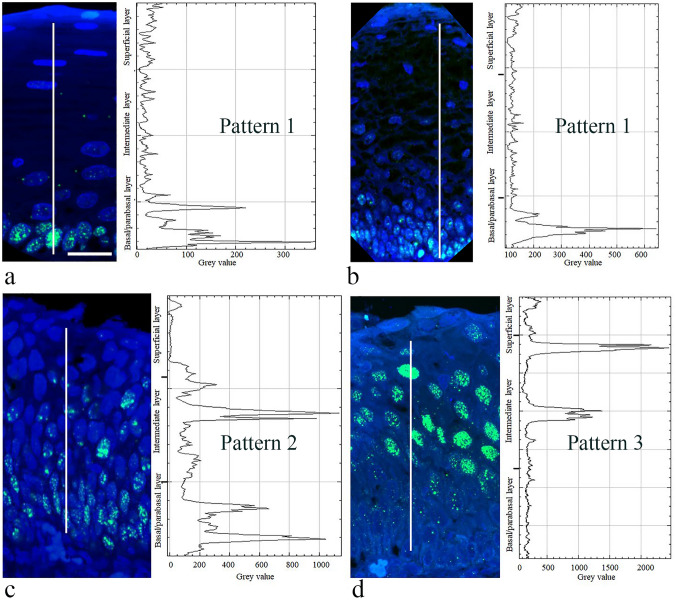
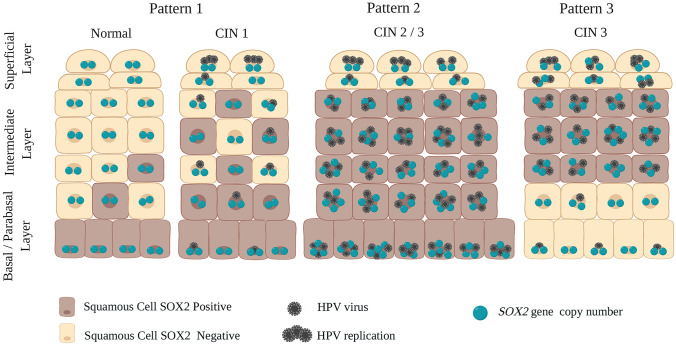
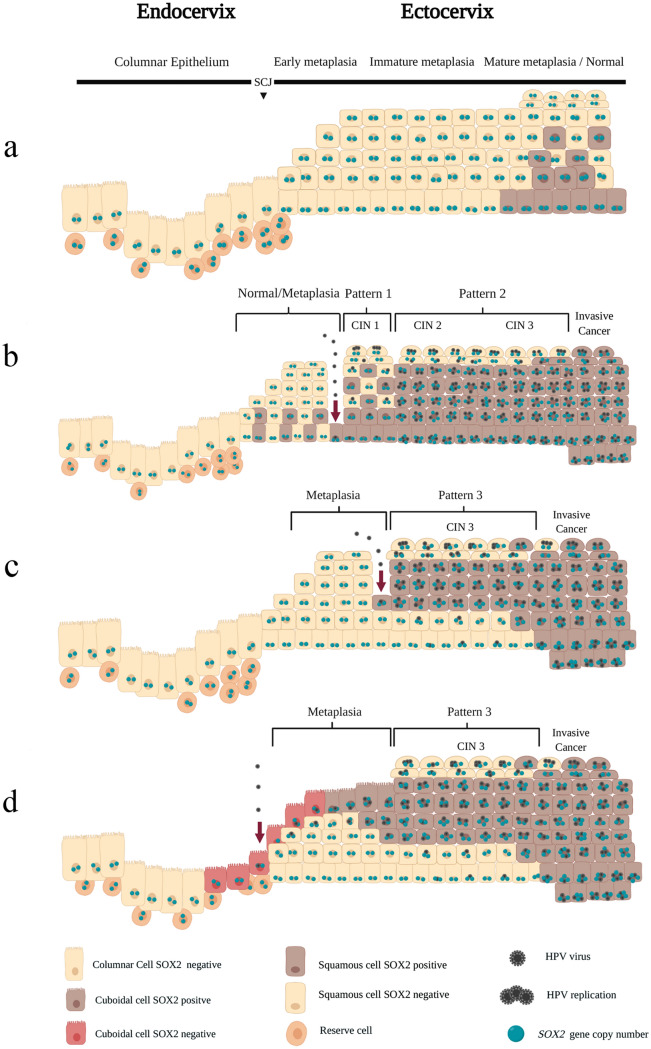
SOX2 expression in high-grade cervical intraepithelial neoplasia (CIN3) and cervical squamous cell carcinoma is increased compared to that in the normal cervical epithelium. However, data on the expression and histological distribution of SOX2 in squamous epithelium during progression of CIN are largely lacking. We studied SOX2 expression throughout the epithelium in 53 cases of CIN1, 2, and 3. In general, SOX2 expression increased and expanded from basal/parabasal to the intermediate/superficial compartment during early stages of progression of CIN. An unexpected, specific expression pattern was found in areas classified as CIN2 and CIN3. This pattern was characterized by the absence or low expression of SOX2 in the basal/parabasal compartment and variable levels in the intermediate and superficial compartments. It was significantly associated with CIN3 (p = 0.009), not found in CIN1 and only seen in part of the CIN2 lesions. When the different patterns were correlated with the genetic make-up and presence of HPV, the CIN3-related pattern contained HPV-positive cells in the basal/parabasal cell compartment that were disomic. This is in contrast to the areas exhibiting the CIN1 and CIN2 related patterns, which frequently exhibited aneusomic cells. Based on their SOX2 localisation pattern, CIN1 and CIN2 could be delineated from CIN3. These data shed new light on the pathogenesis and dynamics of progression in premalignant cervical lesions, as well as on the target cells in the epithelium for HPV infection.

Keywords: CIN; Cervical preneoplasia; Genetic aberrations; HPV infection; SOX2 distribution; Squamous intraepithelial lesions.


Conflict of interest statement

The authors declare no conflict interests.

Figures

Fig. 1
Fig. 1
Comparison of SOX2 expression patterns in normal squamous epithelium and CIN1, CIN2 and CIN3 lesions as detected by bright field and fluorescence microscopy. a-e Expression of SOX2 in normal squamous epithelium in bright field microscopy a, b; higher magnification of a in b and fluorescence microscopy c-e with higher magnifications of superficial and basal layer showing no or very weak SOX2 expression in superficial cells d and strong expression in basal and parabasal cells e. f-j Expression of SOX2 in a CIN1 lesion with positive staining in basal and parabasal cells and moving gradually into the intermediate cell layer in bright field (f, g; higher magnification of f in g) and fluorescence microscopy (h-j). Higher magnifications clearly show the absence of SOX2 staining in the superficial area (i) and strong positivity in the basal and parabasal cell layers (j). The green fluorescence in h and i on top of superficial cells is caused by the high autofluorescence of erythrocytes in FFPE tissue. k-n Expression of SOX2 in a CIN2 lesion with strong positive staining throughout the squamous epithelium except for the superficial cells that were weakly positive in bright field (k, l; higher magnification of k in l) and fluorescence microscopy (m, n). The higher magnification in n clearly shows positive staining with a speckled pattern in the basal, parabasal and intermediate cell layers. o-s Expression of SOX2 in a CIN3 lesion in bright field microscopy (o, p; higher magnification of o in p) and fluorescence microscopy (q-s). Higher magnifications show a strong fluorescence in the basal/parabasal layer up to the intermediate layers (r) and a weaker/negative reaction in the more superficial cell layers (s). t-x Expression of SOX2 in a CIN3 lesion in bright field microscopy (t, u; higher magnification of t in u) and fluorescence microscopy (v-x), showing a negative reaction in the basal/parabasal and superficial cell layers, while showing SOX2 expression only in intermediate cell layers. Additionally, higher magnifications in w and x show that most epithelial cells are negative except for cells in the intermediate layers, which are positive with a speckled pattern. Scale bar = 100 μm in a, b and c. Magnifications in panels below a, b and c are similar. Scale bar = 20 μm in d; magnification in panels below d is similar
Fig. 2
Fig. 2
Transition area in a CIN3 lesion exhibiting adjoining Pattern 2 and Pattern 3 SOX2 distributions, with corresponding areas assessed for HPV and the proliferation marker Ki-67. (a, c, e, f) SOX2 expression level and distribution differences seen in Pattern 2 (left side) and Pattern 3 (right side) as visualized by bright field microscopy a and fluorescence microscopy c. Higher magnifications of the transition zone exhibit a speckled SOX2 pattern in individual cells (e and f). b P16 staining is strong in both Pattern 2 and Pattern 3, with no expression in the superficial layer in Pattern 2. d HPV load and physical status as detected by chromogenic in situ hybridization, showing viral replication in the superficial layer (productive lesion) and low viral load in the basal/parabasal nuclei in the Pattern 3 area (see insert). g Ki-67 expression in areas with SOX2 Pattern 2 and Pattern 3. Note the difference in nuclear size and the frequency of Ki-67-positive cells in the two different areas and that both areas harbor HPV. Scale bar = 100 μm in a. Magnification in panels a, b, c, d and g is similar. Scale bar = 20 μm in insert panel d and e. Magnification in e and f is similar
Fig. 3
Fig. 3
Quantitative analysis of SOX2 expression in areas with Patterns 1, 2 and 3. The expression levels of SOX2 were assessed by means of fluorescence intensity measurements in a confocal laser scanning microscope using a line scan (white line) in a normal squamous epithelium with SOX2 Pattern 1, b a CIN1 lesion with Pattern 1, c a CIN2 lesion with Pattern 2, and d a CIN3 lesion with Pattern 3. In Pattern 1, a high SOX2 fluorescence intensity is measured in the basal/parabasal cell layer only, while in Pattern 2, the fluorescence intensity moves gradually upwards to reach the intermediate cell layer. In Pattern 3, the basal/parabasal layer shows no SOX2 staining. Scale bar = 25 μm in a. Magnification in panels a, b, c and d is similar
Fig. 4
Fig. 4
Fluorescence in situ hybridization showing copy number variations for the SOX2 (visualized in green) and SOX17 genes (visualized in red) in areas with SOX2 expression Patterns 1, 2 and 3. The intermediate and superficial cell layers are shown in a, b and c, while the basal/parabasal cell compartments are depicted in d, e and f. The Pattern 1 area was selected from a CIN1 lesion (a, d), while the Pattern 2 and Pattern 3 areas were from a CIN3 lesion (b, c, e, f). Genetically aberrant cells were mainly detected in areas with SOX2 Pattern 2, while in Patterns 1 and 3, the basal/parabasal cells were disomic. The intermediate layer in Pattern 3 showed genetically aberrant cells in most cases. Scale bar = 25 μm in a. Magnification in panels a-f is similar
Fig. 5
Fig. 5
Fluorescence in situ hybridization targeting copy number variations for the centromere region of chromosome 1 (C1; visualized in green) and load for HPV 16 (visualized in red). The intermediate and superficial cell layers are shown in a, b and c, while the basal/parabasal cell compartments are depicted in d, e and f. The Pattern 1 area was selected from a CIN1 lesion (a, d), while the Pattern 2 and Pattern 3 areas were from a CIN3 lesion (b, c, e, f). Genetically aberrant cells were seen in areas with SOX2 Pattern 2, while in Patterns 1 and 3, the basal/parabasal cells were disomic. The intermediate layer in Pattern 3 showed genetically aberrant cells in most cases, with the highest viral load also seen in the intermediate/superficial cells showing replication of the viral sequences. In Pattern 2, a relatively high copy number for the virus is also seen in the basal/parabasal cells, while in Patterns 1 and 3, a low HPV copy number is seen in these basal/parabasal layers (see insert in f). Scale bar = 25 μm in a, Magnification in panels a-f is similar
Fig. 6
Fig. 6
Schematic representation of the different SOX2 distribution patterns, with concomitant molecular characteristics, for the normal squamous epithelium and the different stages of cervical premalignant lesions
Fig. 7
Fig. 7
Schematic representation of the different models for the origin of preneoplastic CIN lesions after HPV infection (indicated by the arrow) based on the different SOX2 expression patterns and genetic characteristics. a Origin of metaplastic epithelial changes and increasing SOX2 expression with a higher degree of maturation. b HPV infection of the basal cell layer(s) in the normal or metaplastic epithelium of the transformation zone results in CIN1, which progresses to invasive squamous cell carcinoma via CIN2 and CIN3. c HPV infection of the intermediate cell layers in the normal or metaplastic epithelium of the transformation zone resulting directly in CIN3, subsequently progressing to invasive squamous cell carcinoma. d HPV infection of the columnar cell layer overgrowing the normal or metaplastic epithelium of the transformation zone (as suggested by Herfs et al. 2012, 2013) results directly in CIN3, subsequently progressing to invasive squamous cell carcinoma

References

    1. Bosch FX, Broker TR, Forman D, Moscicki A-B, Gillison ML, Doorbar J, Stern PL, Stanley M, Arbyn M, Poljak M. Comprehensive control of human papillomavirus infections and related diseases. Vaccine. 2013;31:H1–H31. doi: 10.1016/j.vaccine.2013.10.001. - DOI - PMC - PubMed
    1. Chang X, Zhang J, Huang C, Pang X, Luo Q, Zhang H, Zhang S. Sex-determining region Y-related high mobility group box (SOX)-2 is overexpressed in cervical squamous cell carcinoma and contributes cervical cancer cell migration and invasion in vitro. Tumour Biol. 2015;36(10):7725–7733. doi: 10.1007/s13277-015-3450-y. - DOI - PubMed
    1. Chaudhary S, Islam Z, Mishra V, Rawat S, Ashraf GM, Kolatkar PR. Sox2: A Regulatory Factor in Tumorigenesis and Metastasis. Curr Protein Pept Sci. 2019;20(6):495–504. doi: 10.2174/1389203720666190325102255. - DOI - PubMed
    1. Chen Y, Shi L, Zhang L, Li R, Liang J, Yu W, Sun L, Yang X, Wang Y, Zhang Y, Shang Y (2008) The molecular mechanism governing the oncogenic potential of SOX2 in breast cancer. J Biol Chem 283 (26):17969–17978. 10.1074/jbc.M802917200 - PubMed
    1. Chen EY, Tran A, Raho CJ, Birch CM, Crum CP, Hirsch MS (2010) Histological 'progression' from low (LSIL) to high (HSIL) squamous intraepithelial lesion is an uncommon event and an indication for quality assurance review. Mod Pathol 23 (8):1045–1051. 10.1038/modpathol.2010.85 - PubMed

Substances