

MicroRNA-379-5p regulates free cholesterol accumulation and relieves diet induced-liver damage in db/db mice via STAT1/HMGCS1 axis
- PMID: 35945406
- PMCID: PMC9363541
- DOI: 10.1186/s43556-022-00089-w
MicroRNA-379-5p regulates free cholesterol accumulation and relieves diet induced-liver damage in db/db mice via STAT1/HMGCS1 axis
Abstract
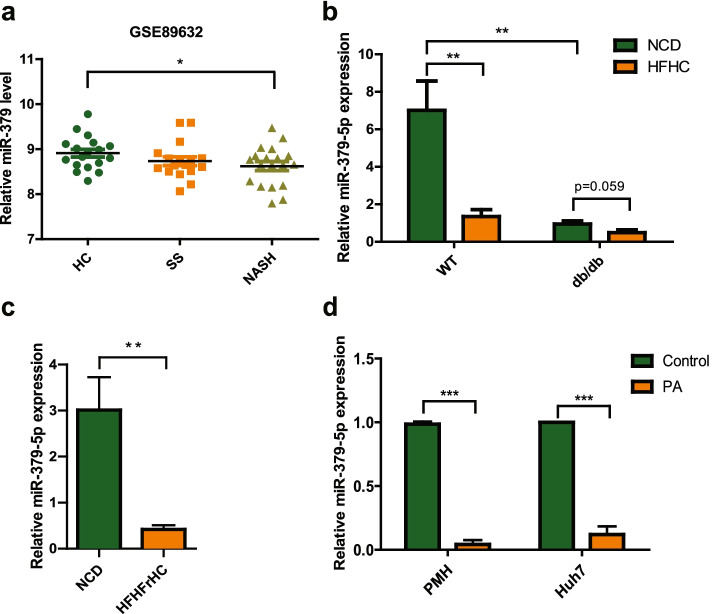
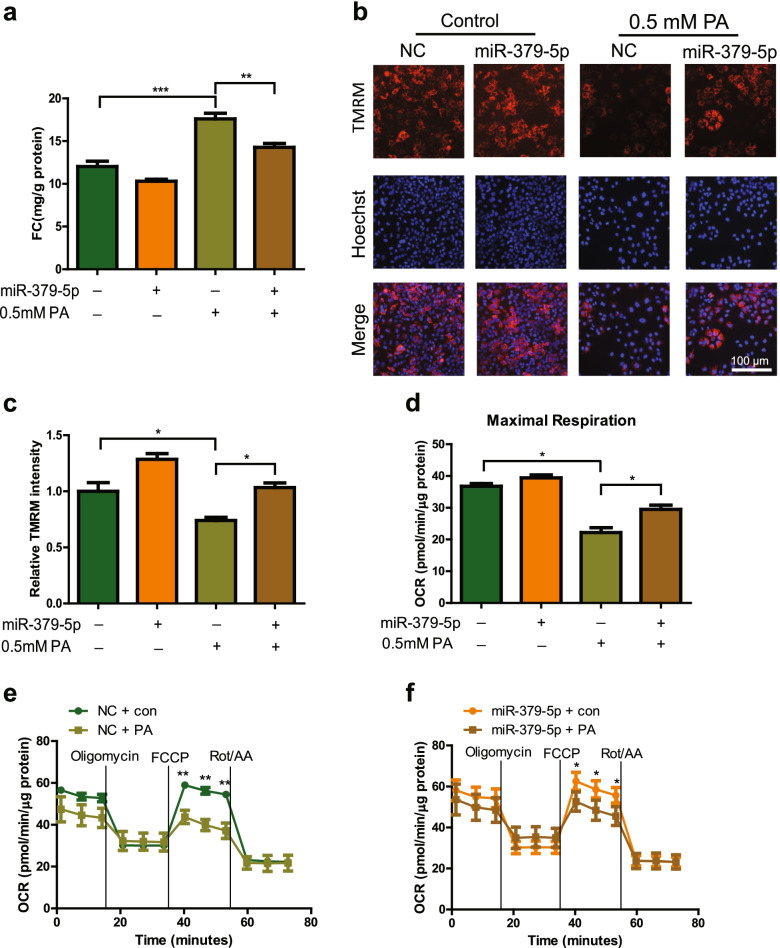
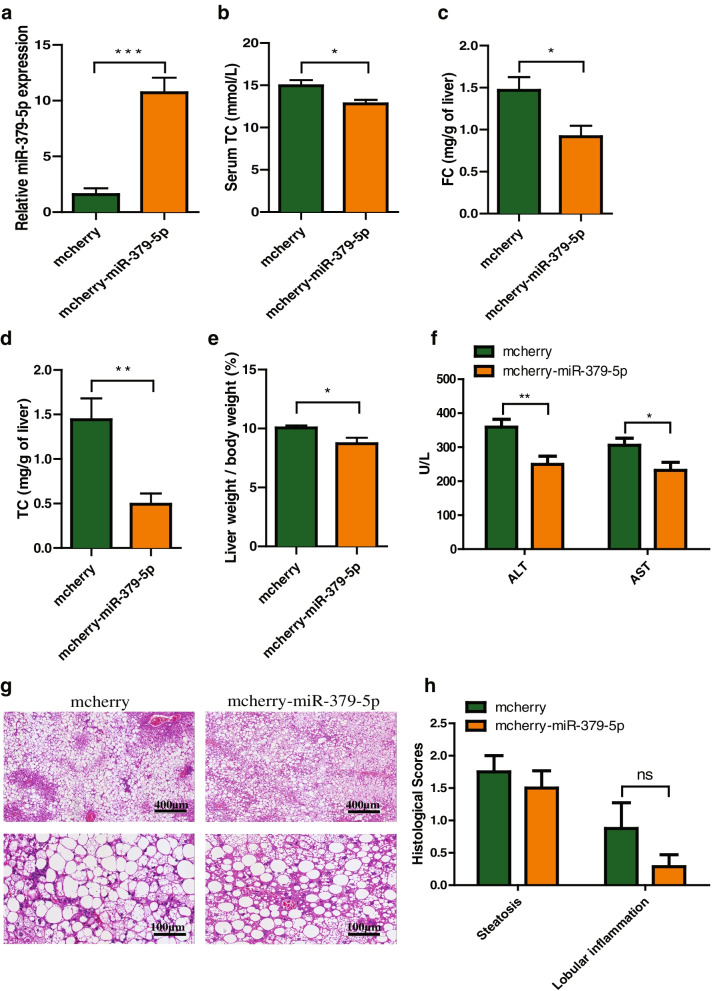
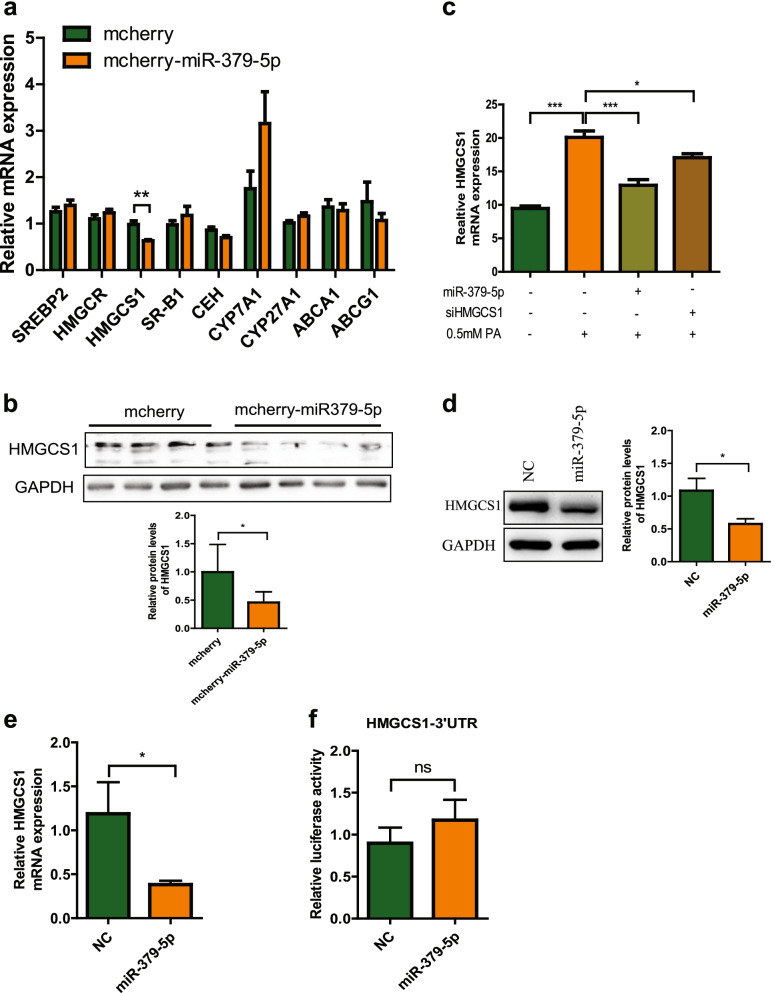
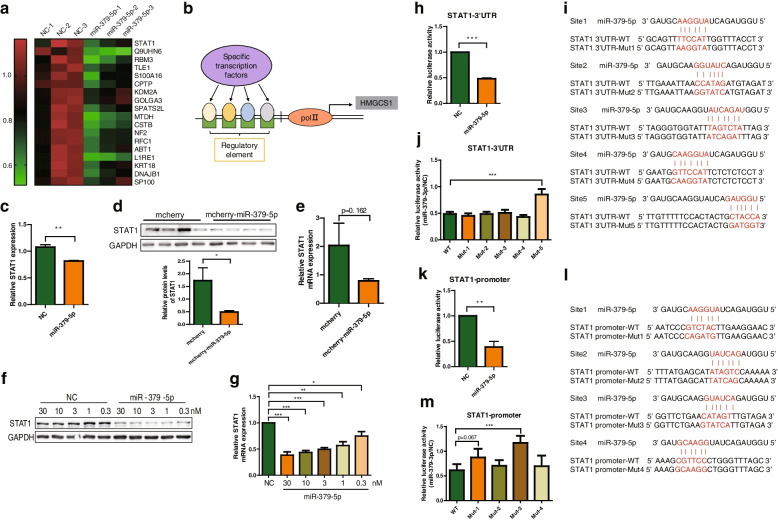
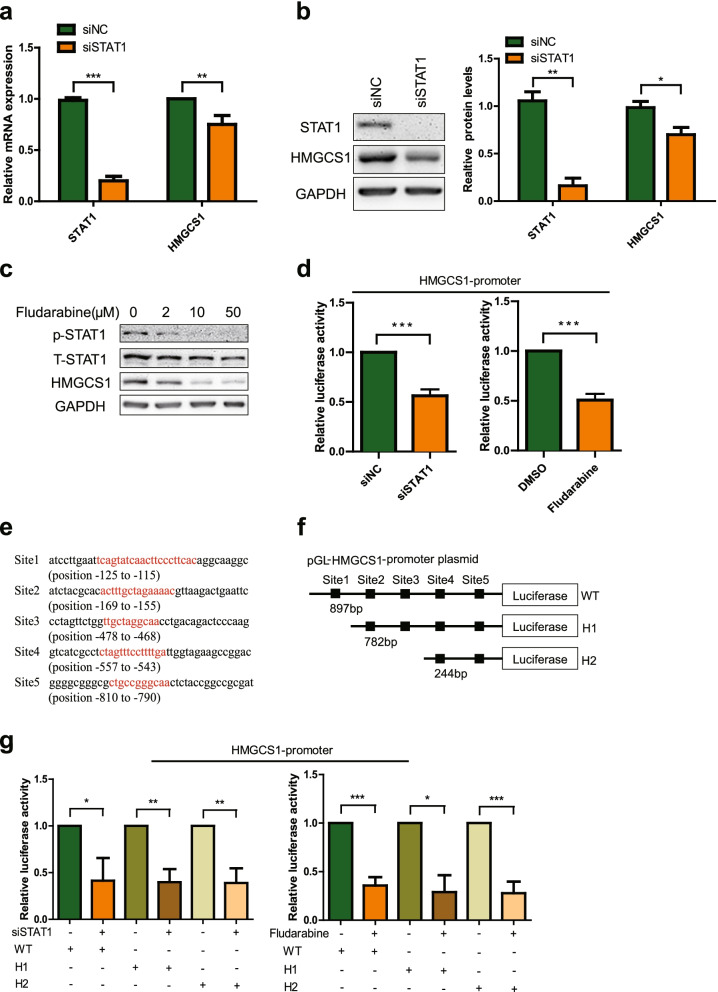
Lipotoxicity induced by the overload of lipid in the liver, especially excess free cholesterol (FC), has been recognized as one of driving factors in the transition from non-alcoholic fatty liver (NAFL) to non-alcoholic steatohepatitis (NASH). MicroRNA (miR)-379-5p has been reported to play regulatory roles in hepatic triglyceride homeostasis, but the relationship of miR-379-5p and hepatic cholesterol homeostasis has never been touched. In the current study, we found that hepatic miR-379-5p levels were decreased obviously in NAFLD patients and model mice compared with their controls. Moreover, miR-379-5p was discovered to be able to inhibit intracellular FC accumulation and alleviate mitochondrial damage induced by palmitic acid (PA) in vitro. Furthermore, overexpression of miR-379-5p in HFHC-fed db/db mice could reduce the level of hepatic total cholesterol (TC) and FC, and ameliorate hepatic injury reflected by the lower serum alanine aminotransferase (ALT) and aspartate transaminase (AST). Subsequently, by combining spectrometry (MS) and luciferase assay, we identified miR-379-5p suppressed STAT1 through transcriptional and translational regulation. Finally, we confirmed that STAT1 was a transcriptional factor of HMGCS1. In conclusion, miR-379-5p inhibits STAT1 expression and regulates cholesterol metabolism through the STAT1/HMGCS1 axis, suggesting miR-379-5p might be applied to improve lipotoxicity in the future.
Keywords: Cholesterol metabolism; HMGCS1; MiR-379-5p; Non-alcoholic fatty liver disease; STAT1.
© 2022. The Author(s).
Conflict of interest statement
The authors declare that the research has no potential conflict of interest.
Figures
Similar articles
-
NF-κB-upregulated miR-155-5p promotes hepatocyte mitochondrial dysfunction to accelerate the development of nonalcoholic fatty liver disease through downregulation of STC1.J Biochem Mol Toxicol. 2022 Jun;36(6):e23025. doi: 10.1002/jbt.23025. Epub 2022 May 23. J Biochem Mol Toxicol. 2022. PMID: 35603999
-
Gan-Jiang-Ling-Zhu decoction alleviates hepatic steatosis in rats by the miR-138-5p/CPT1B axis.Biomed Pharmacother. 2020 Jul;127:110127. doi: 10.1016/j.biopha.2020.110127. Epub 2020 Apr 20. Biomed Pharmacother. 2020. PMID: 32325349
-
Dicer1/miR-29/HMGCR axis contributes to hepatic free cholesterol accumulation in mouse non-alcoholic steatohepatitis.Acta Pharmacol Sin. 2017 May;38(5):660-671. doi: 10.1038/aps.2016.158. Epub 2017 Jan 23. Acta Pharmacol Sin. 2017. PMID: 28112179 Free PMC article.
-
Recent insights on the role of cholesterol in non-alcoholic fatty liver disease.Biochim Biophys Acta. 2015 Sep;1852(9):1765-78. doi: 10.1016/j.bbadis.2015.05.015. Epub 2015 May 29. Biochim Biophys Acta. 2015. PMID: 26027904 Review.
-
Role of Cholesterol-Associated Steatohepatitis in the Development of NASH.Hepatol Commun. 2022 Jan;6(1):12-35. doi: 10.1002/hep4.1801. Epub 2021 Aug 24. Hepatol Commun. 2022. PMID: 34558856 Free PMC article. Review.
Cited by
-
Early life interventions metformin and trodusquemine metabolically reprogram the developing mouse liver through transcriptomic alterations.Aging Cell. 2024 Sep;23(9):e14227. doi: 10.1111/acel.14227. Epub 2024 May 27. Aging Cell. 2024. PMID: 38798180 Free PMC article.
-
LEF1 influences diabetic retinopathy and retinal pigment epithelial cell ferroptosis via the miR-495-3p/GRP78 axis through lnc-MGC.World J Diabetes. 2025 Mar 15;16(3):92003. doi: 10.4239/wjd.v16.i3.92003. World J Diabetes. 2025. PMID: 40093269 Free PMC article.
-
Histone serotonylation promotes pancreatic cancer development via lipid metabolism remodeling.Nat Commun. 2025 Jul 1;16(1):5947. doi: 10.1038/s41467-025-61197-z. Nat Commun. 2025. PMID: 40593695 Free PMC article.
-
Exploring Phytochemical Mechanisms in the Prevention of Cholesterol Dysregulation: A Review.J Agric Food Chem. 2024 Apr 3;72(13):6833-6849. doi: 10.1021/acs.jafc.3c09924. Epub 2024 Mar 22. J Agric Food Chem. 2024. PMID: 38517334 Free PMC article. Review.
-
Thymosin β4 Regulates Tissue Inflammatory Response in Mouse Nonalcoholic Fatty Liver Disease by Promoting Macrophage M2-Type Polarization.J Inflamm Res. 2025 Apr 29;18:5791-5809. doi: 10.2147/JIR.S492814. eCollection 2025. J Inflamm Res. 2025. PMID: 40322536 Free PMC article.
References
Grants and funding
LinkOut - more resources
Full Text Sources
Research Materials
Miscellaneous