

Matrix stiffness and architecture drive fibro-adipogenic progenitors' activation into myofibroblasts
- PMID: 35945422
- PMCID: PMC9363488
- DOI: 10.1038/s41598-022-17852-2
Matrix stiffness and architecture drive fibro-adipogenic progenitors' activation into myofibroblasts
Abstract
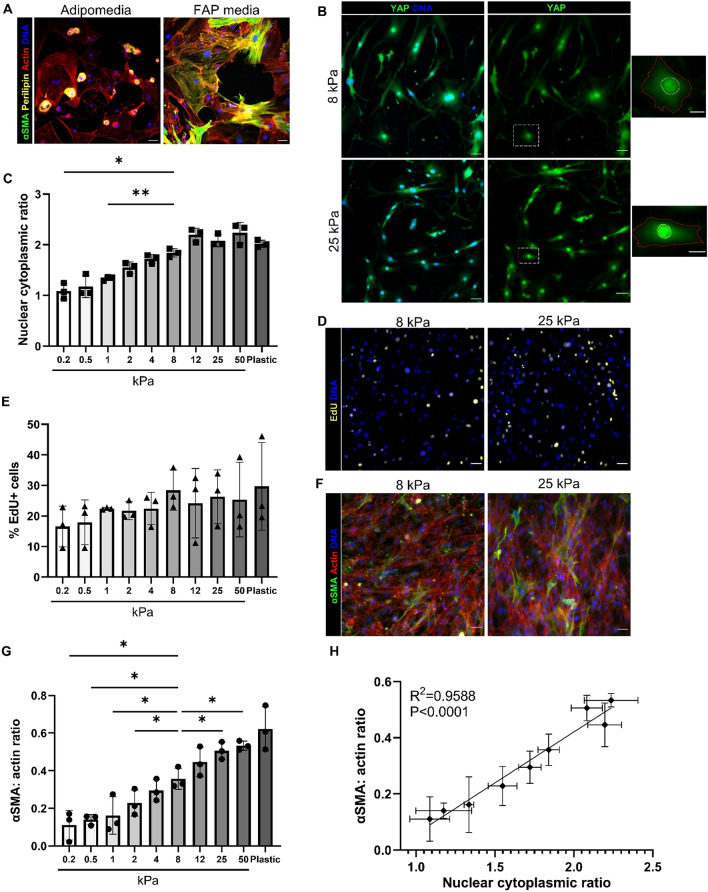
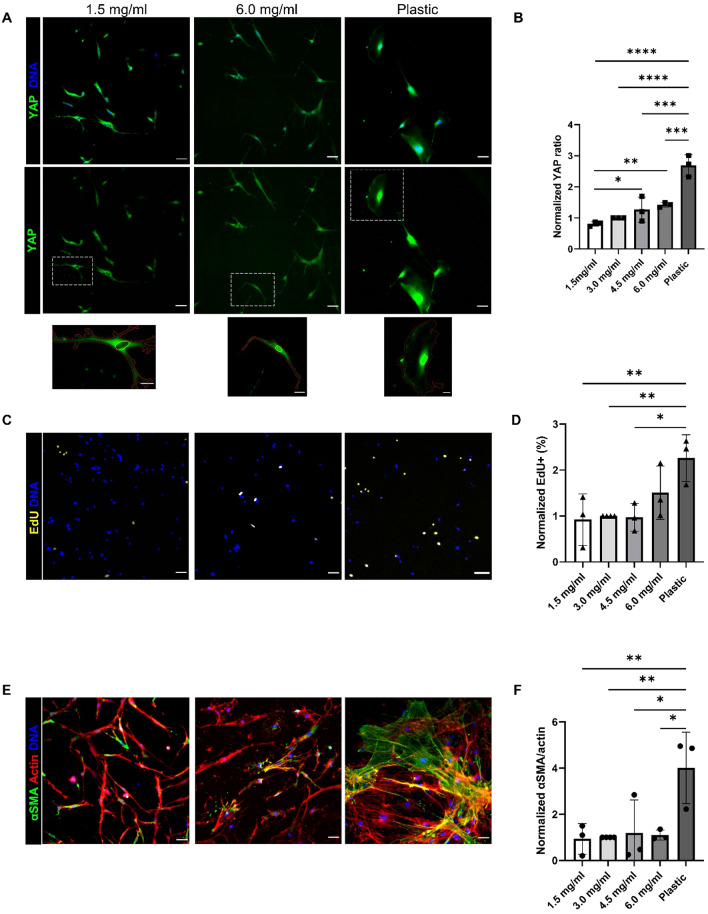
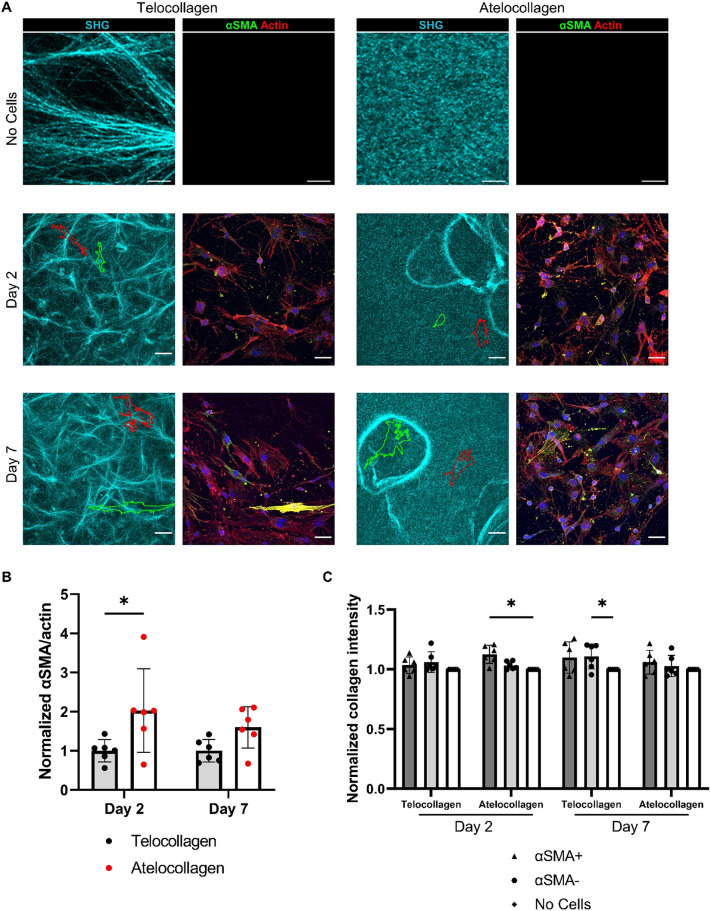
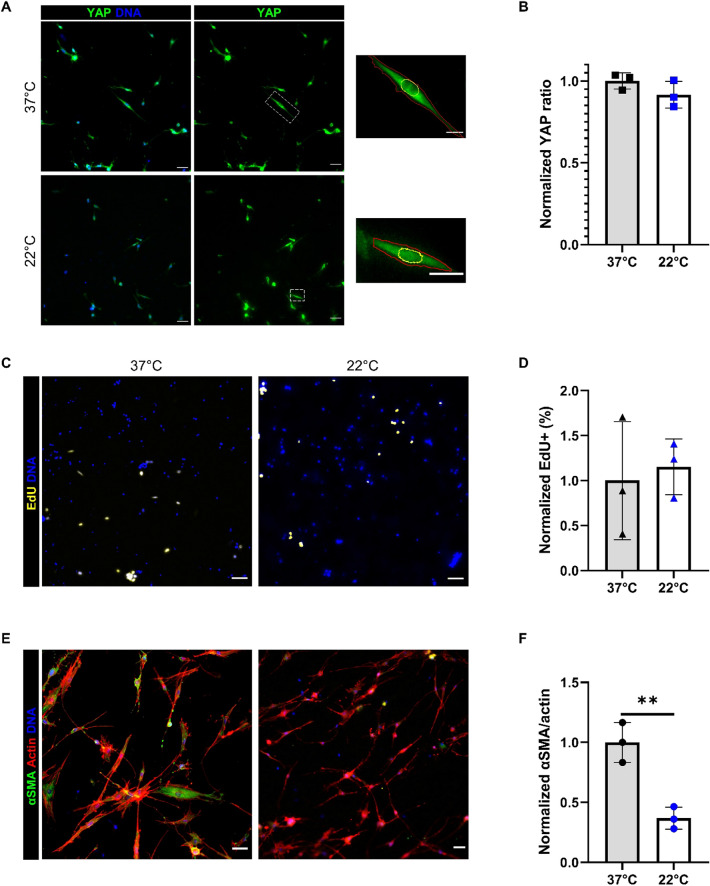
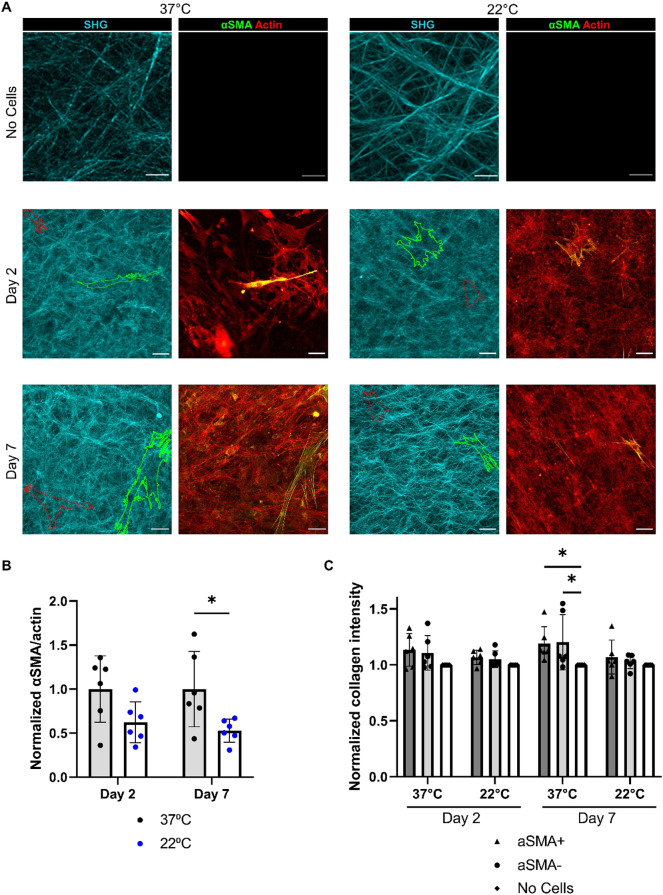
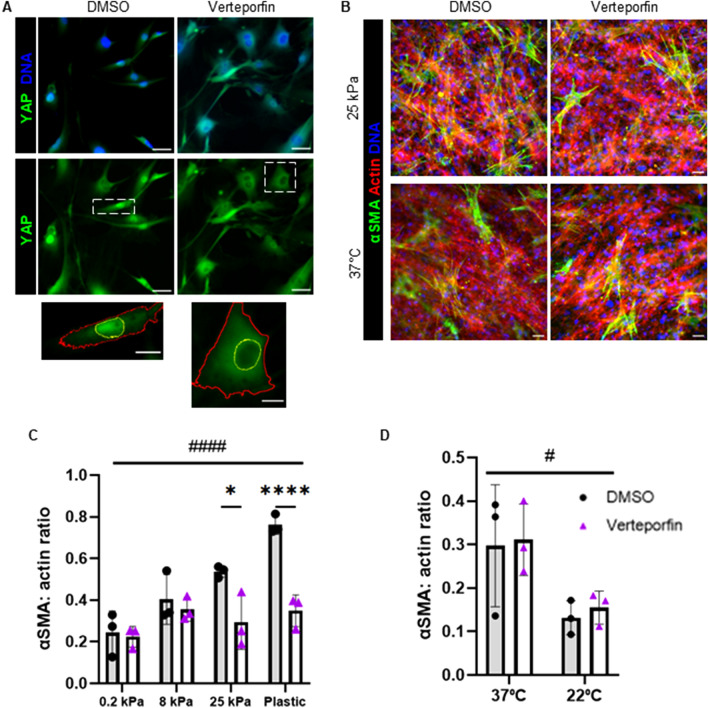
Fibro-adipogenic progenitors (FAPs) are essential in supporting regeneration in skeletal muscle, but in muscle pathologies FAPs the are main source of excess extracellular matrix (ECM) resulting in fibrosis. Fibrotic ECM has altered mechanical and architectural properties, but the feedback onto FAPs of stiffness or ECM properties is largely unknown. In this study, FAPs' sensitivity to their ECM substrate was assessed using collagen coated polyacrylamide to control substrate stiffness and collagen hydrogels to engineer concentration, crosslinking, fibril size, and alignment. FAPs on substrates of fibrotic stiffnesses had increased myofibroblast activation, depicted by αSMA expression, compared to substrates mimicking healthy muscle, which correlated strongly YAP nuclear localization. Surprisingly, fibrosis associated collagen crosslinking and larger fibril size inhibited myofibroblast activation, which was independent of YAP localization. Additionally, collagen crosslinking and larger fibril diameters were associated with decreased remodeling of the collagenous substrate as measured by second harmonic generation imaging. Inhibition of YAP activity through verteporfin reduced myofibroblast activation on stiff substrates but not substrates with altered architecture. This study is the first to demonstrate that fibrotic muscle stiffness can elicit FAP activation to myofibroblasts through YAP signaling. However, fibrotic collagen architecture actually inhibits myofibroblast activation through a YAP independent mechanism. These data expand knowledge of FAPs sensitivity to ECM and illuminate targets to block FAP's from driving progression of muscle fibrosis.
© 2022. The Author(s).
Conflict of interest statement
The authors declare no competing interests.
Figures

Similar articles
-
Role of TGF-β/SMAD/YAP/TAZ signaling in skeletal muscle fibrosis.Am J Physiol Cell Physiol. 2025 Mar 1;328(3):C1015-C1028. doi: 10.1152/ajpcell.00541.2024. Epub 2025 Feb 10. Am J Physiol Cell Physiol. 2025. PMID: 39925133
-
Thrown for a loop: fibro-adipogenic progenitors in skeletal muscle fibrosis.Am J Physiol Cell Physiol. 2023 Oct 1;325(4):C895-C906. doi: 10.1152/ajpcell.00245.2023. Epub 2023 Aug 21. Am J Physiol Cell Physiol. 2023. PMID: 37602412 Free PMC article. Review.
-
The Role of Matrix Metalloproteinase-13 (MMP13) in TGFβ/BMP Pathway Regulation of Fibro-Adipogenic Progenitor (FAP) Differentiation.Cell Physiol Biochem. 2022 Dec 20;56(6):730-743. doi: 10.33594/000000596. Cell Physiol Biochem. 2022. PMID: 36537139
-
Involvement of lysophosphatidic acid-LPA1-YAP signaling in healthy and pathological FAPs migration.Matrix Biol. 2024 Nov;133:103-115. doi: 10.1016/j.matbio.2024.08.005. Epub 2024 Aug 15. Matrix Biol. 2024. PMID: 39153517
-
Signaling pathways regulating the fate of fibro/adipogenic progenitors (FAPs) in skeletal muscle regeneration and disease.FEBS J. 2022 Nov;289(21):6484-6517. doi: 10.1111/febs.16080. Epub 2021 Jul 6. FEBS J. 2022. PMID: 34143565 Review.
Cited by
-
Imaging mass cytometry analysis of Becker muscular dystrophy muscle samples reveals different stages of muscle degeneration.Sci Rep. 2024 Feb 9;14(1):3365. doi: 10.1038/s41598-024-51906-x. Sci Rep. 2024. PMID: 38336890 Free PMC article.
-
Macrophages in the Context of Muscle Regeneration and Duchenne Muscular Dystrophy.Int J Mol Sci. 2024 Sep 27;25(19):10393. doi: 10.3390/ijms251910393. Int J Mol Sci. 2024. PMID: 39408722 Free PMC article. Review.
-
Decellularized Cell-Secreted Extracellular Matrices as Biomaterials for Tissue Engineering.Small Sci. 2024 Dec 6;5(2):2400335. doi: 10.1002/smsc.202400335. eCollection 2025 Feb. Small Sci. 2024. PMID: 40213064 Free PMC article. Review.
-
The Myofibroblast Fate of Therapeutic Mesenchymal Stromal Cells: Regeneration, Repair, or Despair?Int J Mol Sci. 2024 Aug 9;25(16):8712. doi: 10.3390/ijms25168712. Int J Mol Sci. 2024. PMID: 39201399 Free PMC article. Review.
-
The extracellular matrix of dystrophic mouse diaphragm accounts for the majority of its passive stiffness and is resistant to collagenase digestion.Matrix Biol Plus. 2023 Mar 13;18:100131. doi: 10.1016/j.mbplus.2023.100131. eCollection 2023 Jun. Matrix Biol Plus. 2023. PMID: 36970609 Free PMC article.
References
Publication types
MeSH terms
Substances
Grants and funding
LinkOut - more resources
Full Text Sources
Miscellaneous
