. 2022 Aug 8;12(1):13538.
doi: 10.1038/s41598-022-17898-2.

Construction of a hypoxia-derived gene model to predict the prognosis and therapeutic response of head and neck squamous cell carcinoma

Affiliations

Construction of a hypoxia-derived gene model to predict the prognosis and therapeutic response of head and neck squamous cell carcinoma

Haibin Wang et al. Sci Rep. .

Abstract

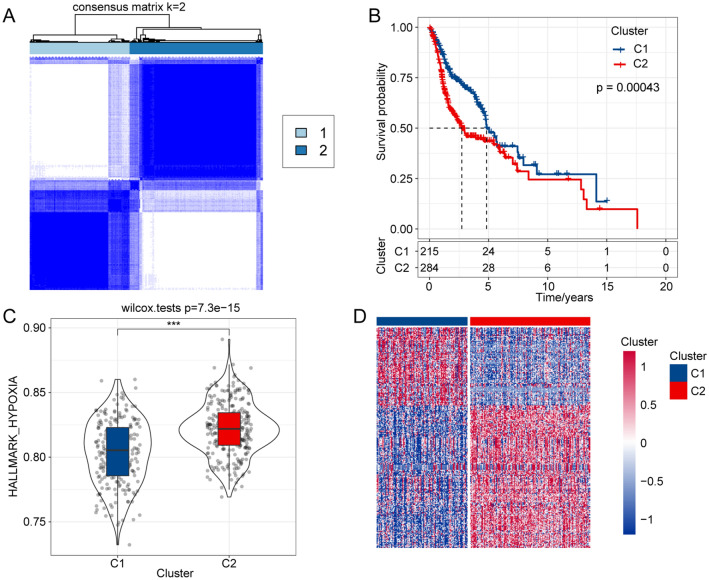
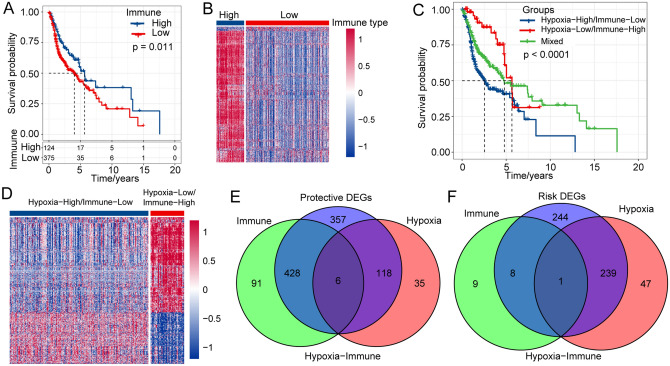
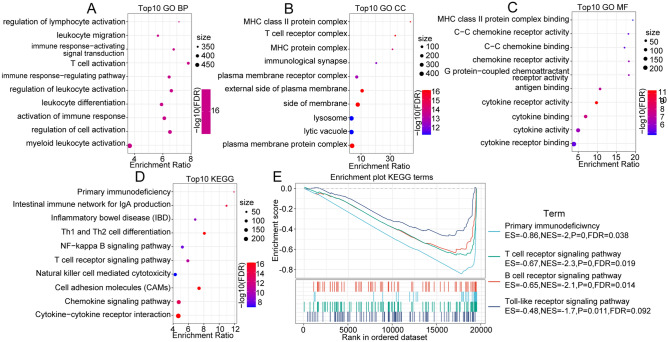
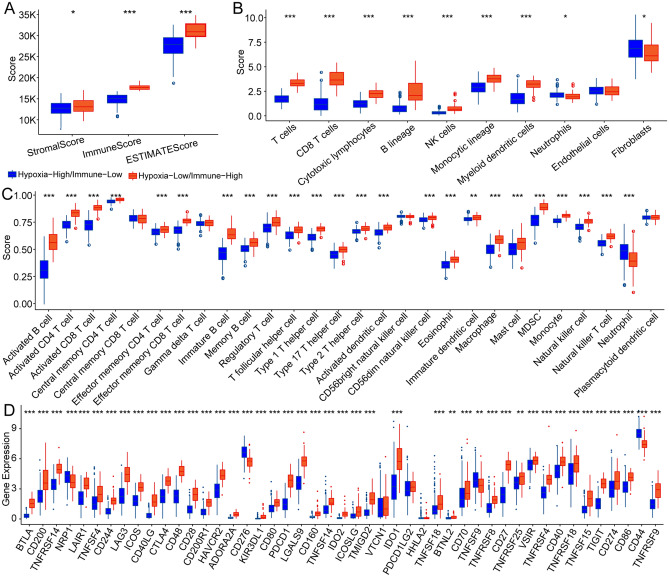
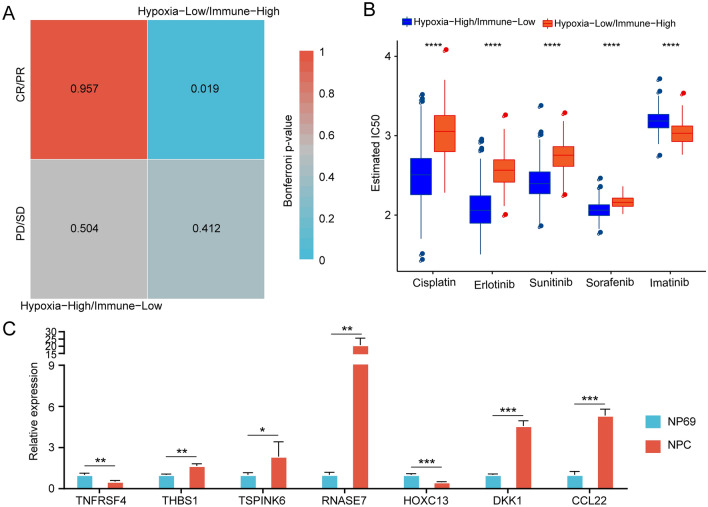
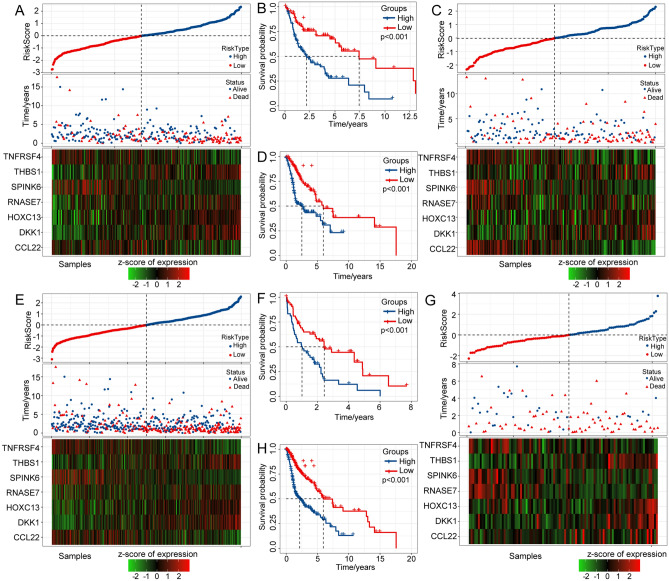
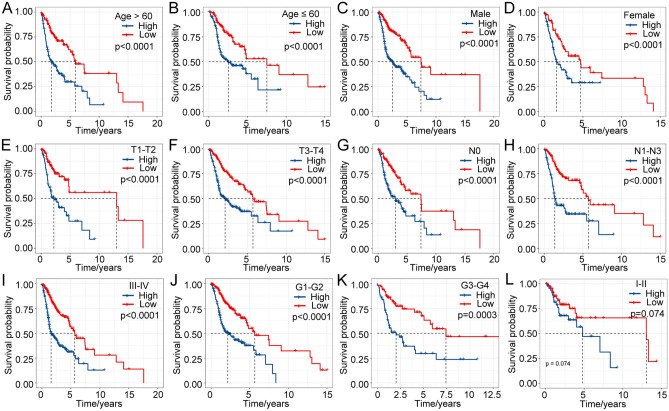
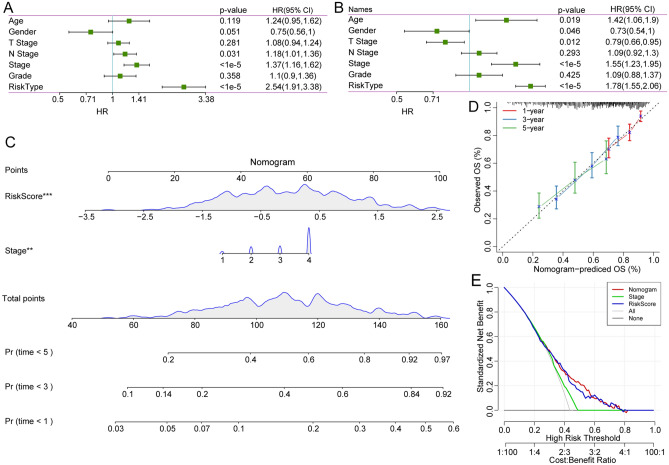
Head and neck squamous cell carcinoma (HNSCC) ranks as the sixth most common cancer worldwide and has a poor prognosis in the advanced stage. Increasing evidence has shown that hypoxia contributes to genetic alterations that have essential effects on the occurrence and progression of cancers. However, the exact roles hypoxia-related genes play in HNSCC remain unclear. In this study, we downloaded the mRNA expression profiles and clinical data of patients with HNSCC from The Cancer Genome Atlas and Gene Expression Omnibus. Two molecular subtypes were identified based on prognostic hypoxia-related genes using the ConsensusClusterPlus method. ESTIMATE was used to calculate the immune score of each patient. Kyoto Encyclopedia of Genes and Genomes and Gene Ontology were used for functional annotation. A prognostic risk model was generated by Cox regression and least absolute shrinkage and selection operator analysis. We identified two distinct molecular subtypes, cluster 1 and cluster 2, based on 200 hypoxia-related genes. Additionally, we identified three hypoxia-immune subgroups (hypoxia-high/immune-low, hypoxia-low/immune-high, and mixed subgroups). The hypoxia-high/immune-low group had the worst prognosis, while the hypoxia-low/immune-high group had the best prognosis. Patients in the hypoxia-low/immune-high group were more sensitive to anti-PD-L1 treatment and chemotherapy than those in the hypoxia-high/immune-low group. Furthermore, we constructed a prognostic risk model based on the differentially expressed genes between the hypoxia-immune subgroups. The survival analysis and time-dependent ROC analysis results demonstrated the good performance of the established 7-gene signature for predicting HNSCC prognosis. In conclusions, the constructed hypoxia-related model might serve as a promising biomarker for the diagnosis and prognosis of HNSCC, and it could predict immunotherapy and chemotherapy efficacy in HNSCC.


Conflict of interest statement

The authors declare no competing interests.

Figures

Figure 1
Figure 1
Identification of hypoxia-related molecular subtypes in HNSCC. (A) Two hypoxia-related subtypes were identified by ConsensusClusterPlus clustering analysis. (B) Survival curve analysis of the two distinct molecular subtypes. (C) ssGSEA of the molecular subtypes. (D) Analysis of differentially expressed genes between molecular subtypes by the limma R package.
Figure 2
Figure 2
Identification of subgroups of hypoxic immune microenvironments. (A) Survival analysis of the immunization group. (B) Analysis of differentially expressed genes in the immunization group. (C) Survival curve of hypoxic immune microenvironment grouping. (D) Heatmap of differentially expressed genes among hypoxic immune microenvironmental groups, and R software v3.5.0 (version 3.6.1) was adopted to drawn the heat map. (E) Identification of protective differential genes. (F) Identification of risk differential genes.
Figure 3
Figure 3
(A) BP annotation map of protective DEGs. (B) CC annotation map of protective DEGs, and R software v3.5.0 (version 3.6.1) was adopted to drawn the annotation map. (C) MF annotation map of protective DEGs. (D) KEGG annotation map of protective DEGs, and R software v3.5.0 (version 3.6.1) was adopted to drawn the annotation map. (E) GSEA of pathways enriched in hypoxic immune grouping. Abbreviations: BP, biological process; CC, cellular component; MF, molecular function; KEGG, Kyoto Encyclopedia of Genes and Genomes.
Figure 4
Figure 4
Immune microenvironment analysis and immune checkpoint analysis of hypoxia-immune groups. (A) Comparison of differences in immunological scores between different hypoxia-immune groups. (B) Comparison of differences in the MCP-counter immunity score between hypoxia-immune groups. (C) Comparison of ssGSEA immune score differences between hypoxia-immune groups. (D) Comparison of differences in immune checkpoints between hypoxia-immune groups. *p < 0.05, **p < 0.01, ***p < 0.001.
Figure 5
Figure 5
Differential analysis of immunotherapy and chemotherapy for hypoxic-immune subtypes. (A) Submap analysis showed that IC1 could be more sensitive to anti-PD-L1 treatment. (B) Box plots of the estimated IC50 values for cisplatin, erlotinib, sunitinib, sorafenib, and imatinib. (C) qRT-PCR analysis showed the expression levels of the key genes in NPC and NP69 cell lines. *p < 0.05, **p < 0.01, ***p < 0.001.
Figure 6
Figure 6
Construction and validation of a prognostic risk model based on DEGs between hypoxia-immune subtypes.
Figure 7
Figure 7
Prognostic efficiency of the risk model in patients with different clinical characteristics in the TCGA dataset.
Figure 8
Figure 8
Construction of the nomogram for predicting the prognosis of HNSCC patients in the TCGA-HNSC cohort. Univariate Cox regression analysis (A) and multivariate Cox regression analysis (B) showed that the seven-gene signature was an independent risk factor. (C) Nomogram constructed by the risk score and stage in HNSCC patients. (D) Survival rate correction curves of the nomogram. (E) DCA curves of the nomogram, stage, and risk score showed that the nomogram had good predictive performance.

Similar articles

Cited by

References

    1. Sung H, et al. Global cancer statistics 2020: GLOBOCAN estimates of incidence and mortality worldwide for 36 cancers in 185 countries. CA Cancer J. Clin. 2021;71:209–249. - PubMed
    1. Ferlay J, et al. Estimating the global cancer incidence and mortality in 2018: GLOBOCAN sources and methods. Int. J. Cancer. 2019;144:1941–1953. doi: 10.1002/ijc.31937. - DOI - PubMed
    1. Ward MJ, et al. Tumour-infiltrating lymphocytes predict for outcome in HPV-positive oropharyngeal cancer. Br. J. Cancer. 2014;110:489–500. doi: 10.1038/bjc.2013.639. - DOI - PMC - PubMed
    1. Pulte D, Brenner H. Changes in survival in head and neck cancers in the late 20th and early 21st century: A period analysis. Oncologist. 2010;15:994–1001. doi: 10.1634/theoncologist.2009-0289. - DOI - PMC - PubMed
    1. Johnson DE, et al. Head and neck squamous cell carcinoma. Nat. Rev. Dis. Primers. 2020;6:92. doi: 10.1038/s41572-020-00224-3. - DOI - PMC - PubMed

Publication types

MeSH terms

Substances